Learn To Trade Forex • Best Forex Trading Course • AsiaForexMentor

Weighted / Exponential Moving Average (200 EMA) – Does it work?

Written by

Ezekiel Chew

Updated on

January 29, 2024

i
Its a default text

Weighted / Exponential Moving Average (200 EMA) – Does it work?

Written by:

Last updated on:

January 29, 2024


Weighted Exponential Moving Average

Weighted/ Exponential Moving Average

The Exponential Moving Average(EMA) also known as weighted moving average… A moving average deemed more powerful than the simple moving average especially in longer periods. The most popular and widely used EMA setting would be the 200 period setting. Hence in this article, we will explore the usage of EMA with the 200 period setting as a sample.


Weighted/Exponential Moving Average

  1. What is it?
  2. How is EMA calculated?
  3. How to use?
  4. Pros & cons
  5. 200 EMA breakdown
  6. Conclusion
  7. Rating
  8. Infographic

What is it?

An exponential moving average (EMA) is a type of moving average (MA) that places a greater weight and significance on the most recent data points. The exponential moving average is also referred to as the exponentially weighted moving average. An exponentially weighted moving average reacts more significantly to recent price changes than a simple moving average (SMA), which applies an equal weight to all observations in the period. Similar to the Simple Moving Average(SMA), users are able to tweak the parameters of the indicator, which contains the period, shift, method and application. Firstly, the period of the indicator is the number of past candles taken into calculation. Secondly, the shift of the indicator is the change in the candles taken into calculation without changing the period, from the most recent candle. Thirdly, the method of the indicator refers to the type of calculation involved. Lastly, the application of the indicator refers to the type of sample data to be used for the calculation.
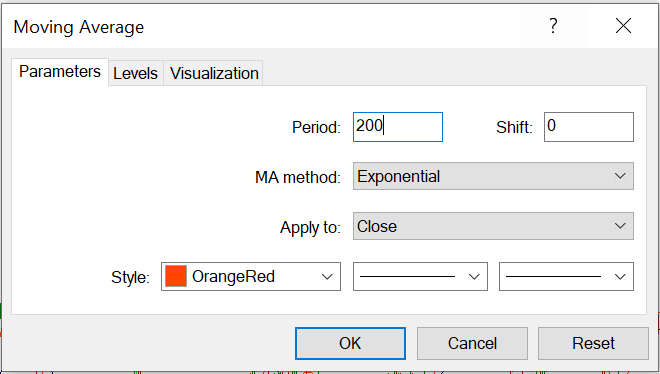
exponential moving average

Back to top

How is EMA calculated?

As similar as it may seem to its counterpart, the SMA, the EMA’s calculation is very different from the SMA. The calculation is done exponentially where it results in reflecting recent candles in a heavier weightage.
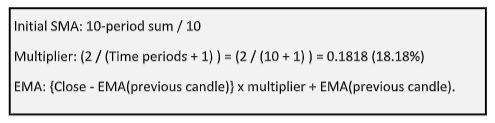
ema calculation

Instead of dividing the weightage of the calculation evenly among the candles in the period like the SMA, the EMA is able to provide a smoother and less choppy support and resistance.

Also read: Support and Resistance

Back to top

How to use?

The EMA can be used in multiple ways. Like the SMA, it can be used as part of a crossover set up to find entries and exits. Also, it can be used to identify bullish and bearish trends. Both methods of using the moving average have been explored in the SMA article. Though they are quite similar, the main difference is that EMA is deemed by many to be a stronger dynamic support and resistance line. Thus, the main objective of this article will be targeted to uncover exactly how strong and reliable the EMA is in terms of dynamic support and resistance. With that, the most common period setting, 200, will be used here as a sample.

Also read: Simple Moving Average Trading Strategy

Back to top

Pros & cons

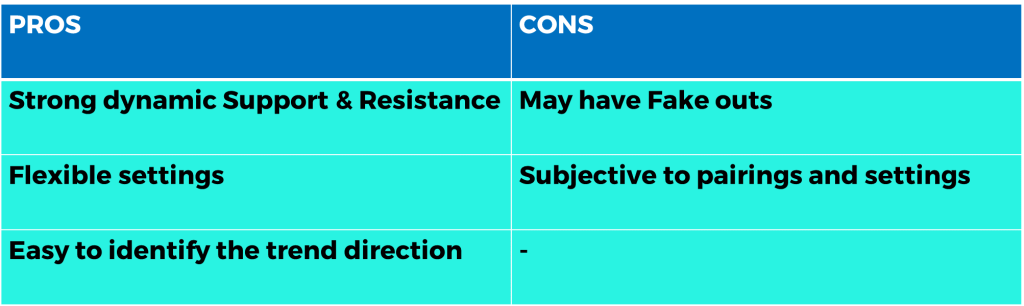
The EMA as mentioned is a good dynamic support and resistance line which also identifies the trends of the market relatively well especially in the long term. To top that off, it is flexible with customisable settings to suit unique trading strategies. However, it may still be prone to fake outs at times, especially when the support and resistance is a zone concept and thus a single line may not be 100% accurate at representing it, therefore using it alone as a gauge of support and resistance might lead to observed fake outs due to subjectivity. This is of course subjected to the characteristics of the individual pairings it is applied to and the settings on the EMA itself.
weighted Exponential moving average Pros & cons

Back to top

200 EMA breakdown

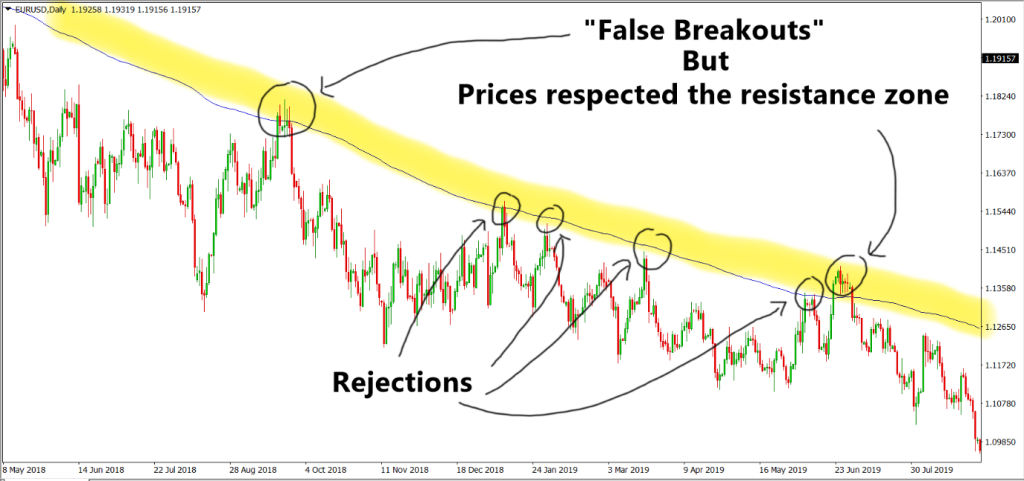
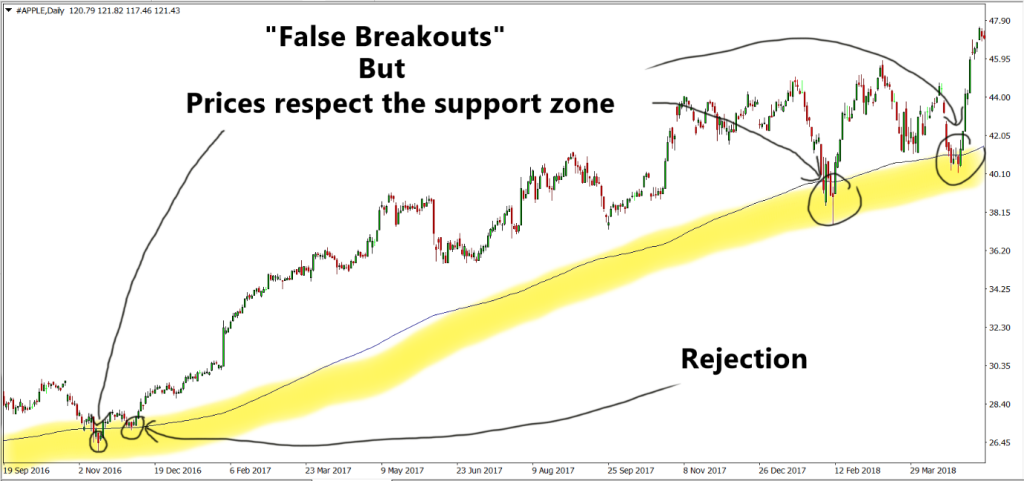
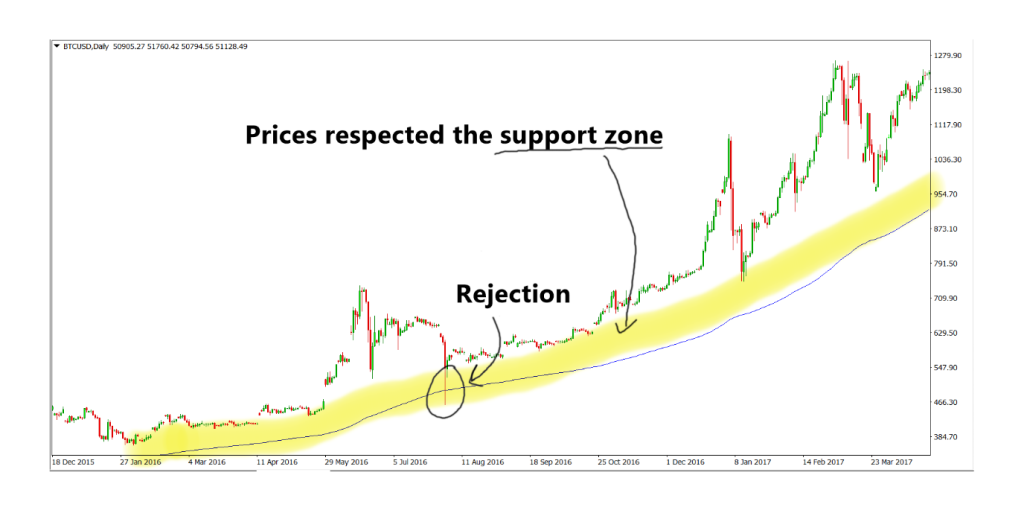
To evaluate the reliability and strength of the 200 EMA, we must first define what makes a good dynamic support and resistance line. The major factor to take into consideration will be the responsiveness of the support and resistance. To measure this, we will simply take the average number of exact rejections (no false breakouts) in a trend to determine if the 200 EMA aligns with the support and resistance zone in the market. Also, we can take the average number of times a false breakout occurs before the complete change in trend as further evidence to support the responsiveness of 200 EMA as a support and resistance. On top of that, for clarity, we will also be testing for the definition of a trend. A trend is a clear direction in the market, consisting of the formation of higher highs and higher lows(Bullish) or lower highs and lower lows(Bearish). Going further in-depth to measure a trend, we will take the average number of candles found in a trend until it changes to the other market direction. In this backtest we will be using EURUSD as a sample for Forex, AAPL as a sample for Stocks and BTCUSD as a sample for Cryptocurrencies. The figures below illustrate the results of the test. All tests were done in the Daily timeframe.
exponential moving average on EURUSD on the Daily timeframe
EURUSD on the Daily timeframe
weighted moving average on AAPL on the Daily timeframe
AAPL on the Daily timeframe
weighted exponential moving average on BTCUSD on the Daily timeframe
BTCUSD on the Daily timeframe

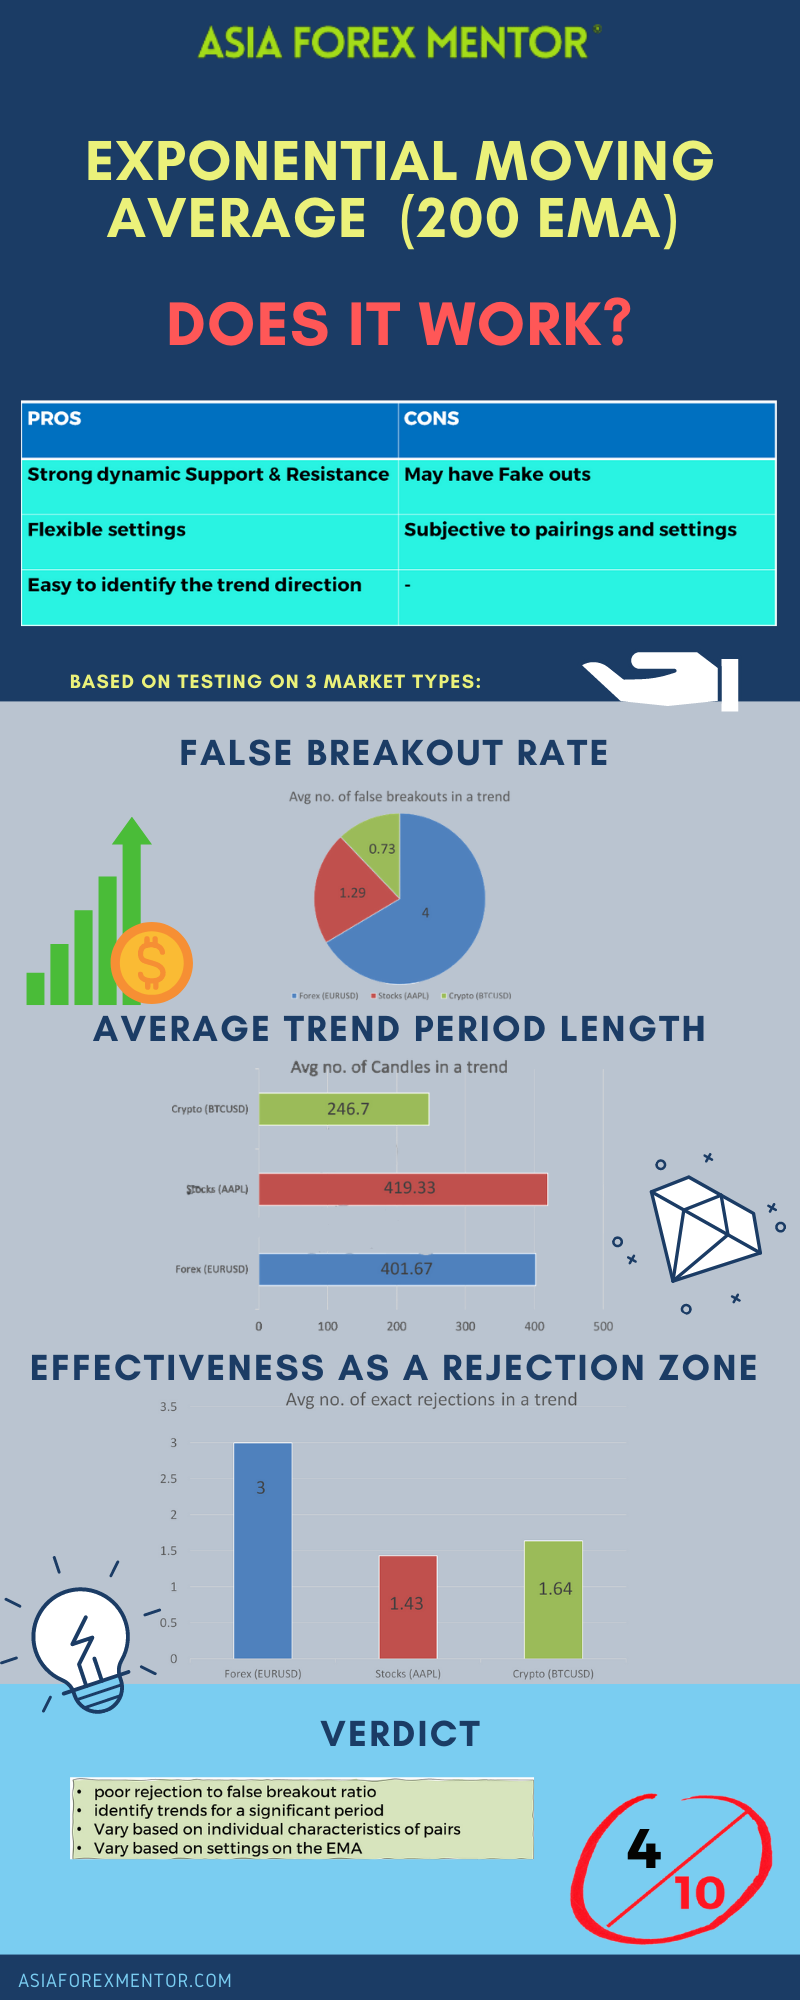
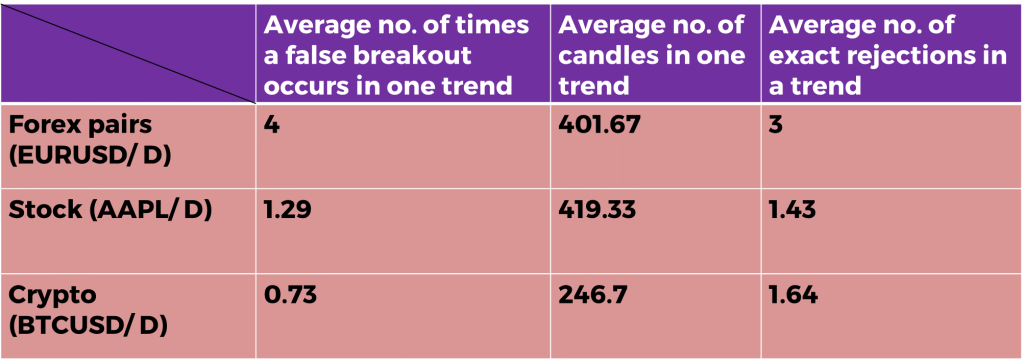
As shown in our backtest, the average no. of candles in one trend for EURUSD (Forex) is 401.67 candles, AAPL (Stocks) is 419.33 candles and BTC (Crypto) is 246.7 candles.

The average no. of times a false breakout occurs in one trend for EURUSD (Forex) is 4 times, AAPL (Stocks) is 1.29 and BTC (Crypto) is 0.73.

The average no. of exact rejections in a trend for EURUSD (Forex) is 3, AAPL (Stocks) is 1.43 and BTC (Crypto) is 1.64. 

weighted exponential moving average win rate

Back to top

Conclusion

The EMA is able to be customised and tweaked according to the trader’s set-up. In this case the 200 EMA had a poor rejection to false break out ratio. However, it does a decent job in determining trends as it is able to determine on average about 356 candles in a trend. That is almost close to one year! Regardless, the weighted moving average / EMA can be a very powerful indicator to add to your set-up with the right settings, defining trends and assisting you in identifying rejection levels.

Back to top

Rating

4/10

Back to top

Infographic

weighted exponential moving average infographic

Back to top


About Ezekiel Chew​

Ezekiel Chew, founder and head of training at Asia Forex Mentor, is a renowned forex expert, frequently invited to speak at major industry events. Known for his deep market insights, Ezekiel is one of the top traders committed to supporting the trading community. Making six figures per trade, he also trains traders working in banks, fund management, and prop trading firms.

How to Read Candlesticks (Most Traders Get This Wrong)

Most traders who spend months learning how to read candlesticks still lose on setups that looked textbook. The pattern was never the problem. Reading it without context was. ABOUT THIS GUIDE This guide covers three specific candlestick signals used in professional price action trading, the Fibonacci golden zone context tool,

Read More

What Profit Factor Tells You Before Going Live

Profit factor is calculated by dividing a strategy’s total gross profit by its total gross loss, and most experienced traders reject any system that reads below 1.5 before risking real capital. Most traders see any positive number and call it a green light. That is where the costly mistake starts.

Read More

6 Forex Trading Scams Every Beginner Should Know

The most effective forex trading scams do not announce themselves as threats. They arrive as opportunities, come through referrals and social media, and are often indistinguishable from legitimate services until the first withdrawal request is made. ABOUT THIS GUIDE This guide covers the six most common forex trading scams, the

Read More

How to Use Fibonacci Retracement Step by Step in 2026

Most traders learn how to use Fibonacci retracement and immediately draw it wrong. This tool comes from a mathematical sequence first documented in 1202, and institutional traders use it daily to plan entries at precise price levels. The majority of retail traders miss the one placement rule that makes every

Read More

Free Margin in Forex What the MT4 Panel Shows

Free margin in forex is the one figure on the MT4 or MT5 account panel that determines whether another position can open right now, and it is consistently the last number most traders learn to read. ABOUT THIS GUIDE This guide explains what free margin is and how it connects

Read More

Scalping Trading Strategy The Pros Actually Use

The scalping trading strategy most retail traders use is not actually scalping. They are gambling on 1-minute candles with no defined edge, no position-sizing rules, and no plan for when the losses come. ABOUT THIS GUIDE This guide covers what scalping is, how professional scalpers build a repeatable edge, and

Read More

AFM Trading Summit Live

Date: Coming Soon

Join us at the AFM Trading Summit Live and learn from top industry experts through live trading sessions, market insights, and actionable strategies.

Weighted / Exponential Moving Average (200 EMA) – Does it work?

4.0
Overall Trust Index

Written by:

Updated:

January 29, 2024


Weighted Exponential Moving Average

Weighted/ Exponential Moving Average

The Exponential Moving Average(EMA) also known as weighted moving average… A moving average deemed more powerful than the simple moving average especially in longer periods. The most popular and widely used EMA setting would be the 200 period setting. Hence in this article, we will explore the usage of EMA with the 200 period setting as a sample.


Weighted/Exponential Moving Average

  1. What is it?
  2. How is EMA calculated?
  3. How to use?
  4. Pros & cons
  5. 200 EMA breakdown
  6. Conclusion
  7. Rating
  8. Infographic

What is it?

An exponential moving average (EMA) is a type of moving average (MA) that places a greater weight and significance on the most recent data points. The exponential moving average is also referred to as the exponentially weighted moving average. An exponentially weighted moving average reacts more significantly to recent price changes than a simple moving average (SMA), which applies an equal weight to all observations in the period. Similar to the Simple Moving Average(SMA), users are able to tweak the parameters of the indicator, which contains the period, shift, method and application. Firstly, the period of the indicator is the number of past candles taken into calculation. Secondly, the shift of the indicator is the change in the candles taken into calculation without changing the period, from the most recent candle. Thirdly, the method of the indicator refers to the type of calculation involved. Lastly, the application of the indicator refers to the type of sample data to be used for the calculation.

exponential moving average

Back to top

How is EMA calculated?

As similar as it may seem to its counterpart, the SMA, the EMA’s calculation is very different from the SMA. The calculation is done exponentially where it results in reflecting recent candles in a heavier weightage.

ema calculation

Instead of dividing the weightage of the calculation evenly among the candles in the period like the SMA, the EMA is able to provide a smoother and less choppy support and resistance.

Also read: Support and Resistance

Back to top

How to use?

The EMA can be used in multiple ways. Like the SMA, it can be used as part of a crossover set up to find entries and exits. Also, it can be used to identify bullish and bearish trends. Both methods of using the moving average have been explored in the SMA article. Though they are quite similar, the main difference is that EMA is deemed by many to be a stronger dynamic support and resistance line. Thus, the main objective of this article will be targeted to uncover exactly how strong and reliable the EMA is in terms of dynamic support and resistance. With that, the most common period setting, 200, will be used here as a sample.

Also read: Simple Moving Average Trading Strategy

Back to top

Pros & cons

The EMA as mentioned is a good dynamic support and resistance line which also identifies the trends of the market relatively well especially in the long term. To top that off, it is flexible with customisable settings to suit unique trading strategies. However, it may still be prone to fake outs at times, especially when the support and resistance is a zone concept and thus a single line may not be 100% accurate at representing it, therefore using it alone as a gauge of support and resistance might lead to observed fake outs due to subjectivity. This is of course subjected to the characteristics of the individual pairings it is applied to and the settings on the EMA itself.

weighted Exponential moving average Pros & cons

Back to top

200 EMA breakdown

To evaluate the reliability and strength of the 200 EMA, we must first define what makes a good dynamic support and resistance line. The major factor to take into consideration will be the responsiveness of the support and resistance. To measure this, we will simply take the average number of exact rejections (no false breakouts) in a trend to determine if the 200 EMA aligns with the support and resistance zone in the market. Also, we can take the average number of times a false breakout occurs before the complete change in trend as further evidence to support the responsiveness of 200 EMA as a support and resistance. On top of that, for clarity, we will also be testing for the definition of a trend. A trend is a clear direction in the market, consisting of the formation of higher highs and higher lows(Bullish) or lower highs and lower lows(Bearish). Going further in-depth to measure a trend, we will take the average number of candles found in a trend until it changes to the other market direction. In this backtest we will be using EURUSD as a sample for Forex, AAPL as a sample for Stocks and BTCUSD as a sample for Cryptocurrencies. The figures below illustrate the results of the test. All tests were done in the Daily timeframe.
exponential moving average on EURUSD on the Daily timeframe
EURUSD on the Daily timeframe
weighted moving average on AAPL on the Daily timeframe
AAPL on the Daily timeframe
weighted exponential moving average on BTCUSD on the Daily timeframe
BTCUSD on the Daily timeframe

As shown in our backtest, the average no. of candles in one trend for EURUSD (Forex) is 401.67 candles, AAPL (Stocks) is 419.33 candles and BTC (Crypto) is 246.7 candles.

The average no. of times a false breakout occurs in one trend for EURUSD (Forex) is 4 times, AAPL (Stocks) is 1.29 and BTC (Crypto) is 0.73.

The average no. of exact rejections in a trend for EURUSD (Forex) is 3, AAPL (Stocks) is 1.43 and BTC (Crypto) is 1.64. 
weighted exponential moving average win rate

Back to top

Conclusion

The EMA is able to be customised and tweaked according to the trader’s set-up. In this case the 200 EMA had a poor rejection to false break out ratio. However, it does a decent job in determining trends as it is able to determine on average about 356 candles in a trend. That is almost close to one year! Regardless, the weighted moving average / EMA can be a very powerful indicator to add to your set-up with the right settings, defining trends and assisting you in identifying rejection levels.

Back to top

Rating

4/10

Back to top

Infographic

weighted exponential moving average infographic

Back to top


ezekiel chew asiaforexmentor

About Ezekiel Chew

Ezekiel Chew, founder and head of training at Asia Forex Mentor, is a renowned forex expert, frequently invited to speak at major industry events. Known for his deep market insights, Ezekiel is one of the top traders committed to supporting the trading community. Making six figures per trade, he also trains traders working in banks, fund management, and prop trading firms.

RELATED ARTICLES

Weighted / Exponential Moving Average (200 EMA) – Does it work?

4.0
Overall Trust Index

Written by:

Updated:

January 29, 2024


Weighted Exponential Moving Average

Weighted/ Exponential Moving Average

The Exponential Moving Average(EMA) also known as weighted moving average… A moving average deemed more powerful than the simple moving average especially in longer periods. The most popular and widely used EMA setting would be the 200 period setting. Hence in this article, we will explore the usage of EMA with the 200 period setting as a sample.


Weighted/Exponential Moving Average

  1. What is it?
  2. How is EMA calculated?
  3. How to use?
  4. Pros & cons
  5. 200 EMA breakdown
  6. Conclusion
  7. Rating
  8. Infographic

What is it?

An exponential moving average (EMA) is a type of moving average (MA) that places a greater weight and significance on the most recent data points. The exponential moving average is also referred to as the exponentially weighted moving average. An exponentially weighted moving average reacts more significantly to recent price changes than a simple moving average (SMA), which applies an equal weight to all observations in the period. Similar to the Simple Moving Average(SMA), users are able to tweak the parameters of the indicator, which contains the period, shift, method and application. Firstly, the period of the indicator is the number of past candles taken into calculation. Secondly, the shift of the indicator is the change in the candles taken into calculation without changing the period, from the most recent candle. Thirdly, the method of the indicator refers to the type of calculation involved. Lastly, the application of the indicator refers to the type of sample data to be used for the calculation.

exponential moving average

Back to top

How is EMA calculated?

As similar as it may seem to its counterpart, the SMA, the EMA’s calculation is very different from the SMA. The calculation is done exponentially where it results in reflecting recent candles in a heavier weightage.

ema calculation

Instead of dividing the weightage of the calculation evenly among the candles in the period like the SMA, the EMA is able to provide a smoother and less choppy support and resistance.

Also read: Support and Resistance

Back to top

How to use?

The EMA can be used in multiple ways. Like the SMA, it can be used as part of a crossover set up to find entries and exits. Also, it can be used to identify bullish and bearish trends. Both methods of using the moving average have been explored in the SMA article. Though they are quite similar, the main difference is that EMA is deemed by many to be a stronger dynamic support and resistance line. Thus, the main objective of this article will be targeted to uncover exactly how strong and reliable the EMA is in terms of dynamic support and resistance. With that, the most common period setting, 200, will be used here as a sample.

Also read: Simple Moving Average Trading Strategy

Back to top

Pros & cons

The EMA as mentioned is a good dynamic support and resistance line which also identifies the trends of the market relatively well especially in the long term. To top that off, it is flexible with customisable settings to suit unique trading strategies. However, it may still be prone to fake outs at times, especially when the support and resistance is a zone concept and thus a single line may not be 100% accurate at representing it, therefore using it alone as a gauge of support and resistance might lead to observed fake outs due to subjectivity. This is of course subjected to the characteristics of the individual pairings it is applied to and the settings on the EMA itself.

weighted Exponential moving average Pros & cons

Back to top

200 EMA breakdown

To evaluate the reliability and strength of the 200 EMA, we must first define what makes a good dynamic support and resistance line. The major factor to take into consideration will be the responsiveness of the support and resistance. To measure this, we will simply take the average number of exact rejections (no false breakouts) in a trend to determine if the 200 EMA aligns with the support and resistance zone in the market. Also, we can take the average number of times a false breakout occurs before the complete change in trend as further evidence to support the responsiveness of 200 EMA as a support and resistance. On top of that, for clarity, we will also be testing for the definition of a trend. A trend is a clear direction in the market, consisting of the formation of higher highs and higher lows(Bullish) or lower highs and lower lows(Bearish). Going further in-depth to measure a trend, we will take the average number of candles found in a trend until it changes to the other market direction. In this backtest we will be using EURUSD as a sample for Forex, AAPL as a sample for Stocks and BTCUSD as a sample for Cryptocurrencies. The figures below illustrate the results of the test. All tests were done in the Daily timeframe.

exponential moving average on EURUSD on the Daily timeframe
EURUSD on the Daily timeframe
weighted moving average on AAPL on the Daily timeframe
AAPL on the Daily timeframe
weighted exponential moving average on BTCUSD on the Daily timeframe
BTCUSD on the Daily timeframe

As shown in our backtest, the average no. of candles in one trend for EURUSD (Forex) is 401.67 candles, AAPL (Stocks) is 419.33 candles and BTC (Crypto) is 246.7 candles.

The average no. of times a false breakout occurs in one trend for EURUSD (Forex) is 4 times, AAPL (Stocks) is 1.29 and BTC (Crypto) is 0.73.

The average no. of exact rejections in a trend for EURUSD (Forex) is 3, AAPL (Stocks) is 1.43 and BTC (Crypto) is 1.64. 

weighted exponential moving average win rate

Back to top

Conclusion

The EMA is able to be customised and tweaked according to the trader’s set-up. In this case the 200 EMA had a poor rejection to false break out ratio. However, it does a decent job in determining trends as it is able to determine on average about 356 candles in a trend. That is almost close to one year! Regardless, the weighted moving average / EMA can be a very powerful indicator to add to your set-up with the right settings, defining trends and assisting you in identifying rejection levels.

Back to top

Rating

4/10

Back to top

Infographic

weighted exponential moving average infographic

Back to top


ezekiel chew asiaforexmentor

About Ezekiel Chew

Ezekiel Chew, founder and head of training at Asia Forex Mentor, is a renowned forex expert, frequently invited to speak at major industry events. Known for his deep market insights, Ezekiel is one of the top traders committed to supporting the trading community. Making six figures per trade, he also trains traders working in banks, fund management, and prop trading firms.

RELATED ARTICLES

Join the Live Event
Get Your Free Ticket Now

I consent to receiving emails and/or text message reminders for this event.

REGISTER FOR THE MASTERCLASS!