Ever looked at a chart and wondered why the Adam and Eve pattern often signals a big trend reversal? Many traders see it forming but hesitate to act. The price stalls, selling pressure fades, and soon a strong breakout trading strategy reveals itself. When the price breaks past a clear resistance line, the market sentiment shifts fast, showing how timing and patience matter more than prediction.
Every chart pattern tells a story, and this one shows where support lines strengthen before momentum builds. The Adam and Eve chart appears in both bullish and bearish reversals, but success depends on reading the pattern correctly. Knowing how it connects to a double bottom or double top pattern helps sharpen any trader’s overall trading strategy. Once recognized, the Eve double gives a strong signal that a new trend reversal may already be underway.
What Is an Adam and Eve Pattern?
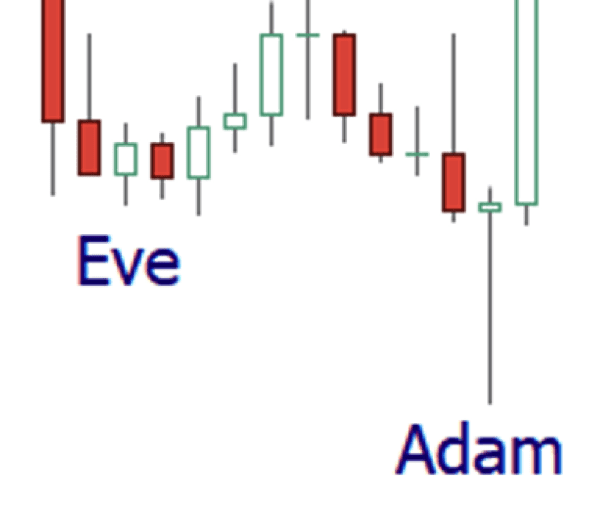
The Adam and Eve pattern is a rare chart pattern that traders use in technical analysis to spot potential trend reversals. It forms when price moves sharply down, then slowly recovers in a smooth u-shaped consolidation phase. The Adam peak forms first, creating a clear v shape that shows strong selling pressure. Then comes the Eve formation, which develops a wider u shaped or round shape bottom. When this pattern appears with high volume, it often signals that a bullish reversal pattern is forming after heavy selling.
In the adam and eve formation, two phases build a clear story of market participants shifting direction. The Adam side shows a sharp peak or v shaped bottom from panic selling, while the Eve chart pattern creates a slower, rounded shape recovery. When this double bottom chart pattern completes, the neckline level becomes the key resistance level to watch. A breakout above that horizontal line confirms that price action may reverse direction and start a bullish trend.
For traders, this adam eve structure provides both a plan and discipline. Many look for eve double bottoms or the adam and eve double setups on the 4-hour or daily charts. Entry usually happens when price breaks the neckline, while a stop loss is placed near the support level to manage risk. When identified correctly, this trading setup can reach a success rate above 80%, offering a clear profit target and strong buying pressure confirmation.
Understanding the Adam and Eve Formation
The Adam and Eve formation, explained by Thomas Bulkowski, starts with a deep double bottom Adam on strong volume indicator activity. This first drop shows panic among market participants, as price makes a sharp downward spike before slowly recovering. Then, the Eve top develops—a slower and smoother pattern shape that reflects fading selling pressure and growing interest from buyers preparing for a possible reversal.
When analyzed closely, the chart shows that the previous direction begins to lose momentum as the pattern shape widens. This gradual build-up forms part of traditional double bottoms, where traders prepare for potential trend reversals. Once the price breaks above the neckline, many traders take a long position, confirming that momentum has shifted. It is essential to identify the proper levels to enter safely and avoid false signals during the breakout.
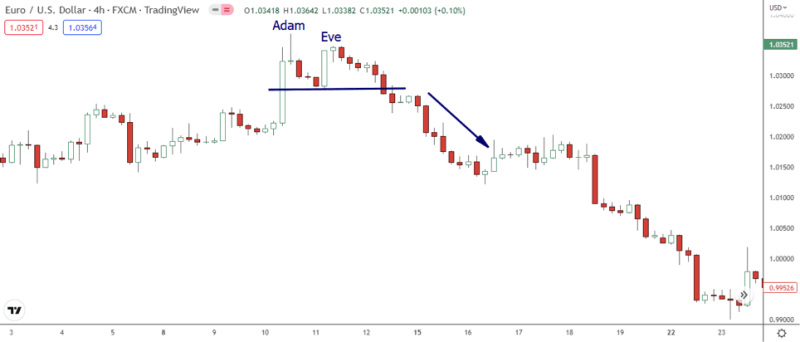
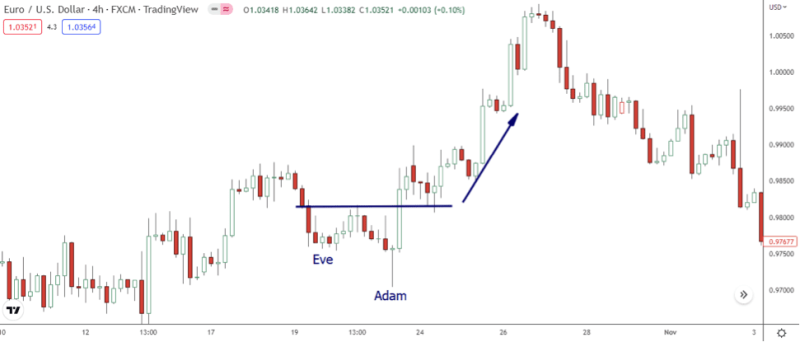
Sometimes, the Adam Eve setup can also appear as a bearish version or even an inverted form like a double top Adam. In this case, the bearish reversal pattern forms when two peaks appear instead of bottoms, signaling exhaustion in a bullish trend. Both the bullish version and the bearish version of this pattern demand patience and discipline, especially in forex trading, where timing and confirmation decide long-term success.
Different Formations of Adam and Eve Patterns
Adam and Eve Double Tops
The Adam and Eve double tops are a classic bearish pattern that often appears during strong uptrends. This setup forms two peaks that sit close together, separated by small troughs. According to Bulkowski, the distance or separation between these peaks should not exceed 6%, keeping the structure balanced and valid. After the first peak, the price usually drops by around ten to twenty percent before rising again to form the second top. This formation shows that buyers are losing strength, and the bullish momentum is starting to fade.
The confirmation level lies at the trough between the two peaks, marking the key support area to watch. When the price breaks below this point, it confirms the pattern’s completion and signals a short position setup. Bulkowski also advises waiting for a 5% decline below the confirmation level to avoid false signals and fake breakouts. The time gap between the peaks matters too, too close weakens reliability, while too far apart may mean the earlier uptrend has already lost power.
Adam and Eve Double Bottom
The Adam and Eve double bottoms form during a downtrend and often signal the start of a bullish reversal. This pattern shows two troughs that sit nearly parallel, separated by small peaks in between. According to Bulkowski, the distance between these troughs should not exceed 6%, keeping the structure balanced and reliable. After the first low, the price usually retraces about ten to twenty percent before falling again to create the second bottom. This second dip forms as selling pressure weakens, giving traders a sign that the downtrend may be losing strength.
The confirmation level is located at the peak between the two troughs, acting as the key breakout point. When the price breaks above this level, the pattern is complete, and traders can open a long position. Bulkowski suggests waiting for at least a 5% rise above the confirmation level to avoid false breakouts. The time spacing between the troughs also matters. If they form too close, the setup may not be strong enough. If they form too far apart, it may signal that the earlier downtrend has already lost its effect, making the pattern less dependable.
Also Read: Harmonic Patterns – A Complete Guide
Bottom Line
The Adam and Eve pattern teaches traders how patience and timing can turn uncertainty into opportunity. Whether it forms a double top or double bottom, its message remains the same, momentum is shifting. When read carefully, this chart pattern shows where market sentiment begins to change. Traders who wait for proper confirmation levels and manage risk with stop-loss orders gain the most from this setup. The balance between Adam’s sharpness and Eve’s smooth curve reminds us that every reversal begins with a story of exhaustion and recovery.
In trading, spotting the Adam and Eve formation is not just about finding shapes, it’s about understanding price behavior and emotion. Both the bullish and bearish versions of this pattern work best when traders stay disciplined and avoid chasing moves too early. By focusing on proper levels, volume, and breakout confirmation, one can capture strong setups with better accuracy.
Over time, learning to identify the Adam and Eve chart pattern correctly becomes a skill that transforms confusion into confidence and hesitation into precision.
FAQs
What Is The Adam And Eve Pattern?
Adam refers to the bottom as a narrow, pointy bottom with perhaps a drop in the downward direction of the day. Eve’s bottoms look rounder or flat.
Is Adam And Eve’s Pattern Bullish?
Twin bottoms at roughly the same price characterize Adam and Eve’s double bottoms, which are bullish chart patterns.
What Is A Triple Bottom Pattern?
The triple bottom reflects the visual pattern showing the prices of the sellers and the bears. Generally, three lowers can bounce off support, followed by price actions breaking resistance.
What Is A Rounding-Top Pattern?
A rounding top is the chart pattern used for technical analysis based on price movements. It forms an upside-down “U.” Rounding tops can be found after extended higher trends and can signify sluggish long-term pricing movement.