Harmonic price patterns leverage geometric price changes using Fibonacci numbers to predict turning points. This approach is unlike most other popular forex trading methods since it tries to predict future movements. This post will discuss two popular harmonic price patterns in the stock market.
Also Read: The 28 Forex Patterns Complete Guide
Contents
- Fibonacci and Geometric Patterns
- The Gartley Pattern
- The Butterfly Harmonic Trading
- The Bat Harmonic Pattern
- The Crab Patterns
- Stop Losses and Fine-Tune Entries
- How Harmonic Patterns Improve Trading
- Conclusion
- FAQs
Fibonacci and Geometric Price Patterns
Harmonic pricing combines math and price in a precise trading approach that bases on repetitive patterns. In simple terms, this methodology represents a primary ratio or its derivative. The direct proportion applies in almost all environmental and natural events & structures.
For that reason, most financial markets use the pattern since it repeats within the society and throughout nature that affects trading. Thus, it is somewhat effective in predicting future price fluctuations making it easier to enter or leave a position for profit.
Finding patterns of different magnitudes and lengths allows the investor to apply Fibonacci ratios to the stock market patterns when predicting future movements. Many traders have found or contributed to adequate levels and practices that can help to boost harmonic patterns' performance in the stock market.
For that reason, harmonic price patterns tend to be precise. They require the practice to showcase fluctuations in a specific magnitude for the prediction to calculate an accurate reversal point. An investor can detect a harmonic pattern, but the Fibonacci level might not align with it. Therefore, it renders that pattern unreliable for price prediction. Thus, the trader must wait for the price to hit an ideal fluctuation point.
The pattern can be effective at gauging how the current price moves will change. Hence, they can help to isolate the reversal points. Nevertheless, the trader will incur losses where they take a position at the reversal point, and the pattern does not work. For that reason, the trader can get trapped in a trade with rapidly extending reverse trends. Thus, it would be best to manage risk like in other trading approaches.
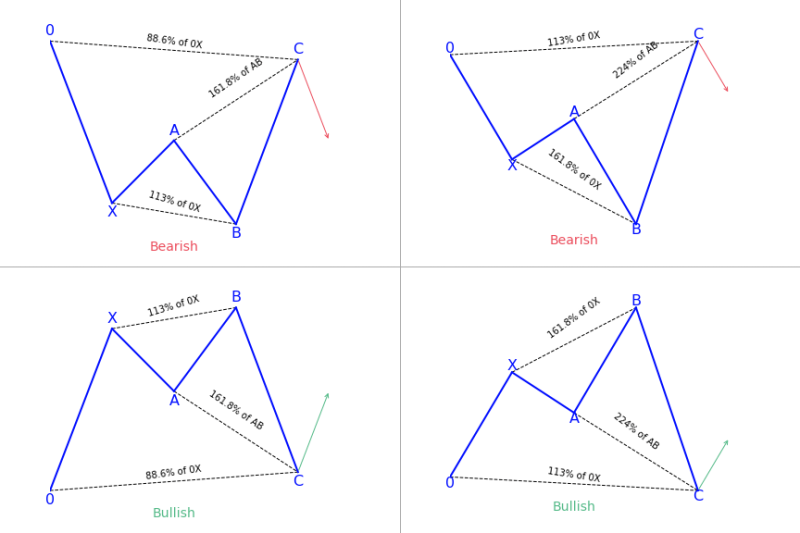
Source: https://i2.wp.com/patternswizard.com/wp-content/uploads/2020/06/shark.png?fit=864%2C576&ssl=1
It is crucial to note that some harmonic patterns can exist in other patterns. Besides, non-harmonic patterns are most likely to exist in other harmonic patterns' contexts. These two ideas are crucial for boosting harmonic pattern effectiveness. They are also crucial for enhancing exit and entry performance. In any case, one harmonic wave may feature several price waves, including AB wave and CD wave.
In general, prices gyrate constantly. For that reason, it would be best to focus on the bigger picture for the time frame that you trade. The stock market features a fractal nature that allows it to apply from the most petite time frames to the largest. The Fibonacci retracements chart platform provides traders with multiple plot methods to measure each wave.
The Gartley Pattern
HM Gartley published the approach, and Scott Carne added the Fibonacci levels later. This discussion will base on levels from what they published. It would be best to mention that the pattern has helped investors to set up a standard ratio. Here is what you should know.
The bullish pattern occurs at the beginning of a trend, showcasing that the corrective waves are winding up. It shows that an upward move is more likely to happen after point D. all the patterns may fall within a broader range or trend context, and traders should know it. The practice has a lot of information to absorb, but the chart is simple to interpret. Here is a bullish example.
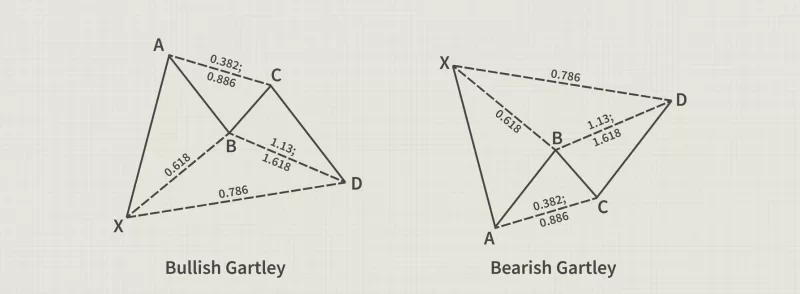
The price increases to point A corrects to point B, which is 0.618 wave A retracement. Hence, the price will increase through BC, where it converts a 0.382 to 0.886 AB retracement. The next move would be downwards via CD, where it extends from 1.13 to 1.618 at AB. Thus, point D represents a 0.786 XA retracement. Many investors look for instances where CD opens from 1.27 to 1.618 of AB.
The area around point D refers to the potential reversal zone. It represents an area where investors can enter long positions, although it would be best to wait for some time before entering a position. This trading approach will reap better results if you research further to make better calculations.
The Butterfly Harmonic Trading
The difference between the Gartley pattern and the butterfly pattern is that it features point D that extends beyond point X. This post will base on the following bearish example to help you understand the numbers. The chart below shows that the price is dropping from point A. The upwards wave from A to B represents a 0.786 XA retracement. On the other hand, BC defines a 0.382 to 0.886 AB retracement.
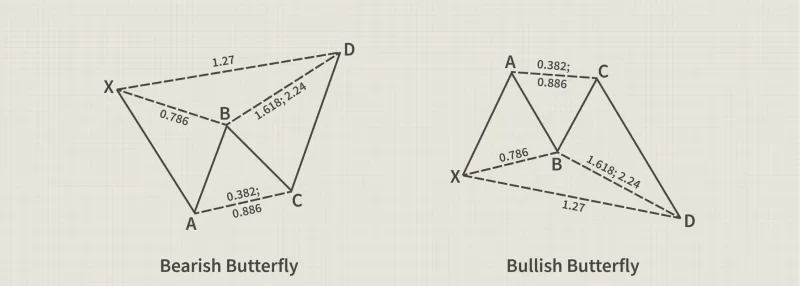
CD describes a 1.618 to 2.24 AB extension. Besides, D shows a 1.27 XA wave extension. In simple terms, the point D area is suitable for short trades, but waiting for some time before entering a position would be the best idea. Some forex trade brokers look for a matching ratio between these numbers. For instance, if CD is a 1.618 to 2.24 AB extension, some brokers will pick any number between these values.
The Bat Harmonic Pattern
The bat pattern can be the same as Gartley in looks but does not match in measurement. Here is an excellent bullish example. A rise occurs via XA. B that retraces 0.382 to about 0.5 of XA. On the other hand, BC retraces averagely 0.382 to around 0.886 of AB. Hence, CD represents a 1.618 to about 2.618 extensions of AB. Finally, D retraces at 0.886 of XA.
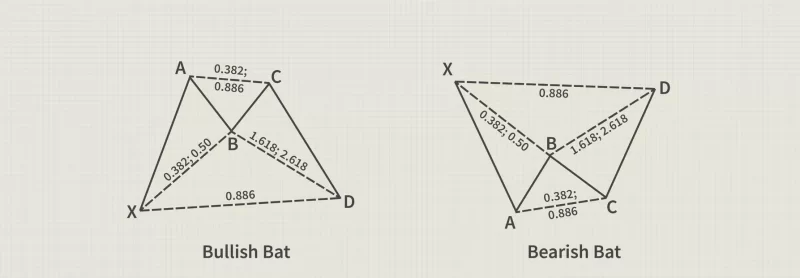
In general, D represents the area where the trader might wait for long or look at the patterns before the prices rise. The bat users can also place a stop loss not far below it. You can check for near short D for the bearish pattern with a stop loss not far above.
The Crab Patterns
Most investors consider the crab pattern as one of the most reliable and precise patterns. It provides reversals in tremendous proximity, as the Fibonacci numbers indicate. It is somewhat similar to the butterfly pattern, but it varies in measurement.
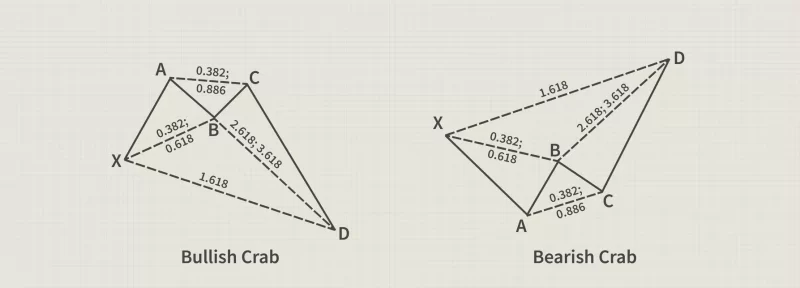
Explanation in the bullish pattern showcase that point B shall pull back to 0.618 of XA from 0.382. Yet, the CD can extend to 3.618 from 2.618 of AB. On the other hand, point D represents a 1.618 extension of XA. Traders ought to take longs around D and expect a stop loss not far below it. They must enter a short around D for the bearish pattern with a stop loss not far above it.
Stop Losses and Fine-Tune Entries
Each pattern provides a PRZ (potential reversal zone) and not the exact price. This statement explains that two different projects form point D. Whenever all expected levels fall within proximity, the investor can enter the market and profit. Whenever the projection zone spreads out, it would be best to check out other options before placing a position. Combining this knowledge with an indicator can reap better results. Most importantly, you can place a stop loss outside the furthest projection. This approach implies that the stop loss is more unlikely to attain the predictions unless the patterns provide validation.
Also read: ABCD Pattern Trading: Complete Guide
How Harmonic Patterns Improve Trading
Depending on the pattern type, harmonic patterns can provide a hint for the following:
Continuation Patterns: It helps to predict when the price will move in the same direction.
Reversal Patterns: It helps to predict when the price will reverse or move in the opposite direction.
Besides, it can provide a clear indicator if the price is a bearish pattern or a bullish pattern for a more precise price prediction. It would be best to research further about all the harmonic patterns to understand them better.
Scott Carney learned that harmonic patterns in the various financial markets follow a pattern of succession of down and up price moves. They feature three to five legs that represent trading points. The legs follow strict mathematical ratios. Most harmonic patterns use the Fibonacci levels as the primary retracement levels. These retracements and extensions create a potential reversal zone, with each pattern taking notions into its concepts.
In any case, it would be best to research further about the market trends before investing in a harmonic scanner. Besides, research is crucial for overall success in stock trading, and it would be best not to rely on automatic options. Check out more information about any scanner before you invest using its tricks.
Conclusion
The bottom line is that harmonic trading refers to a mathematical and precise forex trading approach that requires a mastery of the patterns, practice, and patience. The beginning of the trend showcases the most basic measurements. Where the movement does not align with the pattern measurements, it can result in a loss. Most traders opt for crab, bat, butterfly, and Gartley Harmonic trading options.
FAQs
1. What is a Harmonic Scanner?
Harmonic patterns are approaches to detect chart patterns and candlestick patterns that are necessarily indicative of trading signals in the stock market. Not all patterns may get considered when detecting patterns in futures and options markets and their substantial risk. Harmonic scanners provide a reliable way to predict the trading system, bad patterns, and past performance results.
2. How Much is the Harmonic Scanner Worth?
Harmonic scanners often offer a free trial to test the result you will get from the trading strategy. It is suitable for spot currency trading, and the chances of giving a positive impact are about 90 percent. Several scanners are available on the market, but it would be best to choose the best and most reliable scanner. Most platforms offer the scanner for about $20 per month.
3. Does Harmonic Trading Really Work?
Harmonic trading is more suitable for newbie and day traders looking to close quick deals and get profit. However, these tools might not be apt for long-term traders looking to generate a large net profit. The scanners might work at times and can also give poor results at times. Therefore, it would be best to research before you take any position in the stock market.
4. Which Harmonic Pattern is the Best?
In general, several companies venture into providing AI tools for stock trading. Yet, it would be best to always check on the security options and cost before you use any device. Checking on customer experience reviews will give you a clear indicator of the tools' quality. Most importantly, you ought to choose a cost-effective tool and enables you to generate profit from your investments. Above all, select a device that features high-security encryptions to safeguard your account.
5. Do Harmonic Patterns Have to be Exact?
A harmonic price pattern must be precise to show movements in a specific magnitude for the unfolding pattern to offer an accurate reversal point. It must be precise for the trader to enter or leave the market and make a profit.