
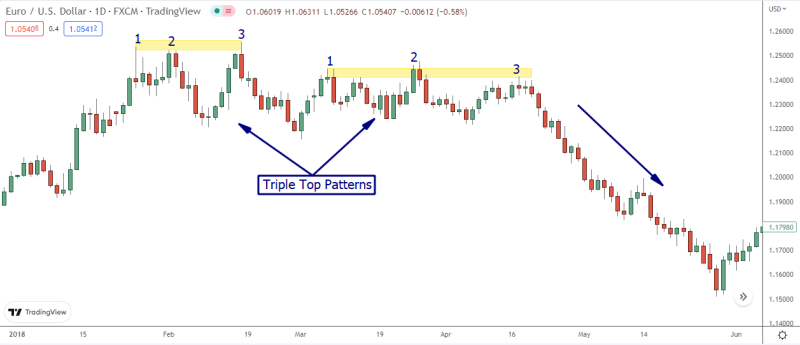
The Triple Top Pattern is a common chart pattern in technical analysis. It occurs when a stock or index makes three nearly equal highs, followed by a reversal in trend. This pattern is sometimes called a Triple Peak or Three Peaks Pattern.
The pattern begins with a stock or index making three consecutive highs, which can be at different levels, but generally should be within a few points of each other. After the third high, the stock or index will usually begin to decline.
Furthermore, the decline should be significant enough to break the previous resistance level of the three highs. This signals that the pattern is in effect and that the stock or index is likely to decline.
The Triple Top Pattern is a reliable indication that the stock trend or index is reversing. It can be used to identify potential sell opportunities and determine when to buy back into the market. The pattern is also helpful in gauging the strength of the reversal.
Also Read: What is Strategy Tester?
Contents
- What Is A Triple Top Chart Pattern?
- How Do Triple Top Chart Patterns Work
- The Triple Top Bearish Reversal Chart Pattern
- The Difference Between Triple Top and Triple Bottom Patterns
- Limitations Of the Triple Top and Triple Bottom Patterns
- Bottom Line
- FAQs
What Is A Triple Top Chart Pattern?
The triple top is a chart pattern used for technical analysis to indicate the reversal of an asset’s price movement. A triple top, which consists of three peaks, suggests that the asset might no longer be rallying and that lower prices might be coming.
Triple tops can appear on all-time scales, but they must follow an upswing to be recognized as such. A triple bottom denotes that the asset’s price is no more decreasing and may rise, which is the reverse of a triple top.
How Do Triple Top Chart Patterns Work
When the price of an asset forms three peaks at about the same price level, this pattern is known as a triple top. Resistance is present in the peak region.
The swing lows refer to the declines that occur between peaks. If the price declines below the swing lows after the third peak, the pattern is deemed complete, and traders look for a further decline.
The triple top visually resembles the head and shoulders pattern since it has three contiguous peaks. However, in this instance, the middle peak is roughly equal to the other peaks rather than higher.
When the price reaches the resistance line twice, establishing a pair of high peaks before falling, the pattern is comparable to the double-top pattern.
The Triple Top Bearish Reversal Chart Pattern
A bearish reversal chart pattern known as the Triple Top Reversal is frequently seen on bar charts, line charts, and candlestick charts. Three equal highs are made, and then there is a break below support. These patterns, which are large reversal patterns, typically take three to six months to mature.

- Bearish: Being bearish in trading indicates that you expect a market, asset, or financial instrument will fall in value.
- Candlestick Pattern Occurs: A candlestick pattern is a price action illustrated graphically on candlestick charts. Speculators forecast a particular market movement through technical analysis. Algorithms used for graphing must rely on specified criteria to match the pattern because pattern recognition is subjective.
- Uptrend: An uptrend depicts a financial asset’s price movement when the overall tendency is higher. In an upward trend, each peak and trough that follows is higher than those discovered earlier.
It is regarded as a bearish reversal pattern since it denotes a switch from an asset’s price rising to a fall. The triple bottom pattern, which indicates the reverse — a falling price reversing and moving up, the start of a bullish trend following a downtrend — is the counterpart to the triple top pattern.
The Difference Between Triple Top and Triple Bottom Patterns
Triple tops and bottoms are variations of double tops and bottoms. The triple tops and bottoms, which have three rises (in a triple top) or three pushes down (in a triple bottom), resemble the cursive “M” or “W” if the double tops and bottoms do (for a triple bottom). These price patterns show unsuccessful attempts to break through a support or resistance level.

When the price tries three times to break above a known resistance area, it fails and moves backward. This is known as a triple top. In contrast, a triple bottom happens when a price makes three attempts to break through a support level but fails and bounces back up.
Triple Top Setups
A triple-top formation is a negative pattern because it disrupts an upward trend and causes a downward trend to emerge. It was created as follows:
- Prices rise steadily until they eventually encounter a point of resistance and retrace their steps to a level of support.
- Price tries to test the resistance levels again but is unsuccessful and moves back toward the support level.
- Price makes another futile attempt to overcome the obstacle before falling back and breaking through the support level.
In this price action, buyers and sellers are battling it out to drive prices higher while attempting to lower prices. Each resistance test is often accompanied by falling volume until the price breaks through the support level with rising participation and the corresponding volume.

The buyers typically give up after three failed tries to break through a level of established resistance, the sellers gain control, and the price drops, signaling a change in trend.
Triple Bottom Setups
Triple bottoms, in contrast, hand, are bullish since they break a downward trend and trigger an upward trend change. Three unsuccessful tries to push the price through a support level define the triple bottom price pattern.
Typically, as the price makes its final attempt to go lower, it fails and returns to break through a resistance level, and the volume will decline. This pattern, like triple tops, shows a conflict between sellers and buyers.
A triple top or bottom indicates that one trend is waning and the other is strengthening. A triple top signifies a change in pressure from buyers to sellers, while a triple bottom shows a change in pressure from sellers to buyers. These patterns illustrate the so-called “changing of the guard” that occurs when power is transferred.
Also Read: How To Read Candlesticks Like A Pro
Limitations Of the Triple Top and Triple Bottom Patterns
Although neither a proven triple top nor triple bottom pattern can be entirely exact, they can be dependable.

Impatience is a problem that novice traders may encounter. When they observe three failures at the same level, beginners may adjust their posture. The decision’s drawback is that the pattern hasn’t been verified. Prematurely taking the position puts the account at risk of a failed pattern and a losing transaction.
In addition, volume often follows a trend’s direction. A breakout could be unsuccessful if it is taking place on insufficient volume. On the other hand, a breakout that occurs on the rise in volume is advantageous to the break and signals that the target may be reached.
Lastly, compared to big cryptos like Bitcoin and Ether, lesser cryptocurrencies have far less liquidity. Because of their tokens’ size, smaller cryptocurrencies have a higher likelihood of not experiencing breakouts.
Due to these limitations, a trader must implement a stop loss on every trade to ensure the account isn’t destroyed should the market move against them.
Bottom Line
If you trade stocks, you are likely aware of the significance of a triple-top pattern. Even though this dangerous trade is rarely discussed by traders, it can pay off handsomely if the setup is correctly identified before the breakout.
Triple Top Patterns are an important indicator that the market is poised to change direction. If a triple-top pattern develops at the peak of an upward trend, it is a positive indicator. It demonstrates that the stock peaked before starting to drop once more.
FAQs
Is a Triple Top Bullish?
Triple Tops are based on bearish reverse chart patterns, resulting in trend changes to the downside. While triple bottom bears, the bullish chart reverses, which leads to trends changing towards an upside direction.
Is a Triple Top Bearish?
Triple top formations are bearish since they interrupt an uptrend and cause trend changes towards the bottom. It is formed as follows: Prices rise, eventually reach resistance, and then return to support zones.
How Reliable is a Triple Top?
Three-point charts are reliable indicators for telling the trader what’s selling. It means traders that after trying to push prices up, there’s evidence that the asset is no longer rallying.


Play word games for free at waffle game. You will have comfortable moments with friends and family. Moments of relief after tiring work
I’d like to say that I haven’t read anything so interesting in a long time age of war