Ascending Triangle
The ascending triangle pattern is a Bullish chart pattern in technical analysis. Technical analysts scan for chart patterns to make trading decisions based on them. The ascending triangle chart pattern is a tradeable pattern that means, the pattern provides the best Entry point, Take profit point and Stop Loss points. So, forex traders can apply the pattern with ease and trade the pattern confidently without confusion and avoid trader’s ambiguity.
The simplicity of the pattern and the underlying market information it provides to the trader is valuable. The pattern can be automatically scanned using software and the pattern can be traded using them because the pattern provides rules that are mathematical. The pattern may form in any chart time frame and can be traded in all intraday time frames and the daily, weekly, and monthly charts. The pattern can be traded easily by new forex traders to identify the best entry points. However, advanced forex traders can incorporate the pattern in complex trading strategies. There are many technical trading strategies that can use and apply this strategy successfully.
Also Read: The 28 Forex Patterns Complete Guide
Content
- What Is An Ascending Triangle?
- How To Identify The Ascending Triangle?
- How To Trade The Ascending Triangle?
- Trade Examples
- Additional Confirmation Using Indicators
- Conclusion
What Is An Ascending Triangle?
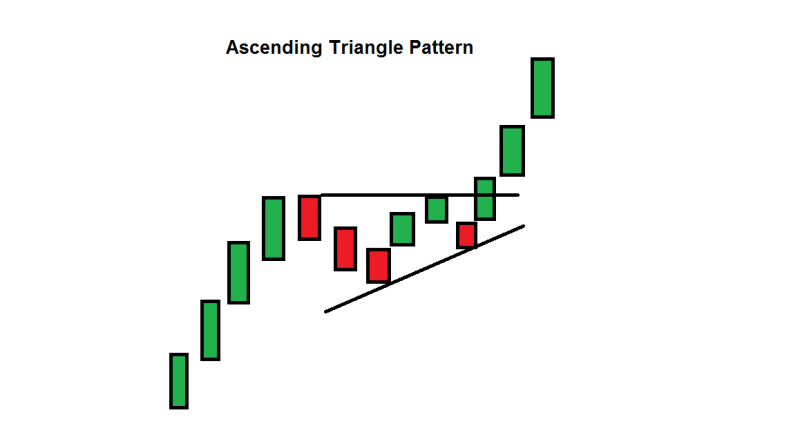
An ascending triangle chart pattern is formed during the upward price movement in an uptrend. The price tends to consolidate for a while and allows the trader to draw a horizontal trend line on the upside. Simultaneously, it allows the trader to draw a rising trend line downwards. The pattern implies that the price is consolidating and existing buyers are closing partial positions and the market is expecting new buyers to join and continue the Bullish trend.
As a result, the price consolidates on the upper trend line and is unable to move higher and make new higher highs. However, the price does not make lower lows either, instead makes higher lows. So technical analysts look for trading opportunities and enter the market once the pattern is spotted on a price chart.
How To Identify The Ascending Triangle?
The ascending triangle pattern is similar to the other triangle patterns, but the location and shape of the triangle formation is very important. The shape of the ascending triangle should strictly contain the upper horizontal trend line and the lower rising trend line, failing this will invalidate the pattern. The pattern must be located within the uptrend, so it can be validated as a trend continuation pattern.
The ascending triangle can be spotted easily by its shape. The horizontal upper trend line and the rising lower trend line make it easy to spot the triangle. An ascending triangle forms during a bullish uptrend as the pattern is a continuation pattern. However, the pattern may form in any part of the chart and trend. The ascending triangle pattern formed during a uptrend is significant and produces the best trading results. So traders should look for the pattern while prices are in an uptrend and identify it using the triangle shape.
Features that help to identify The Ascending Triangle:
- There should be an existing uptrend in the price.
- The upper trend line should be horizontal.
- The lower trend line must be a rising trend line.
- The trend lines should be touched at least twice. The greater number of times the trend line is touched, the stronger it gets.
Also Watch: Triangle Patterns
How To Trade The Ascending Triangle?
As mentioned earlier, the pattern not only provides the best entry point but provides the stop loss and takes profit too. Moreover, these points can be clearly defined and understood by the trader.
Entry point: During the market consolidation phase, the upper trend line acts as a resistance and the lower trend line acts as a support. As the market consolidation ends and the price starts to get momentum, it breaks the upper trend line. The best entry point is the breakout of the upper trend line or the resistance.
Price breakouts are normally associated with spikes in the trading volume. The increased trading volume implies the entry of fresh buying orders. Traders should look for trading volume levels during the breakout and confirm the breakout before entering the market with a BUY position.
The next confirmation is the classic price action which shows that the resistance has changed into support. Normally, price once breaks the upper trend line tries to move lower but will have ample support from the upper trend line which now starts to act support. This price action confirms the buying interest and gives the trader with additional confirmation and confidence.
Stop Loss: The best stop loss method is to exit the trade if the price breaks the support or the lower rising trend line. The breakout of the lower trend line implies the non-availability of the upside momentum and indicates the possibility of the return of the bears.
Take Profit: The projected take profit target is the farthest distance between the upper and lower trend lines. At the beginning of the pattern, the upper and lower trend line will be wider from each other. This distance can be measured and can be projected from the entry point to the upside. As per the pattern, this is the best take profit target.
Trade Examples
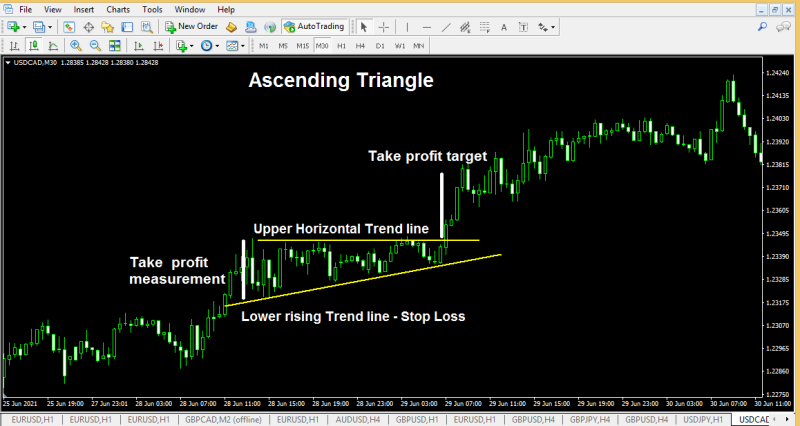
The above USDCAD M30 chart shows the ascending triangle pattern with its components in action. The price was in an uptrend and entered a consolidation phase and allowed the formation of a horizontal trend line, that acted as a resistance. Simultaneously, the price formed a rising trend line due to higher lows. Traders can notice that the price was unable to make lower lows during the consolidation period and the lower trend line acted as the support.
The price was initially in an uptrend and formed the consolidation phase then broke the upper trend line and started to move further. The stop loss is the lower rising trend line. Moreover, the widest area of the pattern is measured for the take profit and projected from the entry point. Thereby this pattern provided all the necessary parameters to trade successfully.
Additional Confirmation Using Indicators
Any and every technical pattern can be invalidated and may create one or multiple false entries. To avoid false entries traders can apply other technical indicators to validate the entry points. It serves the best interest of the trader and the trading strategy to get additional confirmation.
The additional confirmation can be obtained by applying any other support and resistance breakout trading indicators. The increased volume during the price breakout suggests the market intention. If there is a price breakout without increased trading volumes, traders should refrain from entering a BUY position. And wait for price for a renewed breakout with increased trading volumes.
Generally, convergence and divergence are used by traders to understand the price action behind the scenes. So any oscillator indicator can be used to find out any prevailing convergence and divergence. The presence of the divergence or convergence should be able to assist the trader to identify and false breakouts.
The next important tool in the price action, the price action speaks a lot. Particularly, after the breakout, the upper trend line which acted as resistance during the pattern should become support and may provide candlestick patterns as a clue. These additional confirmation techniques will assist the trader to avoid false breakouts.
Conclusion
The ascending triangle pattern is a bullish continuation chart pattern, which forms during a bullish trend. The pattern provides clear indications to enter, take profit and stop loss. Moreover, the indicator can be easily spotted by its triangle shape. The pattern is formed during a downtrend should be ignored by traders. There are instances where the pattern forms at the end of the trend, advanced forex traders tend to trade them, however, it is recommended to ignore. For best trading results, forex traders should trade them in an uptrend as a continuation pattern. These make the pattern more reliable and help the trader to trade with confidence. However, it is recommended to use additional confirmation using other candlestick patterns or indicators. Like any other technical chart pattern traders are advised to practice the pattern in forex demo trading accounts before applying in LIVE trading conditions and gain enough insight about the parameters of the pattern.