The Symmetrical triangle is a continuation chart pattern that belongs to the family of Triangles. Forex traders can identify this candlestick chart pattern easily due to its shape and trade them successfully using the pattern rules. Moreover, this candle chart pattern occurs frequently Pattern trading is an essential part of technical analysis. This pattern is a continuation pattern and provides the Bullish or Bearish market outlook based on the location of the pattern during a trend.
The Symmetrical Triangle is formed due to the price consolidation during an existing price trend. The buyers who entered during the initial phase of the trend tend to book partial profits or exit completely. The fresh buying opportunity provided by the triangle breakout attracts more investment and pushes the price further higher. During the consolidation phase, the price undergoes a series of higher lows and lower highs. The resulting formation takes the shape of an easily identifiable symmetrical triangle chart pattern.
The symmetrical triangle chart pattern forms in all intraday chart patterns and short and long-term chart patterns including the daily, weekly, and monthly charts. So forex traders at all levels can trade the pattern successfully.
Content
- How To Identify A Symmetrical Triangle
- Trend lines Or Triangle Shape
- Breakout Location
- Types Of Symmetrical Triangles
- How To Trade The Symmetrical Triangle
- Example Of Symmetrical Triangle
- Conclusion
How To Identify A Symmetrical Triangle
The shape of the symmetrical triangle candlestick chart pattern is implied in the name of the pattern itself. The pattern can be identified through the following components:
Trend
The symmetrical triangle chart pattern is a continuation pattern, whether it is a Bullish Symmetrical triangle or a Bearish Symmetrical triangle candle pattern depends on the existing previous trend. If the pattern appears during an uptrend, then the forex traders look for a Bullish breakout towards the upward direction for the best BUY entry. Similarly, the occurrence of the pattern during the downtrend prompts the forex trader to look for a SELL entry point if there is a bearish price breakout.
So, to effectively identify the type of symmetrical triangle and to anticipate the direction of the breakout and trade it profitably the forex trader should take the existing price trend into consideration. This hence supports the idea that the price consolidation is preparing the market for the continuation of the rally after consolidation.
Trend lines Or Triangle Shape
The shape of the triangle is formed due to the upper trend line and the lower trend lines converging to form a triangle. Both trend lines should be sloping equally to converge, as the name suggests the slope should be symmetrical. If the lines are not equally sloping they form other types of triangles and wedges like ascending triangle, descending triangle, falling wedges, rising wedges. So the distinctive shape is very important to identify the symmetrical triangle chart pattern.
The construction of the upper trend line and the lower trend line is formed by connecting the highs and lows during the consolidation period. The upper trend line should be at least touched twice by the higher lows. Similarly, price should have reacted at least twice to the lower trend line by the higher lows. These rules validate the requirements of s valid trend line.
Also Read: Trendline Trading
Breakout Location
The breakout location of the triangle is very important as it helps the forex traders to validate the breakout. Traders should look to enter only after the pattern matures and the new funds are ready to enter the market. The price breakout should happen after 75% of the pattern is complete, any breakout before that is premature and should be invalidated. However, if the price breaks out too close to the end of the triangle it also should be invalidated as the price has to break the triangle anyway at the end of the triangle. This may not have formed due to buying or selling pressure, rather due to a casual market movement.
Types Of Symmetrical Triangles
Symmetrical triangles can be classified as Bullish symmetrical triangles and Bearish symmetrical triangles based on the context of the pattern.
Bullish Symmetrical Triangle
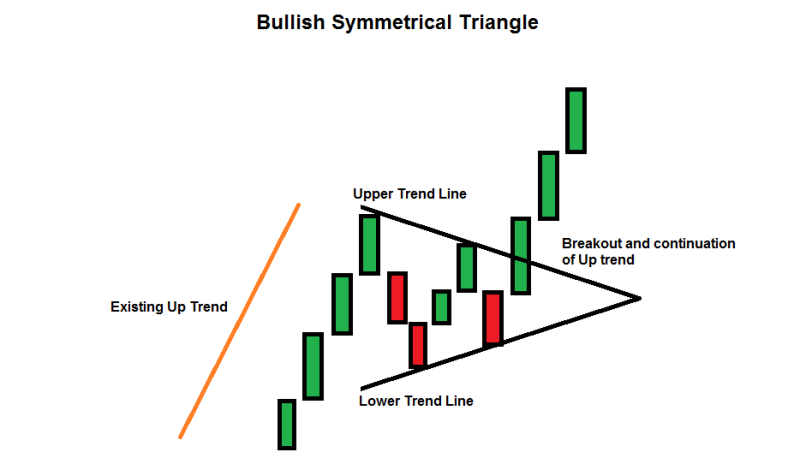
The above image shows the Bullish symmetrical triangle. The existing uptrend indicates that the market is expected to move higher after the consolidation period so the trader should look for a BUY entry position. Both trend lines have a similar slope angle and converge at the end. Price reacted at least twice to the upper trend line and lower trend line. Once the breakout happened the price continued in the direction of the initial trend.
Bearish Symmetrical Triangle
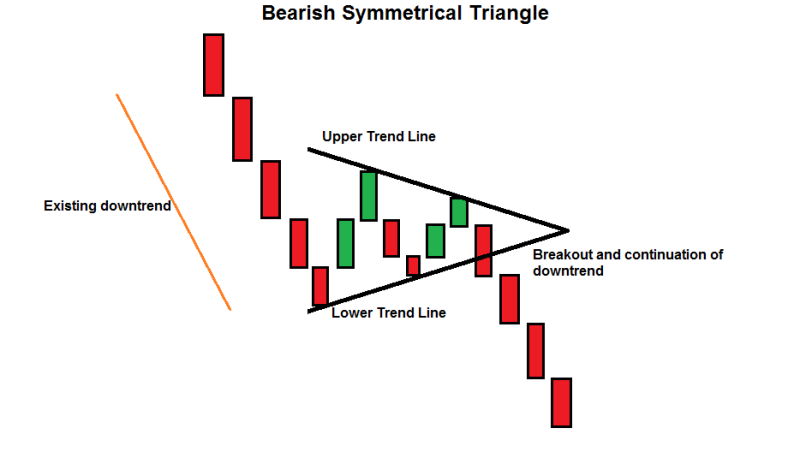
The above image shows the bearish symmetrical triangle pattern. The consolidation and the pattern happened during a downtrend. Price reacted to the upper and lower trend lines twice, the slope of the upper and lower trend line is almost equal. Price continued in the initial trend direction after the breakout.
How To Trade The Symmetrical Triangle
Once a breakout is confirmed, trading the pattern is quite easy. The pattern can be traded using the following guidelines:
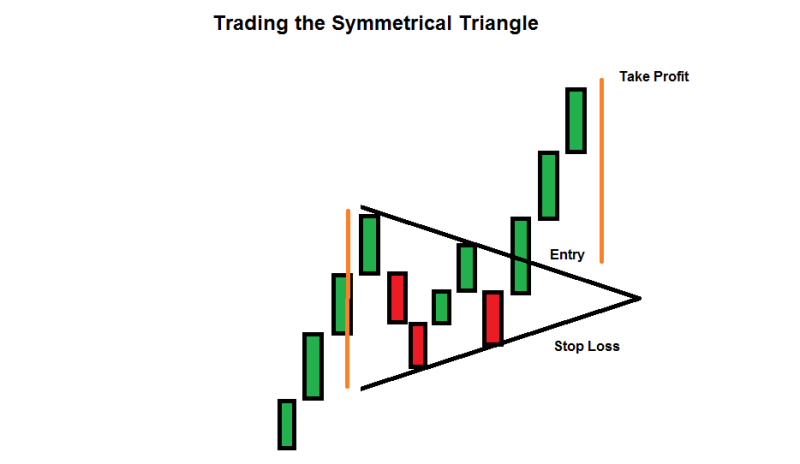
Entry
Upon breakout confirmation, the entry is towards the direction of the initial trend. There is a possibility of price breakout in another direction; in such a case, traders should avoid entering the market. The breakout confirmation is essential for a rewarding trade. So traders should use additional confirmation of the triangle breakout using trend line break out rules. Furthermore, traders can use technical indicators for confirmation. Increased trading volumes are generally associated with a breakout so traders can use technical analysis to further confirm the breakout.
Stop Loss
The best stop loss is above or below the opposite trend line based on the direction of the breakout. It is obvious that the trend will be invalidated if the price breaks the other trend line too, effectively breaking both the trend lines. Thus it may not make any sense to hold on to the trade any longer.
Take Profit
The best take profit is equal to the longest distance between the upper and lower trend lines. At the beginning of the pattern, the distance between the trend lines is the maximum, this distance is measured and projected from the entry point to obtain the potential take profit. However, advanced forex traders can use additional trend-following rules to ride the trend.
Also Read: Benefits of Forex Trading
Example Of Symmetrical Triangle
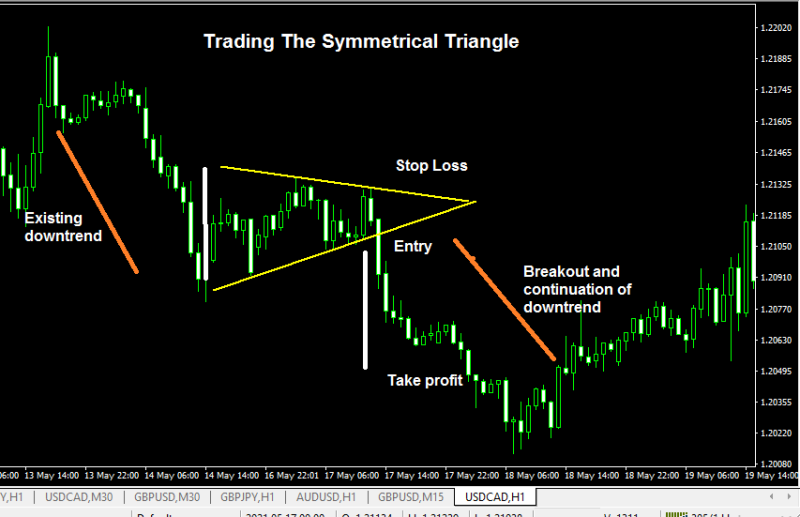
The above image shows a Bearish Symmetrical Triangle candlestick pattern in the USDCAD H1 price chart. The price was in an existing bearish trend, and the price started to consolidate allowing drawing the trend lines. The upper trend line was formed as price reacted and made lower highs and the lower trend line was formed due to price making higher lows. The trend lines sloped almost equally and converged at the end to form a symmetrical triangle.
The breakout happened towards the lower side confirming the breakout direction towards the initial trend direction. The best stop loss location is above the upper trend line. The distance between the trend lines is measured at the beginning of the pattern and is projected from the entry point.
Conclusion
The Symmetrical triangle candlestick chart pattern is a reliable pattern that occurs in almost as financial charts. It occurs frequently and can be identified and traded easily due to its triangular shape. So it can be traded by new and advanced forex traders, as the pattern can be measured mathematically traders can use automatic software to scan the charts and spot the pattern easily. The breakout confirmation of the pattern is of paramount importance. So traders should use additional indicators and technical analysis to confirm the same. The stop loss and take profit can be easily identified and measured so technical traders can trade the pattern independently. However, for best results traders should use additional technical indicators and price action to confirm the same. It is obvious that understanding and practicing to trade such a reliable chart pattern will enhance the trading experience and provide the best results.
Also Read: Forex Trading Strategies