
Contents
- How to Use the Aroon Indicator?
- Aroon Up and Aroon Down are the Key Parameters
- Aroon Indicator Formula
- Applying the Aroon Oscillator
- Interpreting the Oscillator
- Aroon Indicator vs Directional Movement Index (DMI)
- Pros and Cons as a Technical Indicators
- Conclusion
- FAQs
How to Use the Aroon Indicator?
Developed by Tushar Chande back in the 90’ of the previous century, the Aroon technical indicator is used to recognize changes in the market trend. More specifically in the price of an asset, but also the potential of the trend.
The Aroon indicator estimates the period between high and lows. The concept is that a powerful uptrend will display a new high, and a strong downtrend will reveal new lows.

Day trading strategies are often based on the Aroon indicator because of its capacity for fast profits in the markets. It is one of the rare technical indicators that can help traders identify trend and have continued success with their trading strategy.
Every experienced day trader has noticed that the price of an asset usually gravitates in a range, where the price moves impulsively. In trading hours, the price moves up or down for a small percentage of the time.
Also read: ATR Indicator
Aroon Up and Aroon Down are the Key Parameters
The Aroon indicator formula was created to predict when the price action of an asset is transitioning from a range-bound state to a trending state, that way creating a long or short position. It can also show if the price action of a security is going to stop trending and start consolidating.
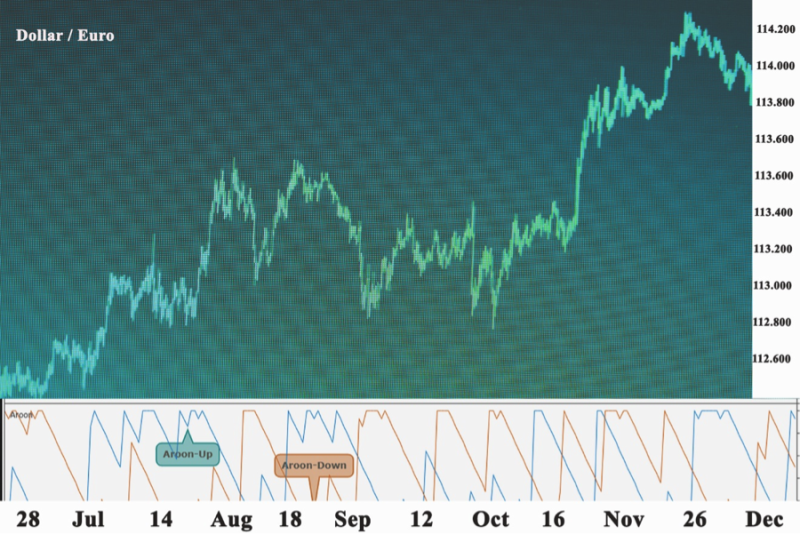
Visually the Aroon indicator is displayed on daily charts, as an up line that estimates the uptrend. And a down line does the opposite.
The indicator is usually based on 25 periods, it is expressed in terms of 0 to 100. Practically when the Aroon-Up indicator is over 50 prices it has made a new high in the past 12.5 periods.
The same applies to the Aroon-Down indicator. When it is over 50 it means a new low was posted within the last 12.5 periods. Reading close to 100 indicates a powerful trend.
Aroon Indicator Formula
The Aroon Up or Down regulates the extend of time since the last high or low for the ongoing period. The Up or Down values are communicated in percentages and range from 0 to 100.
The nearer the line is to 100%, the more powerful the trend is. An Aroon Up close to 90% is showing a strong uptrend. Interestingly this can be also done with a low Aroon Down Line to give us trust in the trend. Seeing Aroon Down close to 100% indicates that low happened not long ago.
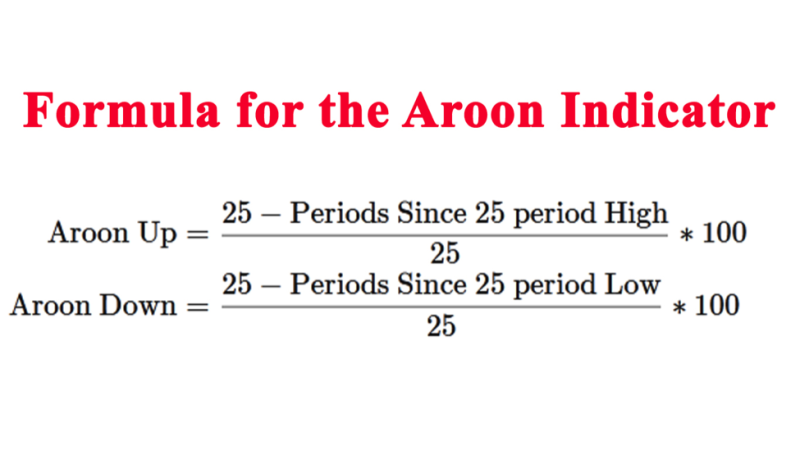
If you want to calculate the present Aroon Up value, you need to determine the point in time when the price was highest in the last 20 days. If that was two days ago, then we can use the following equation to find the Aroon Up:
Aroon Up = (20 – 2) * 100/20 = 90
If earlier the high were 15 days, the value would be 25. The closer the 20-day high is to now, the value of Aroon Up will be greater. This can be understood as an uptrend if there is also a low Aroon Down value to authenticate it.
Applying the Aroon Oscillator
Brokers can use the Aroon technical indicator for:
- Recognizing new trends.
- Anticipate market reversals.
- Measuring the strength of the trends.
- Identifying consolidations.
The basic interpretation of the Aroon readings:
- Reading near the 100 level signals a strong bullish/bearish trend.
- Reading near to the 0 level signals a weak bullish/bearish trend.
Interpreting the Oscillator
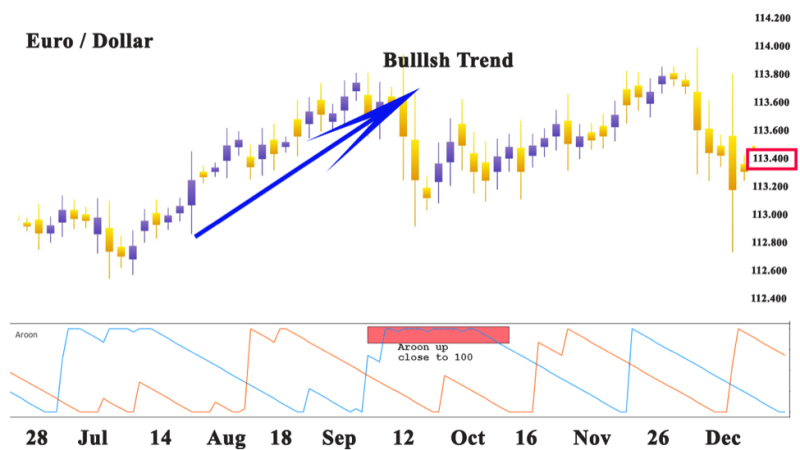
Three levels are crucial in explaining the Aroon indicators. The readings are 0, 50, and 100. The basic interpretation is that the market is bullish if Aroon-Up is over 50 and Aroon-Down is under 50.
This setup indicates new daily highs are more likely than new daily lows. The opposite is true for a downtrend.
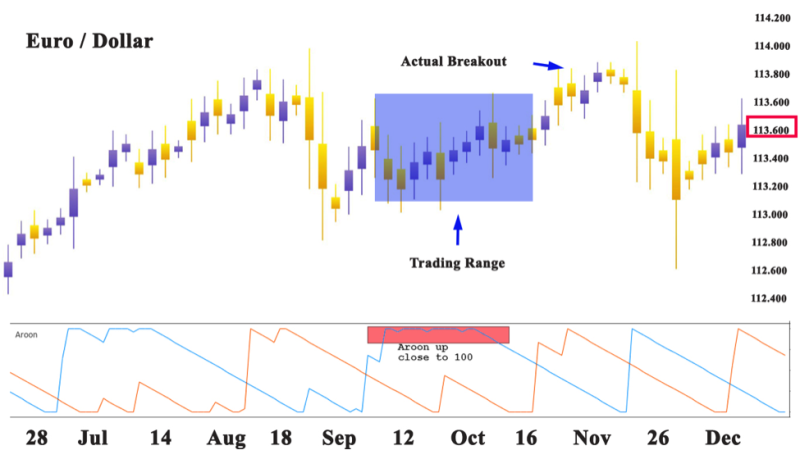
Recognizing Consolidation
Two signs indicate consolidation is emerging. The first is when both the Aroon-Up and the Aroon-Down are under 50. The next if both Aroon-Up and Aroon-Down are parallelly going lower. When both readings are under 50 it signals consolidation.
Reading under 50 for both indicators signals no new highs or lows have been spotted over 13 days When the lines together move in parallel, it signals a trading range has formed.
Indicating a New Trend
A new trend occurs in three phases. The first signal is when the Aroon-Up goes above the Aroon-Down. These signals that new highs are more frequent than new lows.
The following sign is when the Aroon-Up goes over 50 and the Aroon-Down under 50. The final sign is when the Aroon-Up comes to 100, while the Aroon-Down stays under 30.
Limitations of the Aroon Indicator
The downside of the indicator is that during turbulent market action the indicator provides weak trading signals. Sometimes it shows a valid signal, but too late to be implemented in the trade market. The Aroon indicator is accurate when combined with other technical indicators.
Aroon Indicator vs Directional Movement Index (DMI)
At face value, the Aroon indicator is indistinguishable from the Directional Movement Index (DMI) Wilder. Both use up and down lines to reveal the direction of a trend. The difference is that the Aroon indicator formulas are focused on the amount of time between highs and lows.
The DMI measures the price difference between current highs/lows and prior highs/lows. The crucial factor in the DMI is the price, not time.
Also read: Average Directional Movement Index
Pros and Cons as a Technical Indicators
Advantages:
- Indicates changes in trends. Line crossovers can indicate a rise or loss in momentum to the traders.
- Easy to understand. Interpreting the lines is easy and does not require sophisticated mathematical formulations.
- Flexibility in choosing the interval. Traders can alter the length of the period for measuring the Aroon Lines based on how frequently they trade.
Disadvantages:
- Lagging indicator. The Aroon lines are based on historical prices. They form slower compared to the underlying trend.
- Should be used in combination with other indicators. Used alone the signals created are not precise, and it is preferred to use them in tandem with other indicators.
- Influenced more by time than price movements. It depends only on how long ago the last high/low was observed, the indicator does not provide information on the immensity of change that can happen.
Conclusion
The Aroon indicator is easy to learn and utilize in technical analysis, even for beginners that are just starting to trade. To understand the trade signals and data correctly it is advisable to test your strategies using the indicator.
It is an unusual indicator that allows you to see the strength of a trend and use that insight to exploit the trend until a buy or sell climax is reached.
You get a momentum oscillator that can easily be a top 3 technical indicators in your trading toolbox. The Aroon is a successful tool for locating changes in the trend direction and the power of the trend.
A solid trading platform will offer the Aroon oscillator formula to monitor the existing trend and high and low prices. Aroon indicator strategies can validate the strong trend when the Aroon crossover happens. It can reveal a weak trend and price consolidation by anticipating a bull market and a bear market.
FAQs
What Does Aroon Indicator Mean?
The Aroon Indicator is a technical momentum oscillator that enables traders to recognize if a security is trending, the direction the power of the trend. Because it focuses on the price relative to the time, it can also be used to spot emerging trends and reversals.
The concept behind the indicator is that when trends price tends to make new highs or lows regularly, and by tracking that we can determine the strength of a trend, and when trends are beginning or ending.
Is Aroon Indicator Accurate?
Traders use it to follow stock price trends. It is a reliable and accurate indicator.
What Is Aroon Oscillator Indicator?
Aroon Oscillator is perceived as an extension of the Aroon Indicator and estimates the strength of a trend. It verifies the possibility the trends that are building up in the Aroon Lines can be used to interpret if a valid trend is emerging. The Oscillator is the difference between Aroon Up and Aroon Down.
How do You Trade with Aroon Indicator?
There are two lines in the indicator the Aroon Up, and Aroon Down. The Up-line signals bullish strength and momentum, and the Down line is for bearish strength and momentum. The lines are plotted on a histogram with a range of 0 to 100, with 100 the strongest indication of trend.
Traders use the indicator to observe crossovers. When the Up-line crosses higher it is a signal of a bullish trend and when the Down line goes higher it is an indicator of a bearish trend. When both lines are under 50 it is a sign of consolidation.


