Estimating the strength of a trends' price that gets constructed on trading volume is the mission of the Chaikin oscillator, also classified as an indicator. No matter how you want to refer to it, it’s not a very popular instrument, although it was created in the 70s of the last century by a well-known trader Marc Chaikin.
Several technical analysis tools are credited to Marcs' name and get implemented by fellow traders on stock markets around the world. The main point of the indicator is to verify price turns and to signal for impending price reversals.
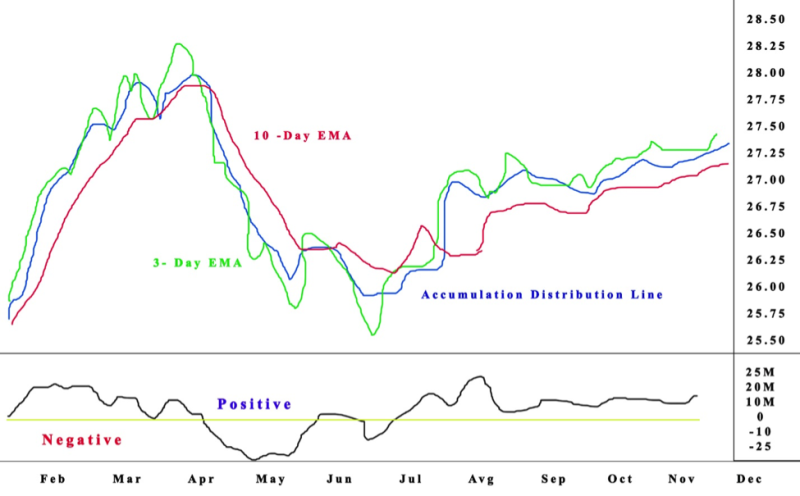
The Chaikin oscillator got sourced in part from a different indicator, the Accumulation Distribution Line (ADL), and gets estimated by removing a 10-period EMA from a 3-period EMA of the ADL indicator. It's basically the momentum indicator for ADL line.
The big difference of the Chaikin, when compared with other volume oscillators, is that it replaces the days' average price for the opening price.
The Chaikin oscillator produces signals with crosses below or above the zero line.
This oscillator shows on charts where the separation between the indicator and the price trend reveals that investors don’t believe in the present price trend and expect backtracking in the trend.
In a nutshell, the Chaikin indicator is the contrast between a ten-period moving average of stock price minus a three-period moving average of the new emerging ADL’s value.
Also read: Bill Williams Awesome Oscillator Trading Strategy
Contents
- What Does the Chaikin Oscillator Reveal?
- Calculating with Money Flow Volume and Money Flow Multiplier
- The Chaikin Oscillator Is the Moving Average Convergence Divergence
- How to Interpret the Oscillator
- Divergence
- Advantages and Disadvantages of the Chaikin Oscillator
- Conclusion
- FAQs
What Does the Chaikin Oscillator Reveal?
The Chaikin oscillator researches a business’s performance to collect data about the future course of the price stock. Most analysts are convinced that information is the crucial element necessary to predict the direction of the market.
Technical analysts think that the info gets priced into stocks and that patterns in the downs and ups of prices can more accurately forecast the directions of the market. Technical analysts implement the Chaikin oscillator to locate directional trends in momentum.
The best way to visualize how the oscillator gets used is to picture yourself in an auction. The buyers are located on the left while on the right you can find the sellers.
If the sellers outnumber the buyers, there will be a decline in the price, the opposite will happen if the buyers are more numerous than the sellers, then logically the price will rise.
Analysts assume that the equilibrium of this association is what creates the dynamic in financial markets. Traders calculate the stability among purchasers and sellers with several indicators, including the Chaikin oscillator.
Calculating with Money Flow Volume and Money Flow Multiplier
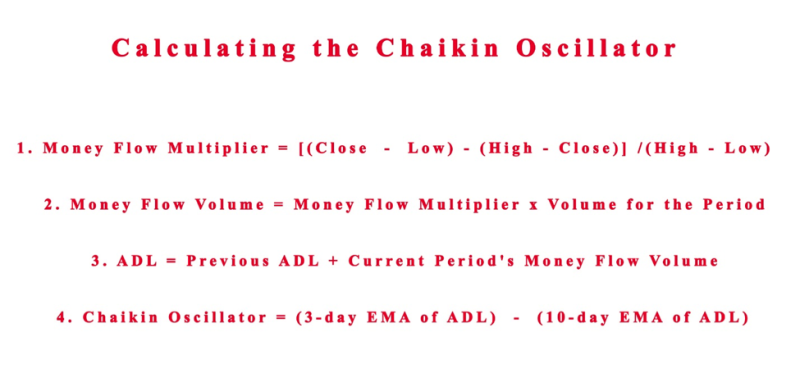
The formula used to calculate the Chaikin oscillator starts with the calculation for the Accumulation Distribution Line. The three steps start with estimating the Money Flow Multiplier, followed by the volume to locate the Money Flow Volume.
And the third step is adding the total Money Flow Volume to create the Accumulation Distribution Line (ADL). Finally, use the difference amid two moving averages to estimate the Chaikin Oscillator. So, to conclude the first three steps are used to estimate the ADL and the fourth produces the Chaikin Oscillator.
The Chaikin Oscillator Is the Moving Average Convergence Divergence
The Chaikin Oscillator is very similar to the Moving Average Convergence Divergence (MACD) used for the Accumulation Distribution Line indicator.
It’s an indicator of an indicator because it tries to forecast alterations in the ADL indicator.
The ADL got obtained from the index close location value (CLV), which contrasts the low, high, and closing prices of an asset.
When the closing price is under the midpoint of the high-low range, the CLV will be on the minus side, while the CLV will be positive if the closing price is over the midpoint.
Also Read: How to Use Moving Average
How to Interpret the Oscillator
The crucial thing to have in perspective is that the Chaikin Oscillator is an indicator of an indicator, estimating the momentum for the Accumulation Distribution Line .
This means that the oscillator is at the minimum of 3 tiers removed from the price of the asset. To start with the volume and price are formed in the Accumulation Distribution Line.
After that, the exponential moving averages get implemented to the Accumulation Distribution Line. And finally, the contrast among the moving averages is used to create the Chaikin Oscillator. Being a derivative, the indicator is liable to disconnect from the price of the asset.
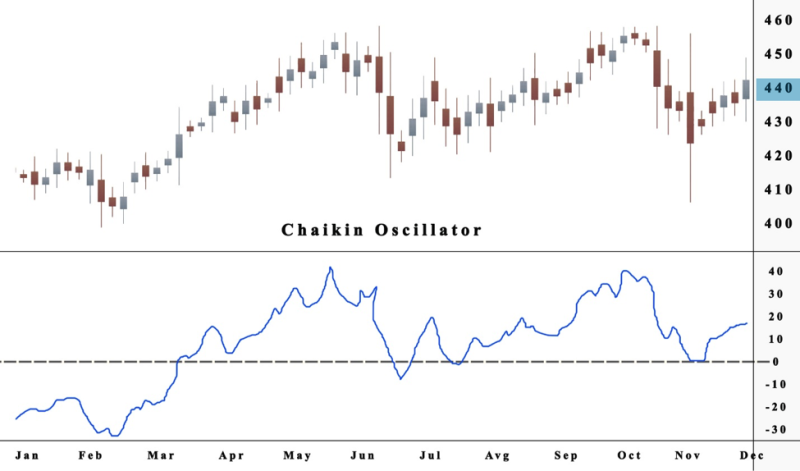
The indicator got created to estimate the momentum behind purchasing and selling pressure. Movement in positive territory signals that the Accumulation Distribution Line is climbing and buying pressure dominates.
The movement in negative territory signals that the Accumulation Distribution Line is declining, and there is a rise in selling pressures. Chartists search for a bearish and bullish divergence to find crosses into positive or negative territory.
Divergence
Bullish and bearish divergence signals traders that a change in momentum in buying or selling pressure that can predict a reversal of a trend on the price chart. A bullish divergence emerges when the price goes to new lows, and the Chaikin Oscillator creates a higher low.
This higher low indicates reduced selling pressure. It is crucial to be patient and find verification like a cross in positive territory. The movement in positive territory displays upside momentum in the Accumulation Distribution Line.
Investors use the Chaikin oscillator to predict changes in a direction, just like any other momentum indicator.
Because the shift in momentum is the first indication of a change in a trend, predicting alterations of the trend in the ADL indicator makes it possible for investors to forecast trend changes in the asset.
The Chaikin Oscillator creates signals with bullish and bearish divergences.
There are two bullish signals created by the Chaikin oscillator and does are the positive divergence and bullish centerline crossover.
In variation to the bullish signals, the Chaikin oscillator can generate two bearish signals, a negative divergence, and bearish centerline crossover. The bearish centerline crossover verifies the negative divergence.
Advantages and Disadvantages of the Chaikin Oscillator
Every technical analysis tool has positive aspects and negative characteristics. Understanding both is a requisite for performing well in the market. Investors need to harness the strength of a trend so they can make profits, and be careful not to be trapped by the weakness that can result in losses.
The Chaikin oscillator has a good track record, but it's not used very often, so it's hard to find a lot of anecdotal evidence from traders about its benefits.
When compared with other momentum indicators it can seem complicated, but some of the same principles apply, and day traders benefit from the Chaikin oscillator.
However, it has been in circulation for over half-century, and there is a lot of data to analyze that reveals the advantages of the oscillator and its shortcomings.
The pros of the Chaikin Oscillator:
- It’s a quick indicator
- Values are not redrawn
- Can be used in tandem with other technical indicators
The cons of the Chaikin Oscillator:
- Confirmation from other tools is necessary to remove frequent misleading signals
- The flexibility of the oscillator can be confusing to newbie and veteran traders
Conclusion
The Chaikin oscillator (CO) gets used by a minority of investors to confirm price trends, and that makes it one of the little-known technical indicators. The flip side is that it’s a productive tool, and if traders learn to use it, they can have success in the market.
Most investors prefer to use volume to verify the course of the price. The Chaikin oscillator is good to spot the equilibrium among volume and price, and traders use it by itself or with other indicators.
When the CO is at a high value, the ADL is at a low value about the asset price, signaling that selling pressure is rising on the asset and the reversal of the price is approaching.
The buying pressure rises when the CO is at a low value, and the price rise is also expected.
Investors can use the oscillator to locate the best time to sell or buy a stock and escape the trap of the approaching reversal. Best results get attained through practice, so open a demo account, use your preferred charting software, and experiment to figure out the method that best suits your trading strategy for the chosen market.
For day traders who think they can forecast the future, then the Chaikin oscillator can be used. Traders are always on the lookout for trading signals that may indicate trend reversal.
The best investment advice for beginners is to learn the nuances of the technical indicators, that way they will prevent situations where losing money rapidly is a strong possibility.
The Chaikin oscillator is effective, and that fact can't be hidden by its anonymity, most investors can benefit in day trading with the forecasting capacity of this indicator.
FAQs
How Does a Chaikin Oscillator Work?
The Chaikin Oscillator is the contrast between a ten-period moving average of asset price less a three-period moving average of the new ADL's value.
How do You Read a Chaikin Oscillator?
The Chaikin Oscillator reading over 0 signals purchasing pressure, and under 0 indicates selling pressure. The divergence between the indicator and the movement of the price is the most frequent signal from the indicator.
What Is Chaikin Oscillator Indicator?
The indicator was created to forecast directional changes in the Accumulation Distribution Line by estimating the momentum that is causing the movements.
Is Chaikin Money Flow a Good Indicator?
The Chaikin Money Flow is a solid indicator that offers analysts additional perspective of Chaikin's theories, about buying and selling pressure.