Investors that use trading platforms want reliable data that isn't corrupted by market noise. The Zig Zag indicator is the tool that can filter minimal fluctuations in the price trends of an asset, enabling traders to precisely follow the current trend. It is also practical for locating price levels of resistance and support.
The Zig Zag indicator is frequently implemented in combination with Elliott Wave Theory to identify the location of individual waves in the complete cycle.

Investors can try various percentage options to learn what set up provides the best outcomes. In some cases, a setting of 6% can define waves more precisely when compared with a setting of 4%. Assets have different patterns; investors can modify the Zig Zag indicator’s percentage setting to be compatible with the asset there are traded, no matter if it’s a stock or securities.
Also Read: Elliott Wave and Its Rules
Contents
- The Mechanics of the Zigzag Indicator
- The Zig Zag Indicator Formula
- Calculating the Zig Zag Indicator
- Riding a Trend
- Practical for Technical Analysis
- Detecting Price Movement
- The Zig Zag on Different Types of Charts
- Zig Zag Indicator Limitations
- Conclusion
- FAQs
The Mechanics of the Zigzag Indicator
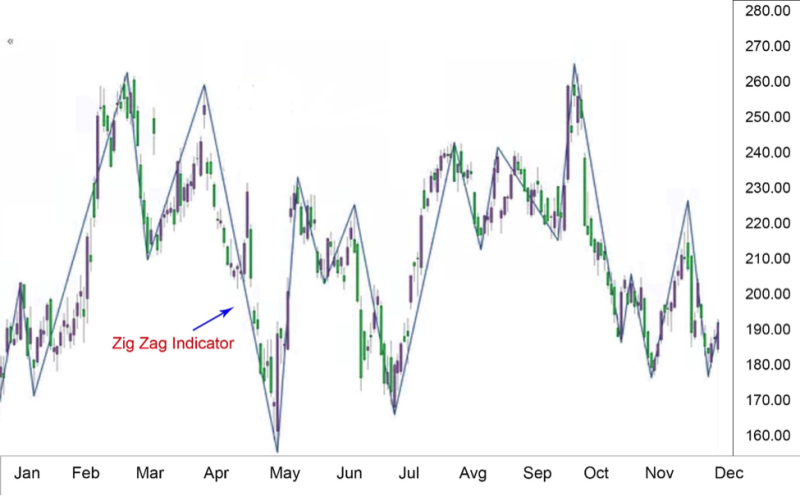
The indicator is a basic analysis instrument implemented on price charts to recognize the lows and highs of the price. It works by following when a price experience a change, expressed in a given percentage, after creating a high or a low, and lines connecting the points.
The Zigzag indicator is frequently used on price chart patterns to diagnose a trend. The advantage of the indicator is in the ability to eliminate a certain degree of volatility in markets and represent the trends with highs and lows.
Investors utilize turning points in price to form trend lines, but the validity of the trend lines leans on the settings used with the Zig Zag indicator.
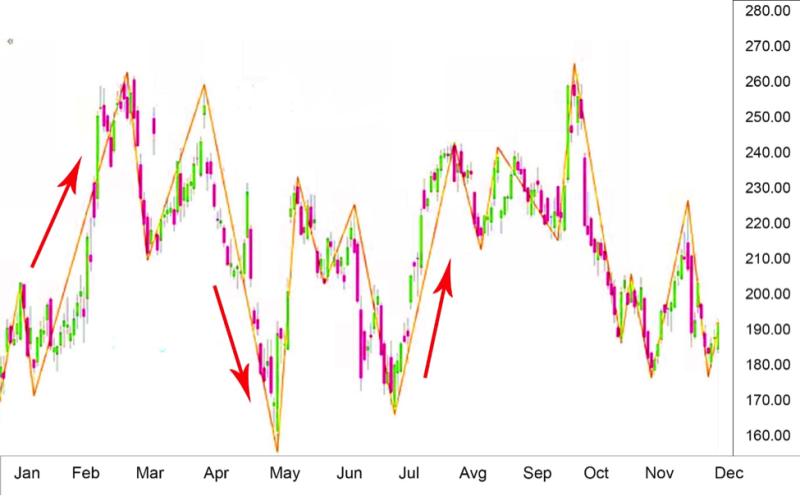
Traders can get a better perspective of the market with the Zig Zag indicator. In a rising trend, price move to new highs and lows. Conversely when a trend moves in a downward trajectory the price creates smaller highs and lows.
The Zig Zag indicator has few settings, one of them is the reversal percentage. When selecting the standard five percent, the technical analysis tool joins the preceding high or low to the present high or low when the price reverses five percent from both.
There are few applications of the indicator. It can be applied as previously said to figure out Elliott's wave theory and can reveal where the price is in the general cycle of the wave theory.
The option to modify the parameters permits investors to test strategies with the Zig Zag indicator and the altering fluctuations can show the indicator framing the Zig Zag lines in a another way.
If in need of a technical instrument that can easily enable you to locate support and resistance levels, the Zig Zag indicators are a great option as they can pinpoint when prices reverse.
The extra benefit is in recognizing possible reversal points with Fibonacci retracement levels.
The Zig Zag Indicator Formula
The formula for the Zig Zag is not complicated but some explanation is in order.
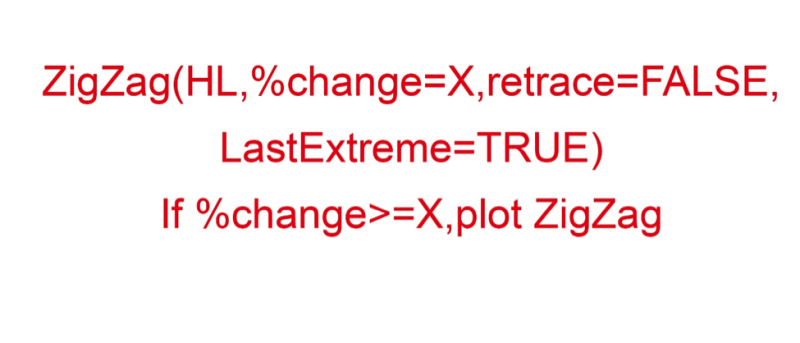
The values in the formula represent the following:
- HL equals High-Low price series or closing price.
- Series percentage change equals minimum price movement expressed in percentage.
- Retrace equals change a retracement of the previous move or an absolute change from peak to trough?
- LastExtreme equals If the extreme price is the same over multiple periods, is the extreme price the first or last observation?
Calculating the Zig Zag Indicator
When calculating the Zig Zag use these steps
- Select an initial point it can be a high or low swing.
- Select percentage price movement.
- Locate the following swing highs or swing lows that is different from the initial point that equals the higher percentage of the price movement.
- Form a trend line from starting point to the new point.
- Locate following swing high or swing low that differs from the new point that equals the higher percentage of the price movement.
- Create a trend line.
- Repeat to most recent swing high or swing low.
Riding a Trend
The capability to eliminate insignificant price movements that happens during an overall trend is a priority for traders. The Zig Zag indicator is created to assist investors in perpetuating a profitable market position during a consistent trend.
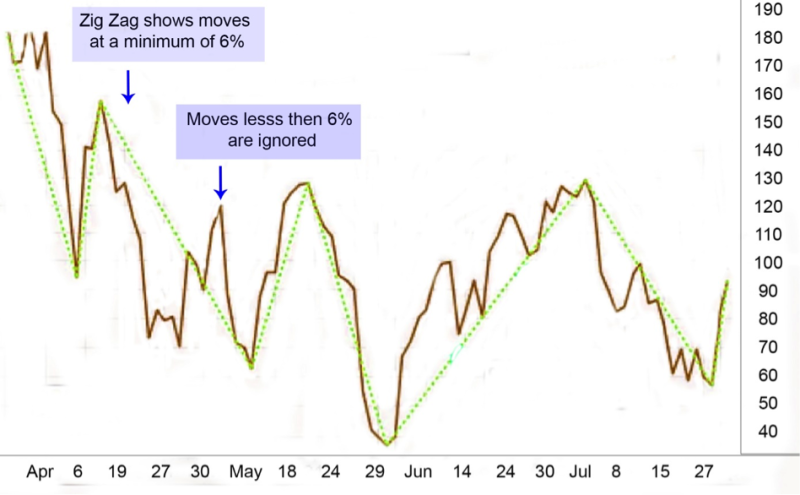
On a chart trend lines are formed by the Zig Zag indicator. They are modified exclusively if price movement over a chosen percentage happens. The default value on most variations of the indicator is 5%.
That means that the Zig Zag indicator is not sensitive to changes in price that are under five percent.
Investors can modify the indicator and choose a different setting for the percentage. Typically, the values move in the six to ten percent range.
This price movement threshold saves investors from being deceived by minimal price fluctuations. The Zig Zag indicator focuses on the general trend. Some traders leave profitable positions because of minimal price action.
Practical for Technical Analysis
The Zigzag indicator is not too complicated and can be a practical tool in a trader’s arsenal. Still, experience has thought us, that no indicator is foolproof. When applying it, you should find the appropriate strategy. There are situations where it can be a good fit but also trades where it would be a hindrance on the route to success.
Implementing the Zigzag depend on the existence of a trend, naturally to trade you need a trend, and if you using short –term chart for example in the range of an hour, then the indicator will not display the proper alarms. The reason is lag that by definition will make you late for the opportune trade.
It distorts the risk to reward ratio, which can result in future problems. The unpredictability of the market is not balanced out with technical indicators. And in some aspects trading is similar to gambling, which means that in the long run, your profit must surpass accumulated losses for success.
The Zigzag indicator only perceives the amount of change in the assets price. Most traders focus on price as a metric that reveals the market movement, however, other elements can be useful like moving averages, Fibonacci level, and psychological factors of marker participants.
The Zigzag pattern has no interest in trend line or candlestick price action. Any break in the trend line will be spotted by traders much faster than the Zigzag indicator is capable of doing. Experience has shown that the Zigzag indicator is solid when matched up with larger time frames.
Points to keep in mind when implementing the Zigzag indicator are:
- Is more productive in higher time frames.
- Not very effective in turbulent sideways markets.
- Ignores other technical factors.
- The preferred method is to pair the Zigzag with another indicator.
- It's modular and should be adapted to investors' strategies.
The elaboration of the Zig Zag shows it’s a solid alternative indicator in your strategy. When searching for a probable pullback to start buying, the Zig Zag indicator has already flipped over contra that pullback, and indicates that the indicator is convinced the market is going in a different direction.
Also Read: How does technical analysis work?
Detecting Price Movement
The best course of action is to implement the Zig Zag when verifying a pullback and continuation of a longer-term trend. When price pulls back in an uptrend and then turns around, resulting in the Zig Zag indicator going bullish.
It’s a solid indication for investors that are focusing on longer-term trades to begin purchasing and improving their position again, and continually harvesting profits.
It's a very practical indicator because it has a basic structure. Most technical analysis tools complicate things and the Zigzags stick to a simple approach. Because of this market analysis is simplified by examining only the percentage of movement.
The Zigzag indicator has value and investors can use it, but by itself, it doesn't create a signal. The only traders that implement the Zigzag for a trade signal are longer-term investors.
Most traders that prefer the indicator use it on daily charts or bigger higher time frames. When applied to short-term charts, the performance gets reduced because it was not originally developed for that type of trading.
The Zig Zag on Different Types of Charts
The functioning of the Zig Zag indicator is dependent on the chart type it is used on. It functions on closing prices is used on line or dot charts. While when candlestick charts and bar charts are used it reacts to the entire price range. If more changes in the Zig Zag occur, then extra trend lines are formed if bar or candlestick charts since they will show a wider range of prices than charts that only show closing prices.
Zig Zag Indicator Limitations
Just as is the case with every other trend-following indicator, signals to buy and sell are produced on previous price history. Offering no guarantees that can forecast future price action. In most cases, the trend will emerge and afterword’s the Zig Zag line will be displayed.
Traders need to know that the recent Zig Zag line, that got displayed may disappear soon if the process goes in a different direction in that case the indicator begins creating a fresh line.
When the line is not able to contact the percentage of the indicators setting and there is a reverse in the assets price, the line is detached and changed with an extended Zig Zag line in the trend’s initial direction.
Taking into account the lag, the Zig Zag indicator verifies the direction of the trend and is not suitable for timing optimal entry or exit.
Conclusion
The Zig Zag indicator offers few benefits for your trading strategy, yet it should get implemented only if you have know how to implement technical analysis in trading strategies.
The recommendation for passive investors, who don’t make adjustments to their trades for long periods, to stay clear of the Zig Zag indicator. It’s not very practical when you need a tool to predict future trends.
Its highly effective in removing insignificant short–term price movements enable us to more easily recognize the important ones. It’s not practical to follow every price movement that happens in the market is not a productive way of your time and resources.
However, not every movement in price requires you to sell or buy. You can be confident that even the most profitable investments will not experience daily fluctuations, and with the Zig Zag indicator, you can identify significant swings in highs and lows, the moments where the price change its course.
The technical indicator helps get a larger perspective about the asset, especially if you see it with other technical analysis tools, that enable you to spot long-term patterns.
It's normal for a stock to experience few swings both highs and lows, and in combination with resistance and support lines, the Zig Zag indicator can be productive.
The Zig Zag is lagging indicator and the reason is that values are presented only when the close of every time period.
Its recommended to use it as a pair with other technical indicators, that way you can compensate for its shortcomings and benefit from its capabilities.
There are plenty of different trading strategies that can be improved with the Zig Zag indicator especially swing and momentum trading.
The key takeaway is that the Zig Zag indicator has a definitive function, it is not a do it all type of too. It was design to for the filtration on minimal changes in the price, making it possible for investors to retain their focus on the general trend.
The Zig Zag indicator is a commonly implemented tool in the trading community. The reason for its wide use, stems from the simplicity of its functioning method that indicates the highs and lows in the price.
FAQs
How do You Read a Zig Zag Indicator?
The Zig Zag indicator offers an option to observe the general movement on a chart. We can illustrate that with an example if company ABS stock begins the month at $10. And in about a week, because of some factors the price declines by 10%, and then goes back up about 10%, the fluctuates are minimal and the general direction is upwards.
What does Zig Zag Pattern Mean?
The Zig Zag indicator reduces the effect of random price fluctuations and gets used to recognizing price trends and changes in price trends.
What Is Zig Zag Strategy?
The goal of the Zig Zag strategy is to help traders stay in a winning position. And not succumb to fear from minimal changes in the price that is persistent in the market.
What Is Depth in Zig Zag Indicator?
The depth is the initial setup of the Zig Zag indicator, the smallest amount of bars without a follow-up deviation of the bar.