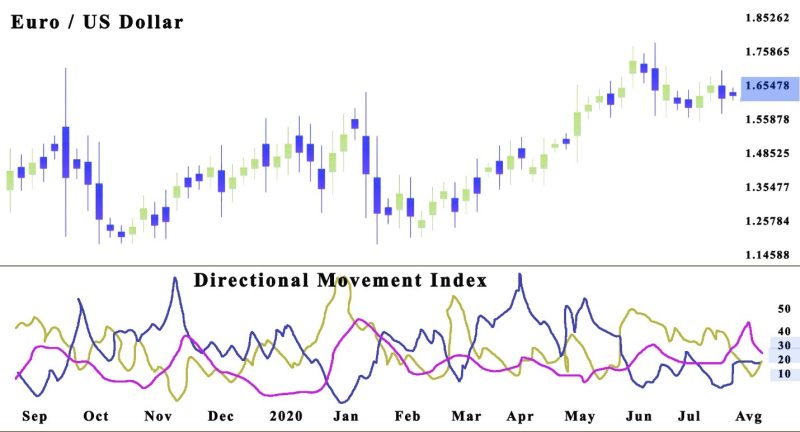
The Directional Movement Index is a popular technical indicator, but many traders who use it to determine future price direction should be careful about the false signals it can produce.
Both positive and negative directional indicators get displayed as two independent lines. Usually, the positive directional indicator is the contrast between the highest price of the present day and the previous day's highest price.
While in the case of the negative directional indicator, you can use the identical formula, by just replacing the highs with the lows from the previous day's true range, and average true range.

These lines are displayed on charts and are color-coded. If the +Directional Movement Index (DMI) gets indicated with a green line and the -DI with a pink line, then if the pink line goes over the green line that is a signal that the price is dropping.
When the green line is over the pink line, that is a signal that the price is rising. In cases where both indicators repeatedly crisscross, then it’s not a new trend emerging, the price is moving sideways.
Contents
- The Third Line Is The Average Directional Index (ADX)
- How To Read The Directional Moving Average
- The Disadvantage Of The Directional Movement Index
- Bearish And Bullish Crosses
- How Is The DMI Different From Aroon Indicator
- Conclusion
- FAQs
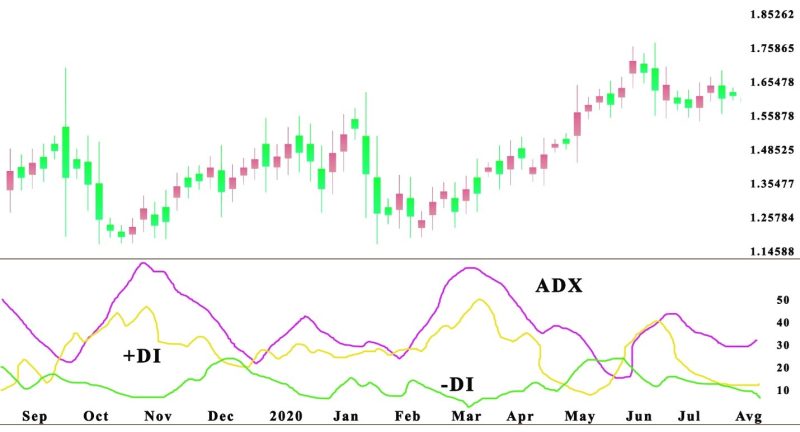
The Third Line Is The Average Directional Index (ADX)
As we mentioned previously, on some charting software, a third line gets used to show the ADX. Its role is to indicate the potential of the trend.
To be more precise, both the positive and negative directional indexes do what their name suggests, showing the price direction.
Yet the Average Directional Movement Index is the instrument that tells brokers how strong is the trend they are observing to start taking shape.
Generally, an ADX over 25 gets perceived as a strong trend. When the ADX goes under 20, that means no trend is forming, and the price is moving sideways.
Also Read: How To Use The Fractal Indicator
How To Read The Directional Moving Average
Before we dive into the implementation of the indicator when trading, let's recap what the positive and negative symbols mean for the directional index.
The DMI is positive if the current price minus the high of the previous day is large than the preceding low minus the present low.
The result is that this index is typically equal with the present high minus the preceding high if positive.
With the minus directional indicator, we have the reverse situation. It forms if the previous low minus the present low is larger than the current high minus the earlier high.
Mastering the theoretical aspect of the Directional Movement Index (DMI) is necessary for implementing it in the market .
It’s not required to be an expert, but you have to grasp the basics so you can implement them in the market.
The DMI indicator gets based on three colored lines. In the chart, the crucial line is the red one because it shows the ADX. This line reveals what is the situation with the price.
If the ADX is 25 or over, it reads as a powerful trend, and if under 25 and drop indicates that there is no major trend. The other two lines that can be colored by personal choice are the positive and negative DM.
The Disadvantage Of The Directional Movement Index
The biggest problem with the directional movement system is that it generates plenty of false signals. It's a risky tool, and when using the indicator, traders should be careful.
The review of +DI and -DI and crossovers are tied to historical prices and they do not show future activities. When a crossover happens, it can cause a losing trade.
The lines can also intertwine, and it can result in several indicators without a trend in the price. Investors can avert these by making trades in the larger trend direction.
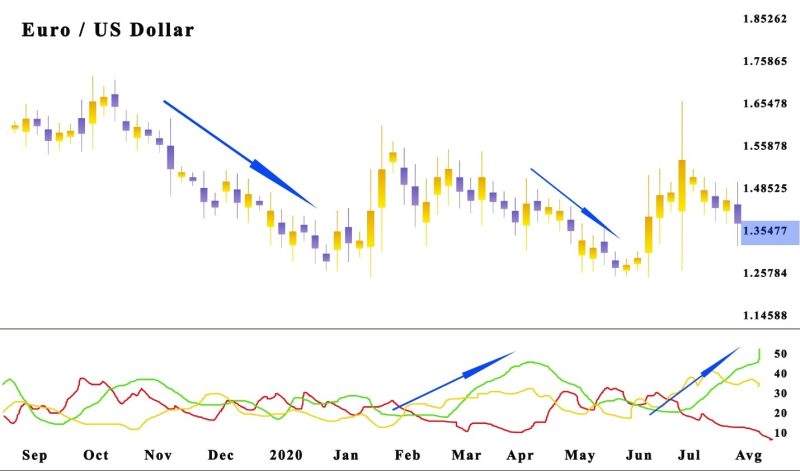
Bearish And Bullish Crosses
Directional Movement Index (DMI) crossovers are the significant trading signal generated by the DMI. There is a particular set of conditions for each cross.
In the case of a bullish trend, the DI has to cross the ADX above 25, and the +DI crosses over the -DI. Traders should implement stop loss at the present day's low.
Bearish DI Cross is when ADX is above 25 and the -DI crosses over the +DI. Stop-loss orders get placed at the present day's high.
How Is The DMI Different From Aroon Indicator
There are similarities between the two indicators, both use a pair of lines, yet the DMI also incorporates the ADX. Most trades get them mixed up because of the positive and negative movements used to locate trend direction.
The formula for calculating the indicators is different, and the crossovers happen at different times.
Conclusion
Directional indicator is beneficial for following the trade signals about a given price. Yet the information received should always be verified by another technical indicator.
It's beneficial to use the indicator because it simplifies a complex subject into a visual representation that is easy to understand.
Most trading platforms incorporate the DMI into their software making it optional for different trading strategies that generate selling signals that are important for corporate finance.
The indicator shows the trend strength thanks to the ADX reading, and the price movement showed by the directional indicator (DI) reveals if the trend trends above the previous high, basically trending upwards.
The key point about the Directional Movement Index (DMI) is that it can offer good information that can help in performing quality trades but it is not an easy indicator to learn. Success depends on how you continually upgrade your own knowledge and modifying how you use the indicator.
Also Read: A Complete Guide To Hedging Forex
FAQs
How Do You Read a DMI Indicator?
Whit the Directional Movement Index, the signals are not hard to read. If the +DMI is prevailing and the climbing price trend is on an upward trajectory.
If the -DMI prevails and the trajectory of the price is down. You shouldn't forget to figure in the price’s strength.
What Is the Difference Between ADX and DMI?
The ADX line gets used to estimate the trend's strength, while the positive and negative Directional Movement Index are tools for recognizing price trajectory.
How Do You Use ADX DMI Indicator?
If the +DMI is over the -DMI, that the price is on an upward trajectory, and ADX gets implemented to estimate the strength of the new trend. When the -DMI is over the +DMI, prices are heading in a downward direction, and ADX again is there to calculate the strength of the new trend.
What Is a DMI Oscillator?
The DMI Oscillator is a technical indicator that incorporates the values of the Directional Movement Index to forecast assorted sides of market dynamics. Both elements of DMI get used in the calculation: DI+ and DI-. The DMI oscillator estimates the difference amid these elements and displays it as a line and a histogram.