Traders are always digging through mathematical books searching for an algorithm that can help them get an edge in the market. Not surprisingly, concepts like chaos theory and fractal geometry are the basis behind the fractal indicator. Fractal signals are used to calculate irregularity, and investors need to know when the market is unsuspectingly changing direction.

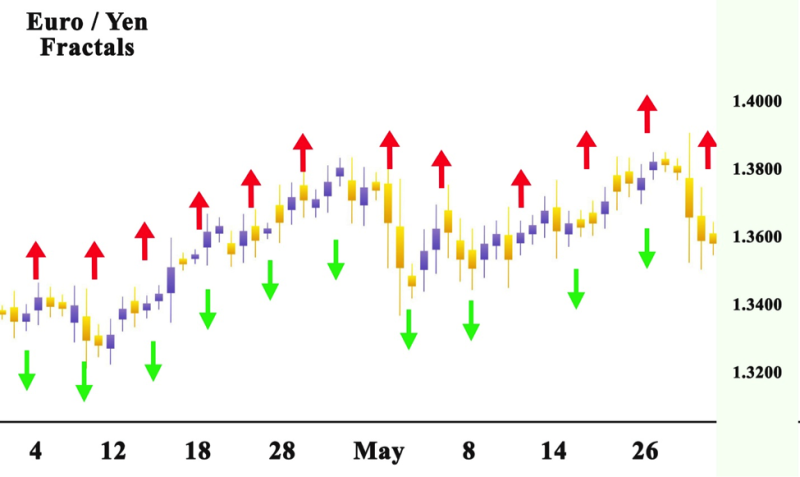
As a trading indicator investor use it to spot the pattern, helping them decide should they buy or sell, depending on if the fractal indicator is bullish or bearish. When used in a chart, the fractal indicator is shown as geometric forms over and under the candlesticks. The fractal is a bearish sign and the fractal indicated under is is a bullish sign.
Also read: Candlestick Patterns Cheat Sheet
Contents
- Chaos Theory and Williams Fractal Indicator
- Key Principles Fractals in Technical Analysis
- Interpreting the Fractal Pattern
- Applying Fractals
- Benefits of the Fractal Indicator
- Disadvantages of the Fractal Indicator
- Bullish Fractals Indicator
- Bearish Fractals Indicator
- Deference in Fractal Indicator and Chart Patterns
- Conclusion
- FAQs
Chaos Theory and Williams Fractal Indicator
Created by famous trader Bill Williams, in honor of the developer it is also referred to as the Williams fractals. His intention was to find a tool for trading analysis that recognize the most basic repeating patterns and signal potential trend reversal in the market.
Originally Bill presented the concept behind the fractal indicator in his book, “Trading Chaos ”, where he freely admitted that the idea was inspired by chaos theory. In mathematics, there is a lot of theoretical concepts, but traders what tools they can implement in practice. Basically, fractals are a recurring pattern, allowing brokers to profit from recurring patterns of price movement that happen in different time frames.
Also Read: Bill Williams Awesome Oscillator Trading Strategy
Key principles Fractals in Technical Analysis
In the development of the fractal indicators, three principles are used. The first is that energy goes by the road of least opposition in the market. Frequently currency pair that is dropping, continues plummeting until it encounters strong fronting force. Traders will always leave a trade when the pressure of losing money larger than the distress of losing more cash.
The second principle is that the road of smallest opposition resistance is set on by the fundamental structure of the market. The final principle is that the unknown composition can be found and changed.
Interpreting the Fractal Pattern
The fractal pattern comes in two shapes “V” or “U” forming in the upper or lower level of the market. The pattern is seldom flawless and uniform. The design of price action signals the market reversal of an up-trending market that is going down or a downtrading market moving up.
The fractal pattern is explained as recognizing a short-term level of price support, also known as a bullish fractal or a bearish fractal that indicates price resistance.
Investors never rely only on the fractal pattern, but use it in combination with other indicators that display support or resistance indicators. Most used the daily pivot points, to assess the power or potential commitment of the fractal indicator’s indicator of a trend reversal.
Applying Fractals
Most charting platforms incorporate fractals as a trading indicator. Traders do not have to search for the pattern. When using the indicator on the chart, and software will display all the patterns. Traders will recognize an obvious problem, the pattern pups up often.
The best approach is to use fractals with other technical indicators. It is a tool created from different moving averages. Brokers use bullish signals to make buy signals when the trend is up.
Draw a bearish fractal on a chart with an up arrow above it, even though it is a little bit confusing. Mark a bullish fractal with a down arrow below them. Look for the down fractal arrows if using fractals in an overall uptrend. Observe the up-fractal arrows, if looking for bearish fractals to trade in a larger downtrend.
Day traders utilize the fractals indicator to support other indicators like the market facilitation index, moving average, RSI, and. Other traders use it to confirm a bearish or bullish trade.
It can be used to find the biggest and smallest points of an asset while others use it to locate entry and exit points.
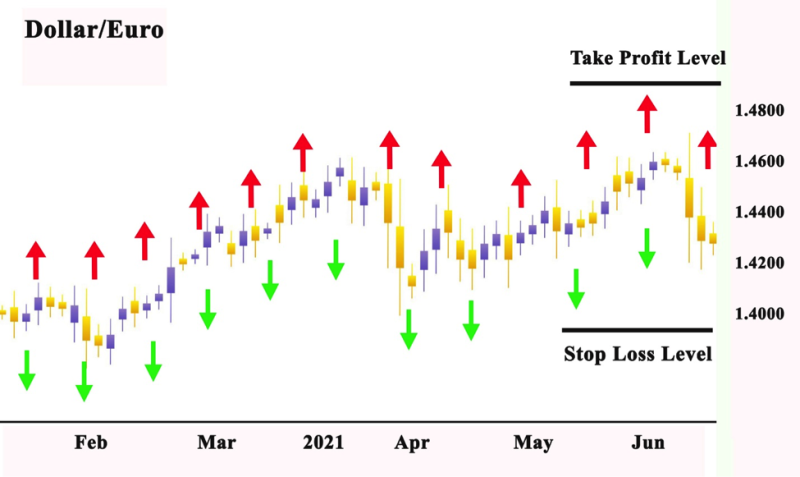
Still, others benefit from the indicator by utilizing it for discovering stop-loss levels.
Benefits of the Fractal Indicator
The pros of the fractal indicator are that it offers an easy way for traders to identifiable market entry points and with equally easy-to-spot price points for stop-loss orders. Some other benefits include:
When you master it, can be easy to use and to find possible alerts and trading signals.
- Traders can use fractals as an extra indicator when resolving the trends.
- Useful for setting take-profits and stop-losses.
- The indicators reveal potential resistance and support levels of buying and sell positions, omitting the highs and lows.
- Identifies potential breakouts.
Disadvantages of the Fractal Indicator
The cons of the fractal indicator are that the patterns occur often in the ordinary course of price action movement, these result in false signals.
- Relatively difficult to understand
- Traders avoid implementing the indicator during a sideways moving market. They need to trade fractals during the trending market.
- Fractals lag behind other indicators, the reason a 2-bar delay draws them. This means that when it offers a signal, the price may be at another level compared to the signal.
- It is perceived as an outdated technical indicator.
- Traders need to pay attention to the formation of fractals because some of them may give misleading signals.
Bullish Fractals Indicator
A bullish fractal pattern signals a market reversal to the upside, forms when each of three successive candlesticks shows price moving to a lower low, these are followed by two candlesticks showing price action with a higher low than the low of the preceding candlestick.
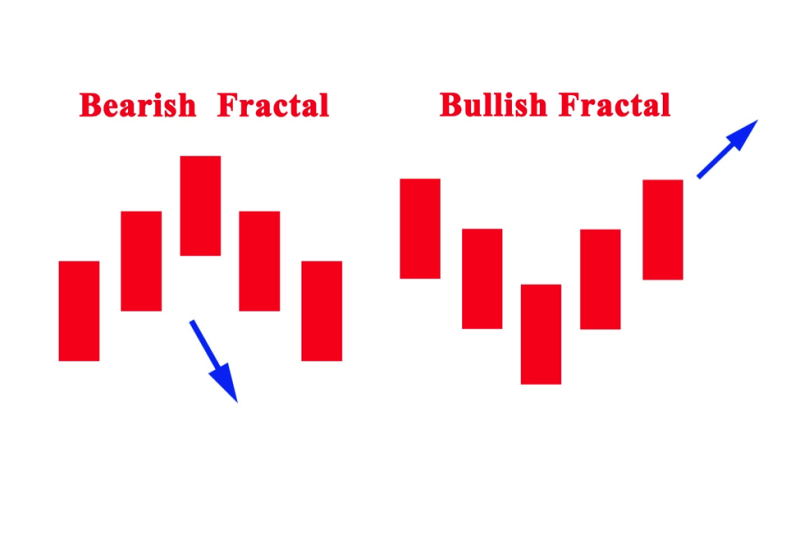
Bearish Fractals Indicator
The bearish fractal pattern signals market reversal to the downside and emerges when each of three successive candlesticks shows price attaining a higher high, followed by two candlesticks showing price action with a lower high. Then the high of the preceding candlestick.
Deference in Fractal Indicator and Chart Patterns
The fractal indicator is original in that it recognizes a price pattern and marks it on the chart. Fractals are specific five-bar patterns. Chart patterns can also be drawn on the chart, although they are not limited to five price bars. Some applications will mark chart patterns on a chart, but most chartists locate and isolate chart patterns by hand.
Also Read: How to read a Stock Chart
Conclusion
Fractals are useful Forex tools in any trading strategy and can offer smooth trading and are appropriate for automated Forex trading software. Young traders just starting to learn the business should study technical indicators to learn the nuances but with the fractal indicator in their trading toolbox, they will get better at their trading skills. If you are learning Forex trading, then take a look at the Fractal indicator. This will give you an idea of how to improve your trading and freely seek financial advice from other traders.
There are complex instruments that traders can use to invest money especially if they have a risk appetite or protect the initial investment. The benefactions of Bill Williams to technical analysis cannot be underrated. Williams fractals are not the most popular indicator, but they can be perfect for showing you support and resistance levels. Fractal patterns are used daily and are good technical analysis tool.
Fractals may be useful tools when used in conjunction with other indicators and techniques. They can be used in many different ways, and each trader may find their own variation. Using an alligator indicator is one option, and another is using fibonacci retracement levels. While some traders may like fractals, others may not. They are not a requirement for successful trading and shouldn't be relied on exclusively.
FAQs
How do You Trade with Fractals?
Fractals analyze the daily randomness of the market with technical analysis and candlestick charting. The market is considered stable when it is comprised of investors of different investment horizons given the same information. Fractals check the role of liquidity and the impact of information through a full business cycle.
There are two common trading concepts in technical analysis relating to fractals; fractal reversal patterns and fractal multiple time frame analysis.
What Is Williams Fractal Indicator?
The Fractal indicator was developed by Bill Williams, to perceive turnaround points, helping traders make buy or sell choses.
What Is fractal Chaos Indicator?
Fractal Chaos Indicator is a trend cover. The stock market moves in a chaotic way. The technical indicator displays a general framework of the price action by separating the unimportant variation of the price of the asset.
How does Williams Fractal Work?
The Williams Fractal tries to identify turnaround points and indicate them on the chart by displaying them with up and down fractals that have unique graphic forms. The indicator reveals in which way the price will evolve.