Contents
- Average Directional Movement Index
- History Of Average Directional Movement Index
- How To Calculate The Average Directional Movement Index
- How To Read The Average Directional Movement Index Indicator
- ADMI- Positive Directional Indicator
- ADMI – Negative Directional Indicator
- How To Trade Divergence And Convergence – Average Directional Index
- Limitations
- Conclusion
Average Directional Movement Index
Successful forex technical traders have one thing in common, they identify and understand the trend and follow the trend successfully. It is true that intraday traders, short-term technical traders, and long-term traders differ in their perspectives on technical analysis. However, the underlying idea of technical traders is to apply various tools at their disposal to identify the trend.
In one way or another, the process of technical analysis will always have an element of trend analysis. Many trading strategies will provide the final outcome based on the current market trends. Trend analysis forms the basis for numerous auto trading software because successful identification of price trends in any financial market including forex, stock market, options, bonds, cryptos will provide the best trading results.
Trend trading provides the trader with low risk and high reward trading strategies. The minimized risk is due to the factor that the trader stays in a direction where most of the traders are trading. This enables the trader not to predict the next price movement, but to follow an established market direction.
The core of technical analysis can be divided into price prediction and price following. While the benefits and limitations of trend prediction and trend following are debated widely. It is the personal preference of the trade to choose to be a predictor or follower of a trend. Most technical traders will accept the fact that trend following produces far better results than trend prediction. However, a combination of both will in effect provide with best trading results.
What Is Average Directional Movement Index
The average directional movement index is a technical indicator that provides the direction of the current price trend. Therefore, forex traders can easily identify the trend direction and trade along with the trend. However, it is essential to also gauge the strength of the trend. The strength of the trend will help the forex technical trader devise exit plans for the current trade. Technical traders will agree that the exit of trade is equally important as the trade entry itself.
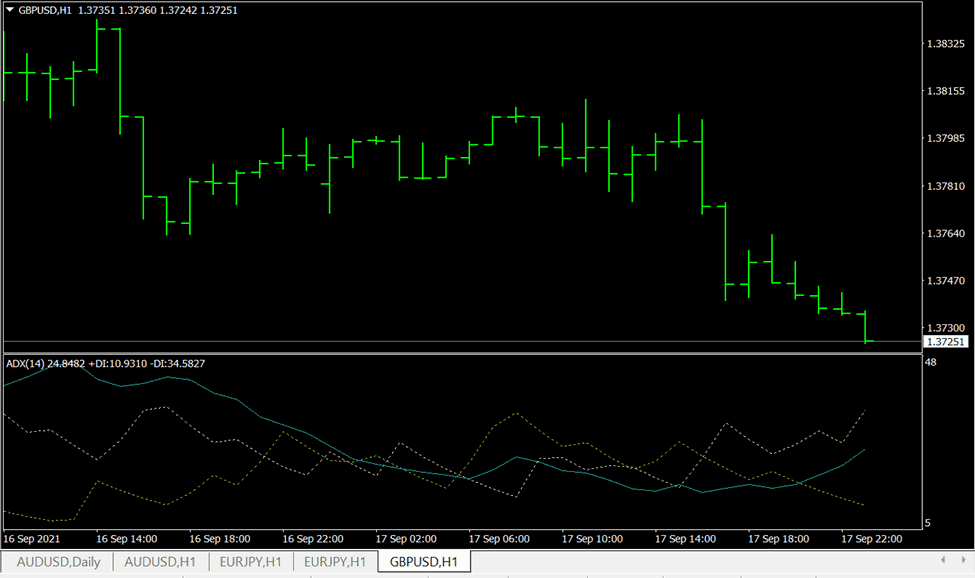
The Average directional movement index indicator also called the ADX indicator is used to determine trend direction and the trend strength and helps the traders to decide to stay in a current position or to exit the trade if and when necessary. The indicator consists of 3 lines. Firstly, the positive directional indicator line +DI. Secondly, the negative directional indicator line -DI and finally the ADX line. The indicator is plotted as a fixed level indicator in MetaTrader with the upper-level set at 45 and the lower one at 7. However, other technical trading and charting platforms may provide different upper and lower-level values.
The indicator displays the +DI line in Green and -DI line in Wheat color, while the ADX is plotted in Sea Green. The three lines combine to display the current trend direction and the trend strength. By using this indicator technical analysts and traders can also apply divergence and convergence trading strategies and benefit from the indicator’s leading properties. In other words, the indicator can act as a leading indicator and indicate future trend directions, if divergence and convergence trading strategies are applied.
History Of Average Directional Movement Index
A famous technical analyst and market technician J. Welles Wilder introduced and developed the average directional movement index indicator. He introduced the trading idea and resulted in the subsequent trading indicator in his book “New Concepts in Technical Trading Systems” in the year 1978. No matter the indicator was developed long back but it still works as intended and expected. The indicator was developed primarily for the commodity and currency markets. However, it is equally effective in all financial markets including stock, futures, options.
The other most appreciated works of Wilder include but are not limited to Average True Range (ATR), Relative Strength Index (RSI), Parabolic SAR. It is imperative that all of these technical indicators are available in almost all trading platforms and charting software. It is beyond any reasonable doubt that these indicators form the basis of the technical analysis of many technical analysts and auto trading software.
How To Calculate The Average Directional Movement Index
The indicator can be calculated using the following formulae.
+DI=(Smoothed +DM/ATR)×100
-DI=(Smoothed -DM/ATR)×100
DX=((+DI-(-DI)/(+DI+-DI))×100
ADX=((Prior ADX×13)+Current ADX)/14
The process of calculation can be as follows,
1. Firstly, calculate +DM, -DM, and the true range (TR) for each period. Typically, fourteen periods are enough for the indicator calculation.
2. +DM = current high values – previous high values.
3. -DM = previous low value – current low value.
4. Use +DM if current high – previous high is greater than the previous low – current low. Use -DM if the previous low-current low is greater than the current high – previous high.
5. TR is the greater of the current high – current low, current high – previous close, or current low – previous close.
6. Smooth applying the 14-period average values of +DM, -DM, and TR—the TR formula is below. Apply the -DM and +DM values and calculate to get the smoothed average values.
7. First 14 True Range = sum of first 14 True Range values.
8. Next 14 True Range value = first 14TR – (previous 14TR/14) + current True Range.
9. Next, divide the smoothed +DM value by the smoothed values of the True range to get +DI. Multiply the results by 100.
10. Divide the smoothed -DM value by the smoothed True Range value to find the -DI. Multiply the results by 100.
11.The (DMI) is +DI – -DI, divided by the sum of +DI+-DI with the result multiplied by 100.
12. To get the ADX, continue to calculate for the next 14 periods. Then, smoothen the results to get ADX.
13. First ADX = sum of the 14 periods of DX / 14.
14. The following, ADX = ((previous ADX * 13) + current DX) / 14.
How To Read The Average Directional Movement Index Indicator
Traders must work with the three lines of the ADMI indicator. The indicator looks at the difference in price between the previous lows and the previous highs as explained in detail in the formula heading previously.
To simplify the formulae and to identify a trading approach using the numbers the charting platforms mostly simply and help the trader to visualize them and arrive at a trading decision. The +DI line is generally bullish and the -DI lines are negatively bearish in nature. So, the traders should look at the -DI and -DI lines carefully. The ADX signal line can be added to the equation to finalize the results.
The +DI and the -DI indicate the trend strength. If the trend is stronger then the +DI lines keep rising. The rising +DI line shows the Bullish nature of the market. On the other hand, the -DI indicates the bearish market trend, the rising -DI line shows the presence of the bears in the market.
ADMI- Positive Directional Indicator
If the +DI is above the -DI then the price is in an uptrend, so forex traders must consider going long. Alternately, if the -DI is above the +DI then the price is in a downtrend, hence traders must consider taking a short position in this scenario.
The next important line is the ADX signal line, the ADX signal line indicates the presence or absence of the trend. The ADX line must be rising and should be above 25 levels to validate the presence of the market trend.
Alternately, if the ADX levels are below 25 it shows the absence of the current market or indicates an indecisive market state. Thus, it is not recommended to enter a trade when the ADX line is below 25 as the primary intention of the trader is to identify the presence or absence of trade. Once the presence of trend is established then traders can look at entering the market using the +DI and -DI lines.
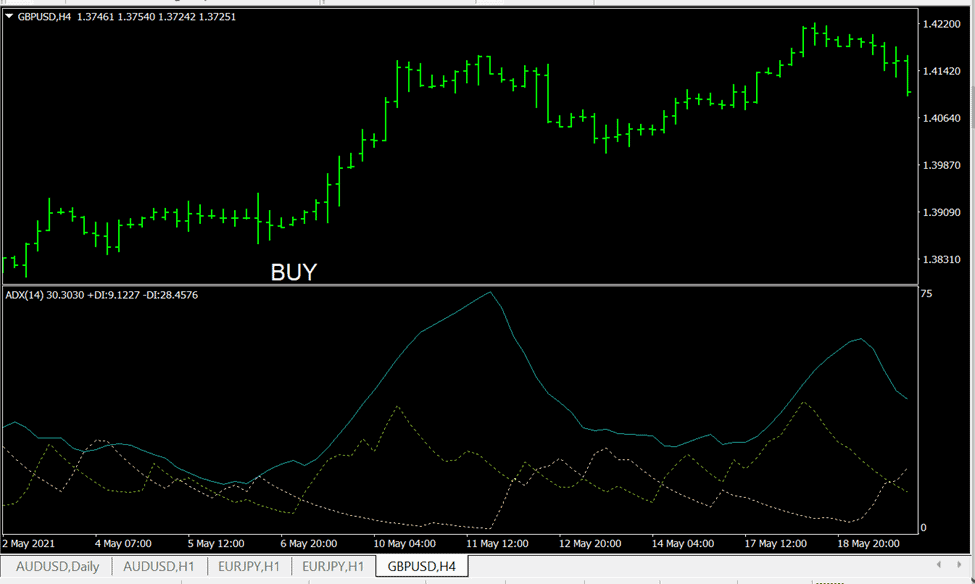
To place a trade, first traders should look for a rising ADX line above 25. Once this is validated and the presence of the trend is confirmed, traders should turn their attention towards identifying the direction of the trend. The direction of the trend is identified by the crossover of the +DI and -DI lines. If the +DI has crossed the -DI to the upside, then traders can enter a BUY position
ADMI – Negative Directional Indicator
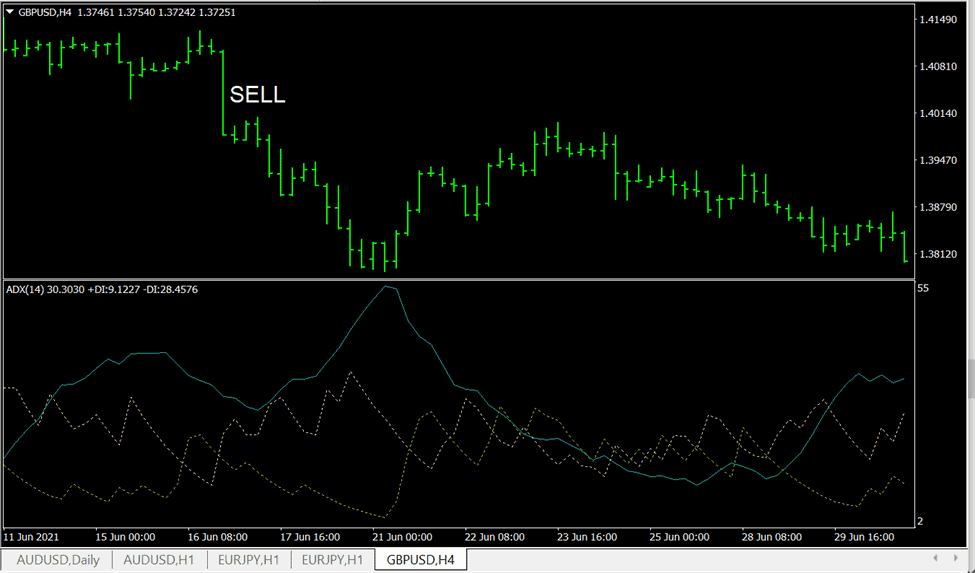
Similarly, if the ADX line is above 25 and the -DI crosses the +DI line upwards it shows the bearish market trend. So, traders should consider entering a SELL trade.
The Average directional movement index indicator can be used to exit the trade positions as well as enter one. In case of a BUY, position traders can place a stop loss below the previous swing low and exit in case of price reversal on the other hand traders can use the ADX signal line to measure the trend and exit accordingly. If the ADX line falls below 25 it indicates the absence of trend so traders can exit the trade. The indicator is a trend following indicator, so traders tend to ride the trend as much as possible. Traders can look at booking profits if the +DI line crosses the -DI line downwards.
Similarly, in a SELL position, traders can place a stop loss above the previous swing high, as price movement above the previous swing high may negate the trend direction. So, forex traders can exit using this method, alternatively, if the ADX line falls below 25 values then the traders can exit the position as the trend wanes. Moreover, if the -DI line crosses the +DI line indicates the rising influence of the Buyers, in this case, traders can consider exiting the SELL position.
Another important method of identifying the presence of trade is to analyze using the ADX signal line. The ADX signal should make higher highs if the trend gains momentum, similarly, when the ADX signal line makes lower lows continuously it shows the losing momentum. A similar approach can be applied to the +DI and -DI lines to identify the momentum of the trend.
During an uptrend, the +DI line should be making a series of higher highs and during a downtrend, the -DI line should be making a series of higher highs.
How To Trade Divergence And Convergence – Average Directional Index
The Average directional movement index indicator displays divergence with the price at certain times . The opposite trend indication of the price and the indicator lines indicate an impending price reversal. So, traders spotting divergence or convergence of the indicator and the price can use the indicator as a leading indicator and prepare trading strategies for a reversal.
Also Read: Inspire Brand Stocks
Limitations
Like many technical indicators, the Average Directional movement index indicator also has limitations it is a lagging indicator. The indicator performs well in trending markets however, it is prone to false signals during the ranging markets. This is because the signals occur too frequently leading to false signals. So, it is highly recommended to use the indicator in trending markets for best trading results.
The indicator works on all intraday chart time frames and on the daily, weekly, and monthly charts. However, the indicator has a low success rate in lower chart time frames as the trading signals on a higher time frame chart tends to be more stable and tend to stay for longer periods. So traders could identify the trend using higher time frame charts and enter in a lower time frame chart in the direction of a higher time frame. The purpose of lower tine frames should be restricted to identifying entry points.
Conclusion
The Average directional movement index is an essential trend strength indicator tool that needs to be understood before applying to live trading conditions. The indicator may not be used as a stand-alone indicator but should be used in confluence with other technical indicators and tools for best results. Support and resistance lines, channel lines, and chart patterns are a few more technical tools that can be used by traders for additional confirmation. Though the indicator originated long back it still finds its way into most successful technical traders.