
Ever looked at your chart and wondered why your indicators give mixed signals? The TDI indicator was created to solve that confusion. Many traders rely on multiple tools but still struggle to read trend direction clearly, especially in choppy markets. The Traders Dynamic Index (TDI) combines the relative strength index, Bollinger Bands , and moving averages into one versatile indicator. Instead of switching between several tools, you can read price, momentum, and volatility in one window. This complex indicator simplifies analysis by showing where the green and red lines cross, giving clear trade signals.
Think of the Traders Dynamic Index TDI as your all-in-one guide through unstable market conditions. The yellow line, red line, and green RSI line help identify when to stay patient or when price line crosses show new momentum forming. When you understand how each signal line behaves, you’ll see how this single indicator can bring structure and confidence to your trading strategy.
What is the Traders Dynamic Index (TDI)?
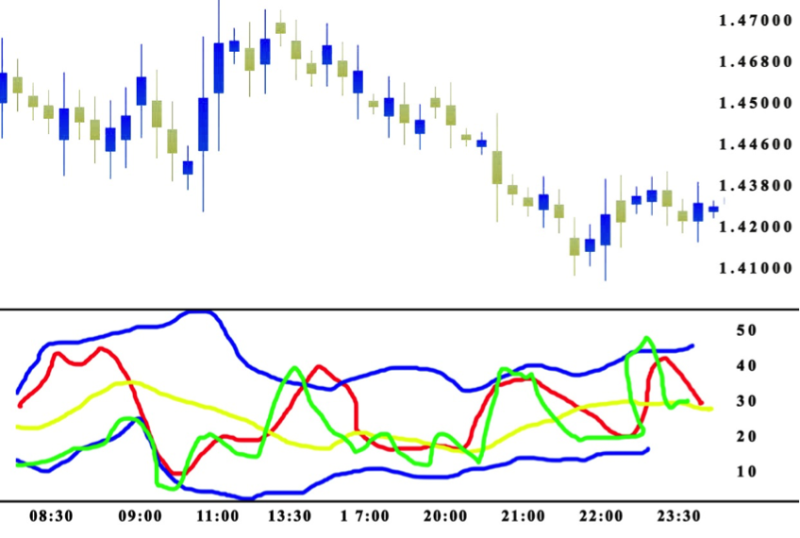
The Traders Dynamic Index (TDI) is a unique indicator that helps traders read the market with greater confidence. It combines several tools into one: the Relative Strength Index , moving averages, and Bollinger Bands. This versatile indicator turns complex signals into a visual story of price, trend, and momentum. Inside the chart, the green and red lines move like a heartbeat, showing the rhythm of market conditions. When the Price Line crosses key levels, it hints at possible trade signals forming. The blue lines, known as volatility bands, tighten during calm periods and expand during high volatility . A squeeze in these volatility bands often means a breakout is near, as the green line and red line move outside the bands.
At its core, the Traders Dynamic Index TDI is about structure and timing. The Price Line, also called the RSI line, measures the momentum and speed of price changes. The Trade Signal Line is a moving average that smooths the Price Line, filtering out noise from unstable market conditions. The Market Base Line, or yellow line, shows the long-term trend direction of the market. When the Price Line crosses above the yellow line, it signals strength. When it dips below, it hints at weakness. This balance of lines allows traders to confirm trade signals clearly and reduce confusion during short-term trading. The TDI indicator may look detailed, but its story is simple, it helps you read the market before it moves.
Practical Remarks about TDI
It is a complex set of lines, but that should not scare traders from using the indicator because every signal gets read in the standard way, making it useful for beginners.
It is advisable to use the indicator on stocks with durable volatility.
The Traders Dynamic Index indicator is productive when used separately for market analysis and can get used in combination with other technical indicators creating a reliable trading system.
How the TDI Offers a Wider Market Perspective
Many traders look at price alone and miss the wider market story. The TDI indicator brings everything together by showing how lines move with momentum, volatility, and trend direction. It helps traders read the full chart, not just react to what the price does at the moment.
- Trend Direction: The market base line shows the bigger trend. When the price line crosses above it, it hints at strength. When it falls below, it shows weakness and possible reversal in the market.
- Volatility Awareness: The volatility bands expand when volatility increases and tighten when it drops. If the price line crosses outside, it signals strong market pressure or potential breakout.
- Momentum Confirmation: The green and red lines represent momentum shifts. Their crossing forms a signal line or trade signal line that marks a buy signal or potential enter short setup. The yellow line smooths the movement, reducing false signals and helping the trader stay aligned with real market direction.
The TDI indicator combines these insights to give a broader understanding of trading conditions. It lets traders balance trend, volatility, and momentum to create better strategy and avoid emotional mistakes. By learning how each of these lines interact, traders can build more confident, consistent, and profitable trading habits in any market environment.
TDI Indicator Configuration
Setting up the TDI is simple once you understand how its elements work together. Follow this step-by-step guide to configure it properly and avoid common limitations many traders face when starting out.
Step 1: Add the RSI foundation.
Open your chart and insert the Relative Strength Index (RSI) with a period of 13. This forms the price line, showing momentum strength across market swings. It’s the core of the TDI setup and helps you see how price crosses key levels during different market phases.
Step 2: Apply the moving averages.
Next, add two moving averages to the RSI, one fast and one slow. These become your green and red lines, which highlight short-term and long-term changes in market strength. Their crosses signal potential trend shifts and entry points for your strategy.
Step 3: Insert the market baseline.
Now, include a third moving average with a period of 34. This acts as your market baseline, smoothing out smaller fluctuations and helping you identify the long-term direction of the trend. Many traders use it to confirm strategy alignment before entering trades.
Step 4: Add the volatility bands.
Apply blue volatility bands around your RSI using Bollinger Bands settings with a period of 34 and a standard deviation of 1.618. These bands show when the market becomes active or quiet, helping you manage risks and spot breakout zones.
Step 5: Review and adjust settings.
Once the TDI is visible, review your lines and averages. Make sure they appear balanced and easy to read. You can adjust colors or thickness for better visibility. A clean setup helps you maintain control and focus on clear trade signals.
Step 6: Save your configuration.
Finally, save your TDI setup as a template in your trading platform. This ensures you can apply the same layout for future strategies, improving consistency. With proper configuration, you’ll read market crosses, profit opportunities, and trend behavior more confidently every session.
Optimizing RSI Period and Price Settings in TDI
The TDI indicator becomes more powerful when the RSI period and price settings are optimized to match your trading style. The RSI forms the foundation of this indicator, controlling how quickly the green line reacts to price changes. A shorter period gives faster signals, useful for active traders who need quick reactions, but it can also create noise. A longer period smooths the signal, filtering false triggers and helping traders focus on genuine market momentum. Finding the right balance between speed and stability takes testing and practice, but it’s key to consistent results.
Your Bollinger Bands also play a major role in refining your TDI indicator. These bands measure volatility and help define overbought or oversold conditions. Tight bands create more signals but can lead to overtrading, while wider bands slow reactions yet bring cleaner entries. The secret is to match your Bollinger Bands and RSI settings with the current market rhythm. When properly tuned, the TDI indicator becomes your reliable guide, offering clear signals that reflect real-time price movement and support stronger, more confident trading decisions.
Practical Remarks in Using the TDI Indicator
- Always treat the TDI as a guide, not a guarantee. It helps you read the market’s rhythm but cannot predict every move.
- Use higher timeframes to confirm your entries. This filters out noise from smaller charts and strengthens your overall trading confidence.
- Wait for clear line crosses before taking action. Patience ensures you catch valid setups instead of reacting to early, weak signals.
- Combine the TDI with other simple tools like support and resistance. It helps validate trades and reduces false confirmations.
- Avoid trading when the lines are tangled or flat. This usually happens during range-bound markets with no clear direction.
- Study how the TDI reacts during different market sessions. Each period shows unique momentum that affects signal reliability.
- Always backtest your setup before trading live. This builds trust in your strategy and helps you adjust your expectations early.
- Keep your chart clean and uncluttered. Simplicity allows you to focus on true signals and develop stronger reading accuracy over time.
- Remember that no indicator replaces discipline. A calm, consistent mindset is what truly turns a good signal into lasting profit.
How to Read Trading Signals from the Green Line
Start by watching the green line closely for quick momentum hints on your chart. It moves faster than the red and yellow lines, offering early signal clues. Use this early reading with confirmations before entering a trade.
- Identify direction.
Observe whether the green line is above or below the red line. When above, momentum favors buyers; when below, sellers lead. - Confirm with the yellow line.
Check the yellow line to confirm the trend’s longer-term direction. If the green line aligns above the yellow line, bias stays bullish. - Look for clean crosses.
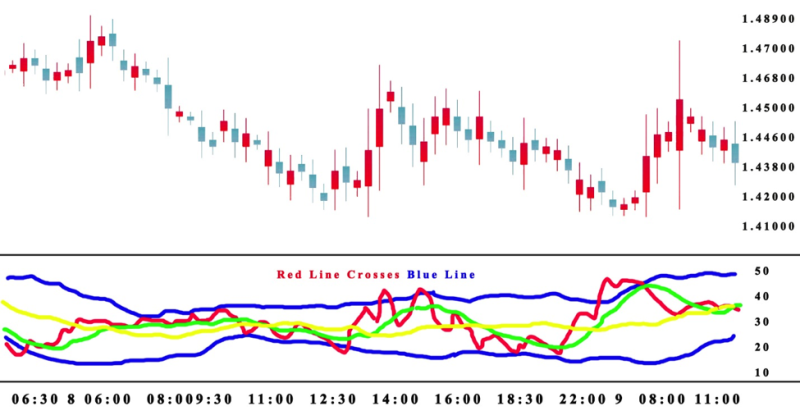
Prefer signals where the green line crosses the red line cleanly. Avoid weak, choppy crosses near the yellow line that often cause false signals. - Confirm with price action.
Confirm the green and red lines’ cross with price action on the chart. A clear candlestick close in the cross direction strengthens the signal. - Manage risk and position size.
Place your stop loss beyond recent support or resistance levels. Size your position so you can survive normal market swings and learn. - Plan your exit.
Consider exiting when the green line crosses back against your trade. Also watch the yellow line for trend shifts that demand closing positions.
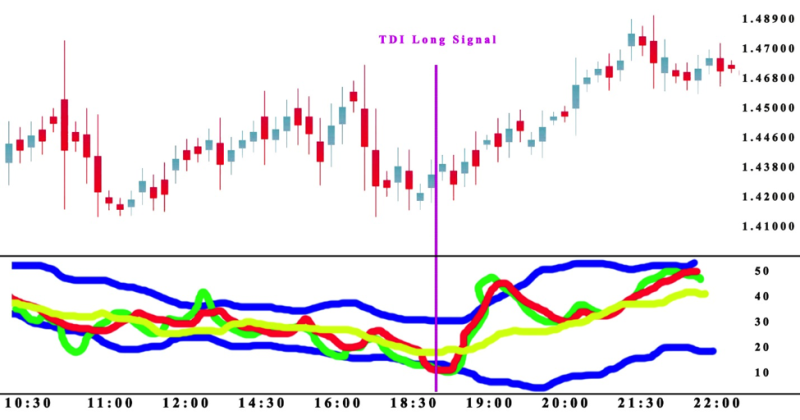
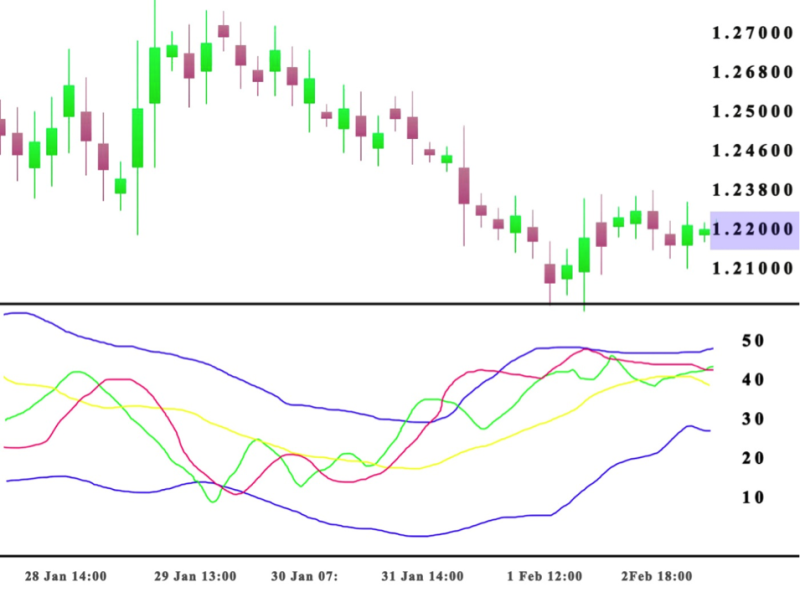
Traders can observe that following the trigger of the signal, the price climbs to a profitable level in the long position. What you want to avoid is a scenario where the red one crosses over the upper blue band.
The Best Traders Dynamic Index Strategy Explained
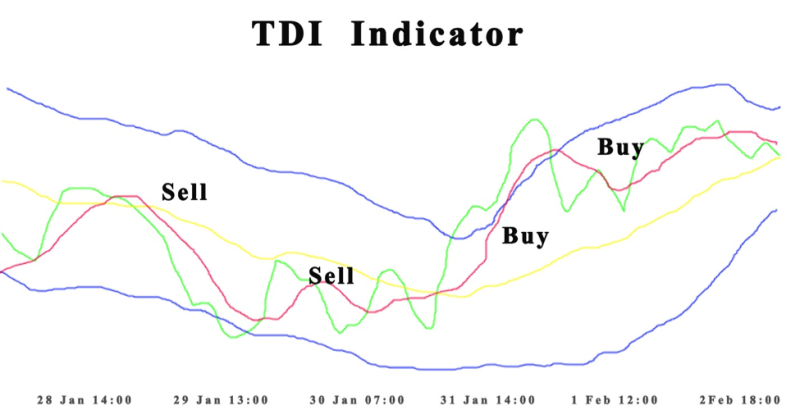
The best Traders Dynamic Index (TDI) strategy focuses on the balance between the green, red, and yellow lines. When the green line crosses above the red line, it signals potential upward momentum in the market. If this green line also stays above the yellow line, it confirms that the uptrend has strong support behind it. However, when the green line moves below both the red and yellow lines, it points to a possible downtrend forming. Traders should not rely on a single cross alone but confirm it with price movement and candle behavior. This helps avoid reacting to false signals that often appear in choppy or sideways markets. When applied with patience and discipline, this TDI indicator strategy helps traders spot clear setups and manage risks wisely.
How to Make the TDI Indicator More Sensitive
- Adjust for buying signals.
Scalpers look for the green line crossing the red line from bottom to top. The intersection should occur above the 50 balance line, and the yellow line must support an uptrend. - Adjust for selling signals.
For a sell setup, the green line crosses the red line from top to bottom. The intersection must happen below the 50 level, with the yellow line confirming a downtrend. - Simplify for market conditions.
Making the TDI indicator more sensitive helps match current market movements. Adjustments reduce noise and help traders focus on calculated signals rather than random fluctuations. - Use with caution and other tools.
Sensitivity has its limitations, especially in choppy or range-bound markets. Combining the TDI with other tools ensures account of risk and increases confidence in trade decisions. - Practice and fine-tune.
Regular observation and small adjustments build interest in learning the indicator’s nuances. Over time, this creates reliable setups and improves calculated entries for stronger trading results.
Also Read: Best Technical Indicators for Day Trading
Conclusion
The TDI indicator is a versatile tool that combines trend, momentum, and volatility into one clear visual guide. It helps traders see the full market picture, rather than reacting to random price movements. By understanding the green, red, and yellow lines, you can read signals, spot trends, and confirm setups with greater confidence. Proper configuration, optimized RSI periods, and careful observation of line crosses make this indicator a practical ally for both scalping and swing trading.
Using the TDI effectively requires patience, discipline, and consistent practice. You must respect its limitations while integrating other simple tools for confirmation. Adjusting sensitivity and reading signals carefully helps reduce false signals and manage risk in different market conditions. Over time, mastering this indicator allows traders to make informed, calculated decisions and improve trading consistency, turning a complex tool into a simple, reliable guide for profitable strategy execution.
FAQ's
1. What is the Traders Dynamic Index (TDI)?
The TDI is an indicator that combines trend, momentum, and volatility into one visual tool for trading.
2. What do the green and red lines represent?
The green line shows short-term momentum, while the red line smooths it into a longer-term trend signal.
3. What is the yellow line in TDI?
The yellow line acts as a market baseline, helping traders confirm the overall trend direction before entering trades.
4. What does it mean when the price is in oversold condition?
Oversold occurs when the price line is low relative to its normal range, hinting the market may bounce soon.


