Bollinger Bands’ Application in Forex
Forex trading is one of the most lucrative trading markets. Some go as far as to say that it is more active than the stock market itself. It involves exploiting the slightest fluctuation in the exchange rate by purchasing or selling currency to generate a profit. This is where the Bollinger Bands forex application comes into play. Sure, it is not the only tool that traders use to work with the market, but it is easy to use and effective, especially when you use other indicators alongside them.
Contents
- Bollinger Bands Explained
- Bollinger Bands Tutorial
- Bollinger Band Trading Rules
- Mastering Bollinger Bands Forex Application
- The Bollinger Bounce
- Pros and cons
- Analysis
- The Bollinger Squeeze
- Bollinger Bands and RSI
- Conclusion
- Infographic
Bollinger Bands Explained
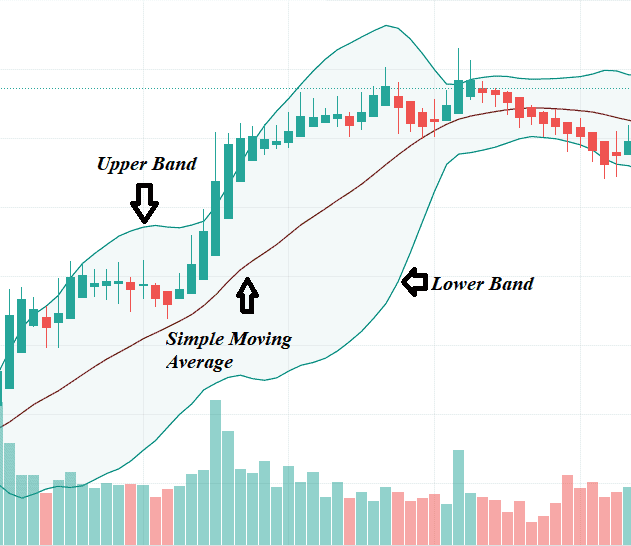
The name Bollinger Bands came from John Bollinger, the creator of this amazing tool. In a chart, you can enable the Bollinger Bands overlay which will create a zone covering the price action trading bars. With this, we have three distinctive lines to look for, and a few technical terms to understand.
The upper line is the upper band and the lower line is the lower band. The middle line is the simple moving average (SMA). The area from the SMA to the upper and lower band is the standard deviation (SD). Finally, you have the bandwidth, which is the distance between the top and bottom band.
Another thing to look out for is the volatility of the market. A market’s volatility depends on the bandwidth of the bands. The larger the bandwidth, the more volatile the market is. However, traders tend to look for low volatility, which is lower or narrower bandwidth, which is a sign of an explosive trend either upward or downward.
Finally, Bollinger Bands are most effective when you use it with other indicators such as ATR Indicator, Trendline Trading or Doji Candle. The bands alone do not tell the whole story, but they do give valuable information.
Bollinger Bands Tutorial
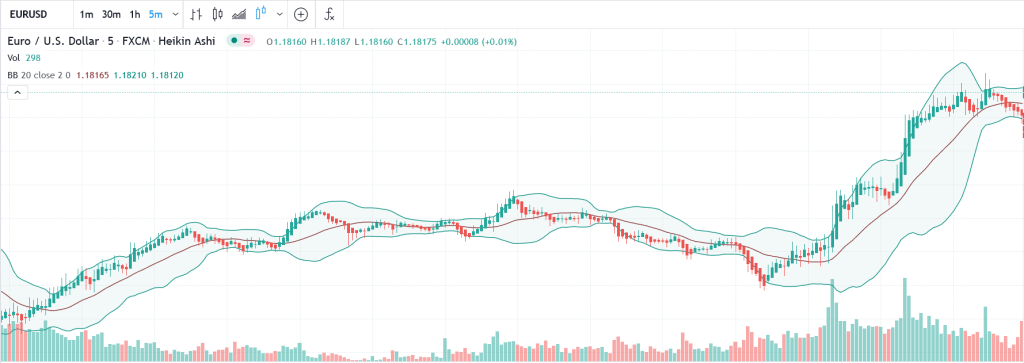
Using the Bollinger Bands overlay, you can see three lines in addition to all the red and green candlesticks, as pictured below.
Most charting programs have a default setting. That is 20-period and 2 SD. These are usable, although they are nothing more than default values. Aspiring traders can work with the default values. As you gain more experience, consider tweaking with the settings.
As mentioned before, the standard deviation is the area from the SMA to the upper/lower band. A more technical term is that the SD is a measurement of prices movement. With SD set to 1, it covers about 68% of the price moves between the upper and lower bands. Having SD at 2 covers 95% of the price moves.
Again, you can experiment with standard deviations once you get the hang of using the Bollinger Bands. There are a few more concepts to cover such as the Bollinger Bounce and the Bollinger Squeeze. Both of which will be discussed later.
Bollinger Band Trading Rules
John Bollinger himself put together some rules on how you can use the Bollinger Bands to help traders. Of course, the versatility of Bollinger Bands is undeniable, but these rules should serve as a starting point. These rules are:
-
Bollinger Bands give you a visual of relative price moves, of highs and lows. The upper band indicates a higher price and the bottom band indicates a lower price. You can use these highs and lows to compare indicator action and price action to help you decide whether to buy/sell. Bollinger Bands are applicable in forex, equities, futures, bonds, etc.
-
Indicators can be derived from volume, sentiment, open interest, inter-market data, momentum, etc. However, if you use more than one indicator, make sure to use different ones and that they do not relate to each other directly. For example, you can use a volume indicator with a momentum indicator, but not two volume indicators at the same time.
-
Bollinger Bands make it easy to identify patterns such as W bottoms, or M tops.
-
Tags of the bands are just tags, not signals. The tag at the upper band is not a sell signal in itself. Conversely, the tag at the bottom of the band is not a buy signal either.
-
A trending market may have its price hiking up and down the band.
-
Closes outside the bands are not reversal signals. They are continuation signals.
-
The default value for the moving average is 20, and 2 for the standard deviation. These are just default values. Experiment and see what works for you. For a more consistent price containment, consider tweaking the standard deviation. If the average is lengthened, then increase the standard deviation. For example, the default is 2 standard deviation at 20 periods, so increase it to 2.1 and 50, respectively. On the other hand, if the average is shortened, decrease the standard deviation down to 1.9 at 10 periods, for example.
-
The middle line, which is the moving average between the upper and lower band, should be descriptive of the trend in the intermediate-term.
-
Simple moving average is used to calculate the standard deviation calculation.
-
Large price changes exiting the back of the calculation window may cause a sudden change in bandwidth. To eliminate this, use exponential Bollinger Bands. Exponential averages need to be used for both the standard deviation and the middle band.
-
Bollinger Bands %b is versatile as you can use it to identify divergences, patterns, etc.
-
Do not use the standard deviation calculation of the bands to make statistical assumptions. The distribution of price is non-normal and the use of the bands normally takes from a very small sample size.
-
The Bandwidth also has many uses. For one, it tells us how wide the bands are, which may indicate a breakout when the bands are narrow, which is the most common use. It also helps identify trend changes.
-
Since Bollinger Bands can be used on bars of any length, such as weekly, daily, hourly, or even every 5 minutes, the bars need to contain enough activity so that you would have a picture of the price-formation mechanism at play.
-
Finally, Bollinger Bands should not be used for continuous advice. Again, they are most effective when you use it in conjunction with other indicators. That way, you can identify the moment when you should buy or sell and turn a profit.
Mastering Bollinger Bands Forex Application
The end goal is to make a profit. To achieve this, you buy low and sell high. The only problem is that it’s never that simple, especially in forex. Traders developed many forex trading strategies to utilize Bollinger Bands to their maximum potential, some of which we will discuss here.
The Bollinger Bounce
The SMA is there for a very good reason. It tells us where the prices tend to normalize. This phenomenon is known as the Bollinger Bounce. If the price goes up above the middle line, it will eventually come down to meet that line. The reverse is also true. If the price goes down below the line, it will bounce back up to the SMA line.
Many traders have developed various systems that would allow them to profit on such bounces. Such systems are most effective when the market is ranging and there is no clear trend. In other words, you only want to utilize this system when the price is trendless. If the width between the top and bottom band (bandwidth) is growing larger, you are looking at a trend. Trading the Bollinger Bounce works best when the bandwidth is stable or contracting.
Here’s how to apply it.
Step 1: Currency Must Touch any of the Bollinger band
Take a look at how price has or has not been respecting the upper or lower band. If price was seen to respect the band, get ready to plan for an entry with price action. As for the middle band, we would typically wait for a break of off it or a rejection bounce and get ready for entry based on price action.
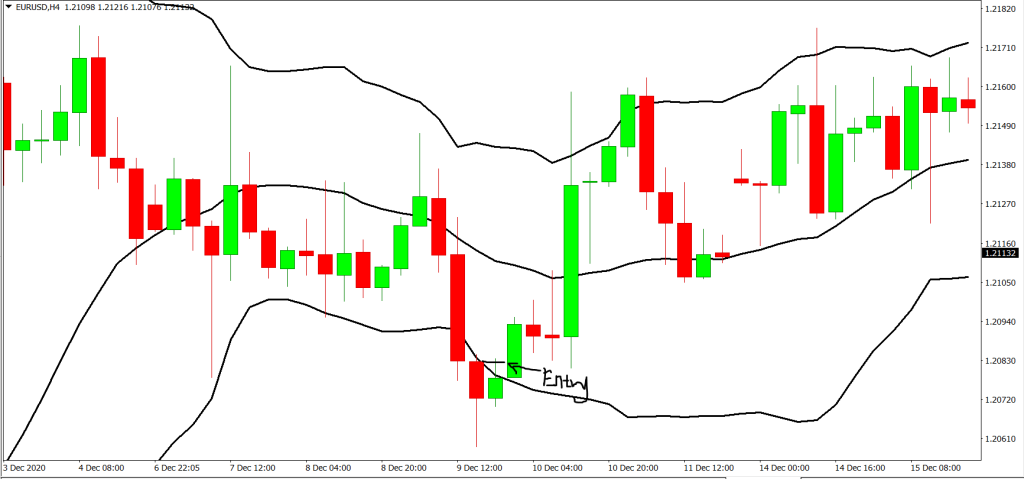
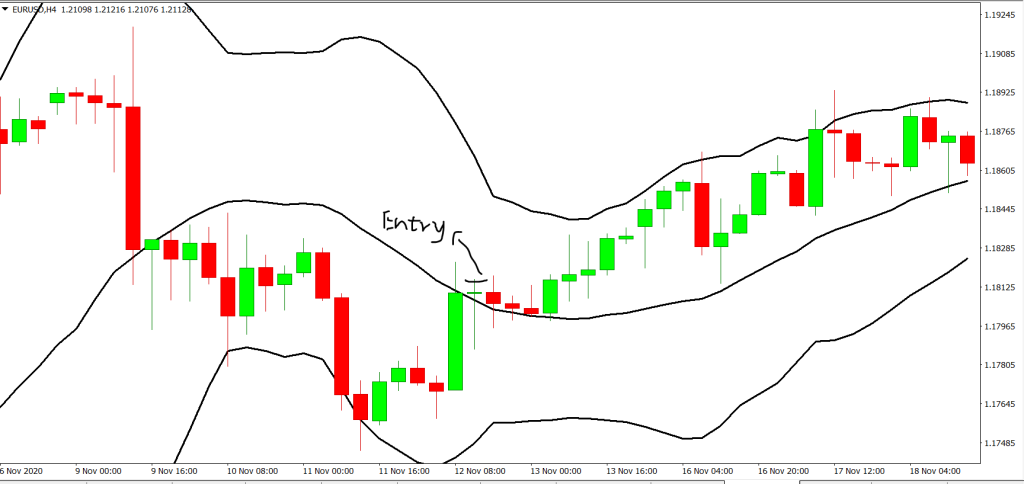
Step 2: Making an Entry
An entry for long can be taken when the price is seen to touch the lower band in a bearish movement and forms the next bar bullish. We can then go for an entry slightly above the high of the bull candle.
Also, we can enter long when prices hit the middle Bollinger from a bearish rejection from the top band and the next candle is bullish. A bounce has occurred and an entry on the high of the bullish candle can be taken
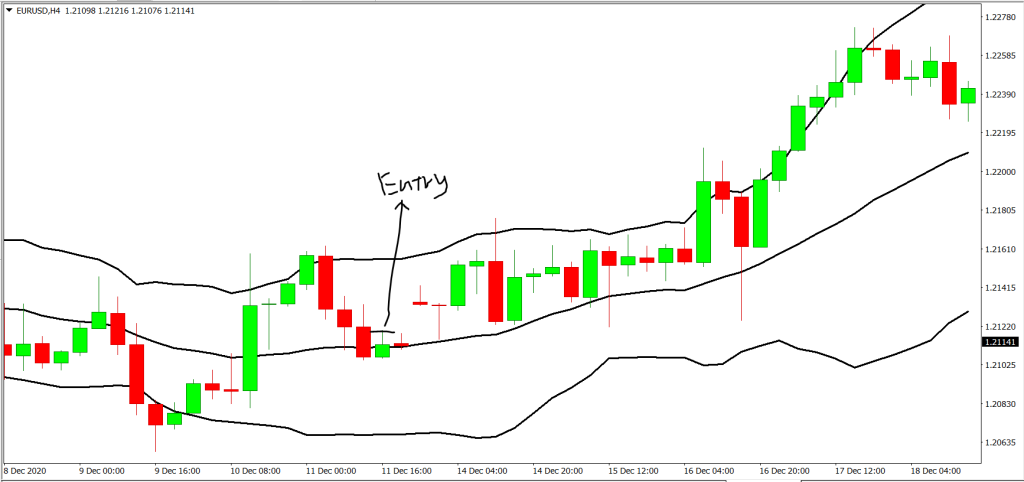
Subsequently, a long entry can be taken when prices break the middle band. When that happens an entry can then be placed on the high of the breaking candle as well.
The opposite is true for shorting the market.
However, it is important to take in the account the risk to reward ratio in the trade. If the entry candle is too big, it will render the risk reward to be smaller. Thus, a reasonable ratio must be seen before taking the trade.
Step 5: Stop Loss or Take Profit Target
For the take profit we can aim to take full profit at the next band that price is approaching.
As for the stop loss we can simply put it slightly below the lows of the entry bar that we took.
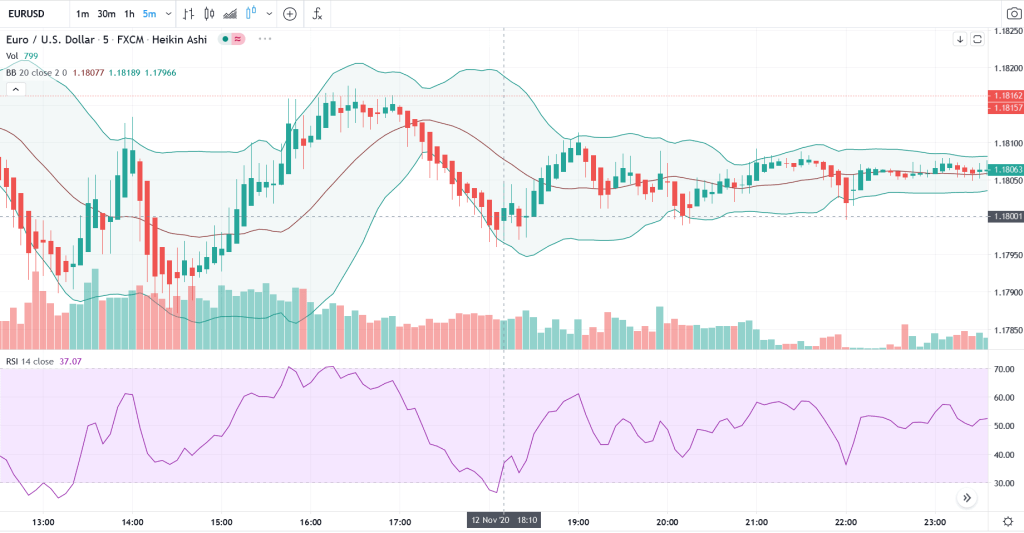
Step 3: Use the RSI Indicator
When you see that the price hits the lower band, look at the RSI. You need it to be between 30 to 50, and also in the direction of the trade. In the picture below, the RSI is the purple zone. You can see that the RSI line is between 30 to 50 and is going upward and that the price reached its lowest low, touching the bottom band. This a good time to make an entry.
Alternatively, if you are looking to sell, do the reverse. Look for a downward trend, with the price touching the upper band, with the RSI pointing downward and value between 50 to 70.
Step 4: Making an Entry
If you are buying, make sure that there is an upward trend before making an entry. If the candles keep moving downward and hitting new lows, wait. Do not make an entry.
Step 5: Stop Loss or Take Profit Target
Make sure to have a stop loss and have a good target area. Using the above strategy, you should be using a 30-50 pip stop.
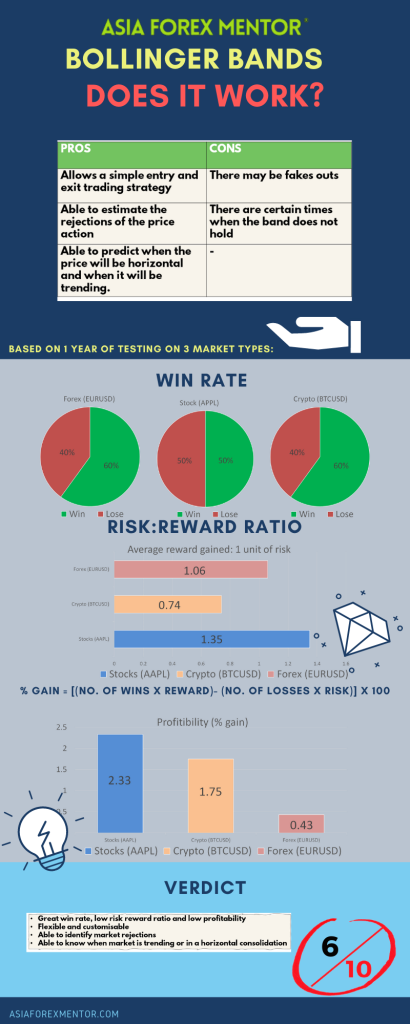
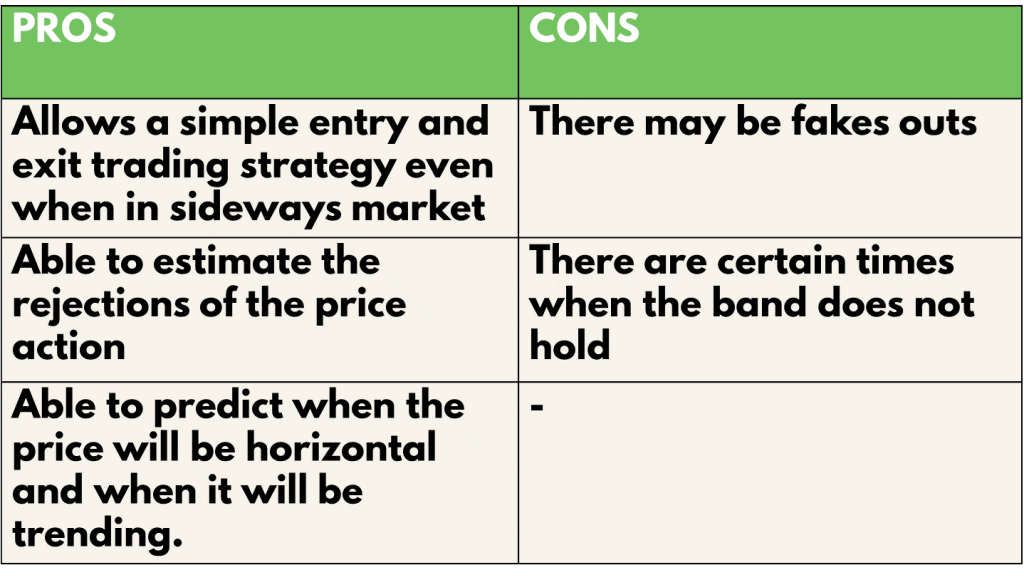
Pros and cons
The Bollinger bands bounce strategy gives a simple way to enter and exit the market regardless of if it is trending or sideways. On top of that it gives you the ability to predict the rejections of the price action with the bands as support and resistance. Furthermore, you can tell the type of market, trending or horizontal, just based on the bandwidth of the Bollinger bands. Lastly not to mention that it is highly customisable as well to different trading styles. However, just like any other indicator, it is prone to fake outs to a certain extent such as when the band does not hold the price. This will be a common scenario especially when the Bollinger band expands into a potential break out.
Analysis
To find out the profitability of the Bollinger bands strategy, we decided to do a back test based on the past 10 trades from 30 Apr 21 on the H4 timeframe. The rules for entry will be the same as what was mentioned above. We will be back testing this throughout 3 types of trading vehicles, namely, EURUSD for forex, AAPL for stocks and BTCUSD for cryptocurrency. For simplicity, we will assume that all trades taken have a risk of 1% of the account.
Definitions: Avg Risk reward ratio= ( Total risk reward ratio of winning trades/ total no. of wins)
Profitability (% gain)= (no. of wins* reward)- (no of losses* 1) [ Risk is 1%]
An example of the application of the strategy:
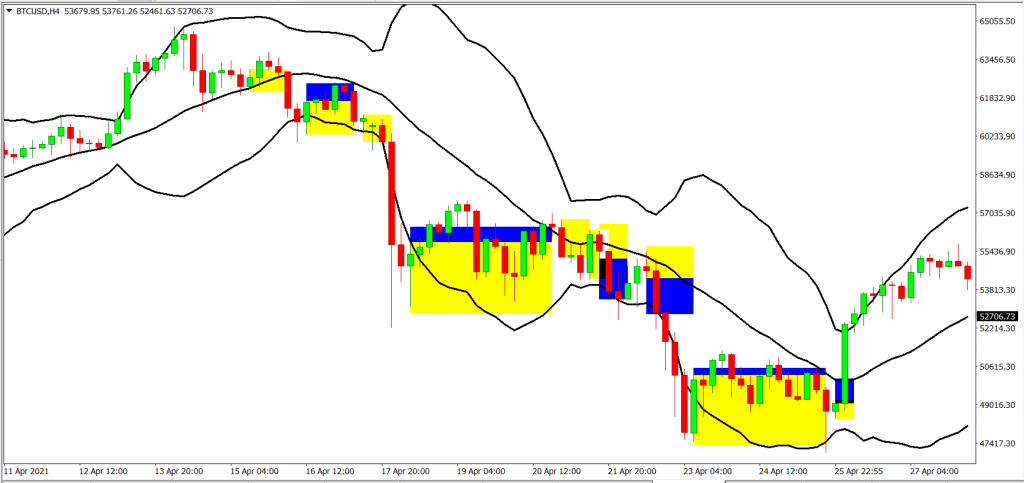
For the Backtest results, trades with blue and yellow zones indicate an overall win with the blue zone as reward and the yellow zone as the risk taken.
As shown in our backtest, the win rate of this strategy for EURUSD (Forex) is 60%, AAPL (Stocks) is 50% and BTC (Crypto) is 60%
The average risk reward ratio of this strategy for EURUSD (Forex) is 1.055, AAPL (Stocks) is 1.35 and BTC (Crypto) is 0.738.
The profitability of this strategy for EURUSD (Forex) is 2.33, AAPL (Stocks) is 1.75 and BTC (Crypto) is 0.428.
The Bollinger Squeeze
This is self-explanatory. When the bandwidth gets smaller, that is when the top and bottom bands squeeze together, which means a breakout is imminent. Look at the candle. If it pokes out above the top band, then expect to see an upward trend. If the candle pokes through the bottom band, then a downward trend is about to happen.
Long periods of a squeeze as pictured above tend to lead to an explosive breakout. This system allows you to spot a move as early as possible. These things do not occur frequently, but with a 15-minute chart, you could spot them at least a few times per week.
Forex is a volatile market, and volatility is fluctuating. That means, you need to work with the trend. Many novice traders do not know how to measure the volatility of a market. However, Bollinger Bands make it a simple process: just look at the bandwidth. In this case, you want to look for narrow bandwidth, which is an indication that a breakout is imminent.
A breakout tends to occur after a period of low volatility. The longer it is, the stronger the breakout. However, the bandwidth does not tell you about the direction of the breakout. It is either up or down, so how can you tell? Look at the trend. If the trend has been down for quite some time, then the breakout might push it even lower.
Bollinger Bands and RSI
While the Bollinger Bands help identify areas of value, they do not tell you the strength or weakness behind the price move. With the bands alone, there is no way of telling whether the market will continue to trade outside of the outer bands or mean revert.
As mentioned before, Bollinger Bands work best with another indicator. This strategy utilizes a tool in the Bollinger Bounce strategy: The RSI. Here, you are looking for divergence on the RSI indicator. It can go two ways.
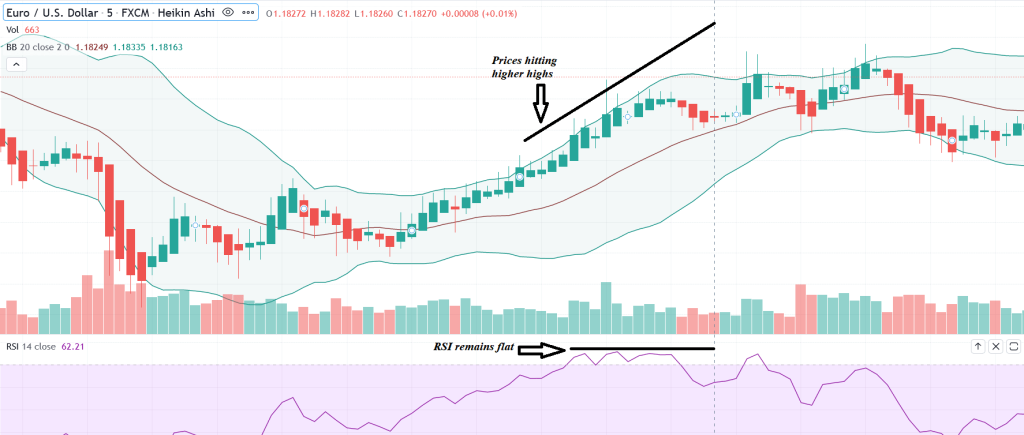
A bearish divergence is when there is a sign of weakness. This is indicated by the prices keep making higher highs, but the RSI indicator do not. If you were to draw a line connecting the higher highs of prices, it forms an upward slope, but it will show a downward slope or a flat line on the RSI indicator.
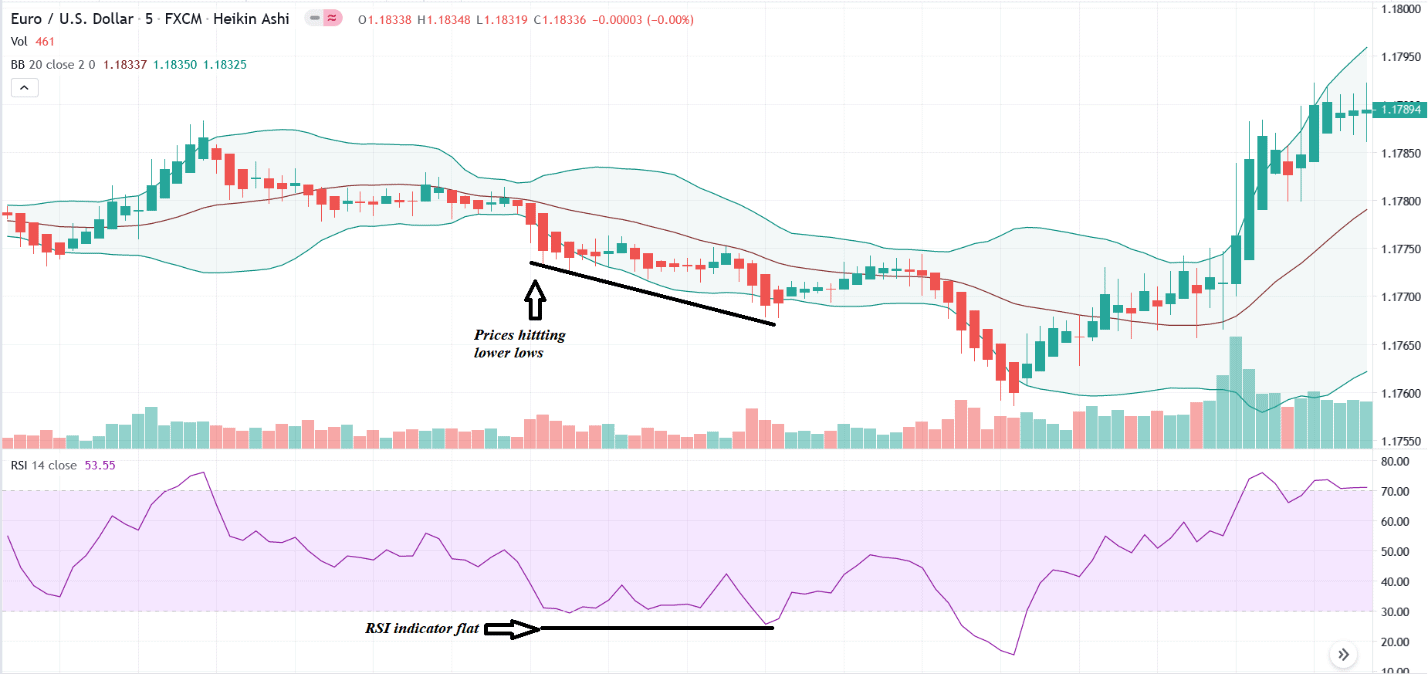
A bullish divergence is when there is a sign of strength. This is indicated by the price making lower lows but not the RSI. Again, if you draw a line, you can see the prices forming a downward slope, but the RSI will show an upward slope or a flat line.
In other words, if the RSI indicator does not follow the prices slope, it’s a divergence.
That said, how do you use Bollinger Bands with RSI? If the candles are trailing at the upper band, look for a bearish RSI divergence that indicates weakness in the move. Alternatively, if the candles are at the lower band, look for a bullish RSI divergence that indicates strength in the moves.
Below is an example of a bearish divergence, with prices hitting higher highs but the RSI indicator does not reflect that, which shows a weak momentum.
Here’s an example of a bullish divergence. Prices consistently hit lower lows, but the RSI indicator shows a relatively flat line.
Traditionally, if the RSI value is 70 or above, it indicates that the security is overvalued or overbought, which may result in a trend reversal or corrective pullback in price. Alternatively, an RSI value of 30 or below may indicate an oversold or undervalued condition.
Conclusion
In conclusion, the Bollinger bands gave an overall excellent win rate but poor risk to reward ratio and hence to be concluded non profitable in the long run. The low risk to reward ratio is due to the tightness in profit taking levels from one band to another. However, this can be improved by using other indicators along side the Bollinger bands to minimise risk so as to maximise capital gains. Furthermore, this set of strategy generates more trades than average in a certain period. By using other indicators, the number of trades can be filtered greatly resulting in the taking of better quality trades.
Infographic