Doji Candle
The success of a trader depends on his ability to understand the current market sentiment and also the projected market direction. The Doji candle is one of the most important price action trading candlesticks which depicts the current market perspective and provides vital directional clues when combined with other indicators. Every trader will very much appreciate the importance of early warning signals during the end of a current trend or the beginning of a new one, Doji plays a crucial role in delivering that early warning signal.
Contents
- Candlesticks and Patterns
- Doji Candle Meaning
- Doji – Important Signal to traders
- Types of Doji
- 2 Doji Candlesticks in a row
- Bullish Doji Candle and Bearish Doji Candle
- Limitations
- Conclusion
Candlesticks and Patterns:
Though candlesticks were used by Japanese rice traders hundreds of years ago, most traders in the modern-day use candlestick charts for technical analysis. Candlestick formations provide a clear image of the underlying market sentiment of the trading instrument, while the wicks and the body of the candlesticks provide a better visual representation of the prices. The formation pattern of every candlestick is equally important as the pattern formed by a group of candlesticks.
Doji Candle Meaning:
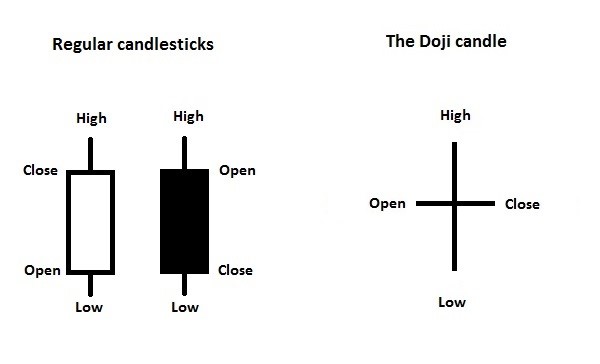
In Japanese, “doji” means blunder or mistake, because the open and close price are exactly the same. The Doji candle is commonly seen in the charts as shown in Picture A, representing a ” + sign ” the Doji candle is unique in its formation and is easy to spot. The regular candlesticks have a body that provides the price movements of the trading instrument within a given time frame. The length of the body of the candle shows the difference between the opening and closing prices. Doji candlesticks don't have a body since the opening price and closing prices were the same, though the price fluctuated during the period and reached a high and low price.
Doji – Important Signal to traders :
A Doji shows indecision in the market sentiment. Traders can understand the market sentiment of the buyers and sellers, by looking at the structure of the Doji candle. The buyers pushed the prices higher but weren't successful and prices fell back, the sellers pushed the prices lower but weren't successful either. The prices closed at the same value as the opening prices.
Indecision in market sentiment can signal either a pause of the current trend or a reversal of the current trend. Either way, it provides an important clue to the trader. If the trader is already holding a position it signals that the current trend is exhausted and the market may continue the trend later if more buyers and sellers enter the market, in this case, the trader manages the existing position by booking the profits or partial profits.
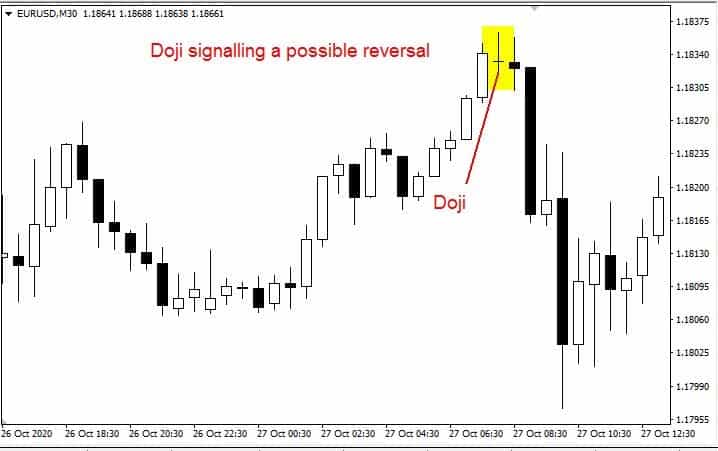
The formation of a Doji also signals that since the current trend is exhausted the prices may reverse the direction of the current trend. The trader can look for additional confirmations for an opportunity to take a new trade in the direction of the price reversal. Doji forms in almost all the timeframes and can be traded in all timeframes.
Types of Doji :
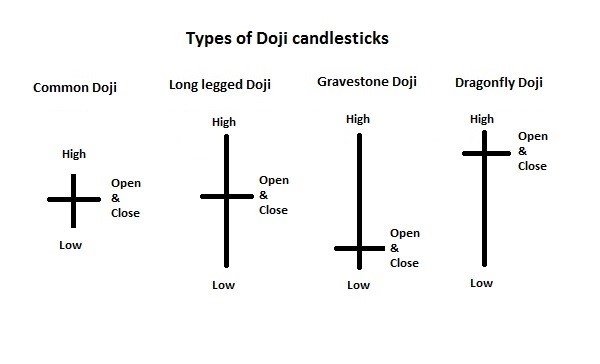
The Doji candle opens and closes at the same price, but depending upon whether the open & close price is located near the high or low of the candle, the Doji can be further classified as Common Doji, Long-Legged Doji, Gravestone Doji, and Dragonfly Doji. Picture C shows very clearly the ability of the Doji to reflect the strength and weakness of the buyers and sellers and in turn to provide valuable insight to the trader about the prevailing momentum of the prices of the trading instrument.
1. Common Doji:
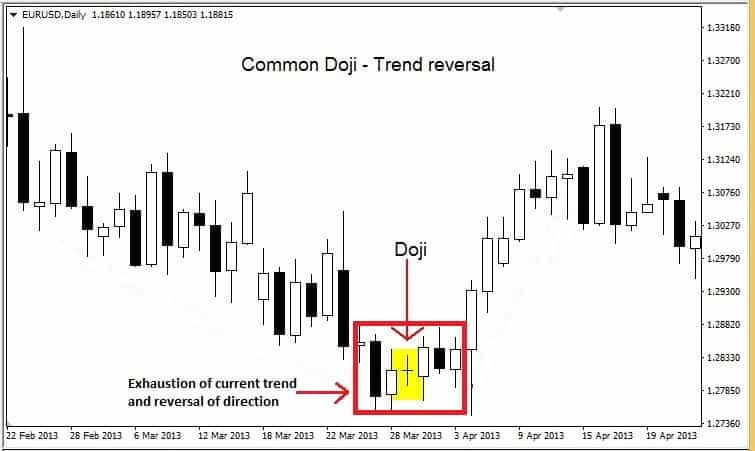
Picture D shows EURUSD daily chart, the prices were in a downtrend and started to consolidate, in the middle of the consolidation period formed a Doji candlestick. The formation of Doji in the middle of the consolidation period represented the indecision of the buyers and sellers and reflected the market sentiment, this would have provided the necessary early warning signal for the trader to protect his existing position.
In the subsequent candles after the Doji had formed, we see buyers entering the market and taking the prices higher, and reversing the trend direction. Having spotted the Doji and the subsequent bullish candles setup with confirmation of other technical indicators or patterns, the trader may decide to enter a new trade in the direction of the reversal.
A common Doji cannot be traded independently, it's only traded in the combination of other signals and indicators such as ATR indicator, RSI Forex Indicator, Bollinger bands forex, Trendline trading, Support and Resistance forex and more.
2. Long-Legged Doji:
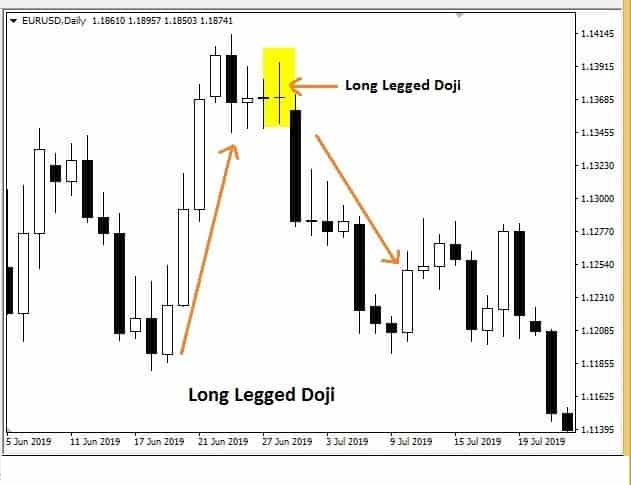
Picture E shows a EURUSD daily chart, here we can spot a Doji with a different shape than the common Doji. The Doji has a longer wick which indicates the occurrence of a larger price fluctuation during the period of the candle. The distance between the open & close price and highest price and the lowest prices were large which in turn shows a longer wick
Long-Legged Doji provides additional information to the trader than the common Doji. Long-Legged Doji not only provides trend exhaustion and potential reversal signal but also provides additional information that the prices fluctuated to a larger degree which implies the presence of volatility. This additional information enables the trader to take the necessary steps to his exit or entry plan while keeping volatility in mind. Like the common Doji, the Long-Legged Doji cannot be traded independently but should be combined with other indicators.
3. Gravestone Doji Candle:
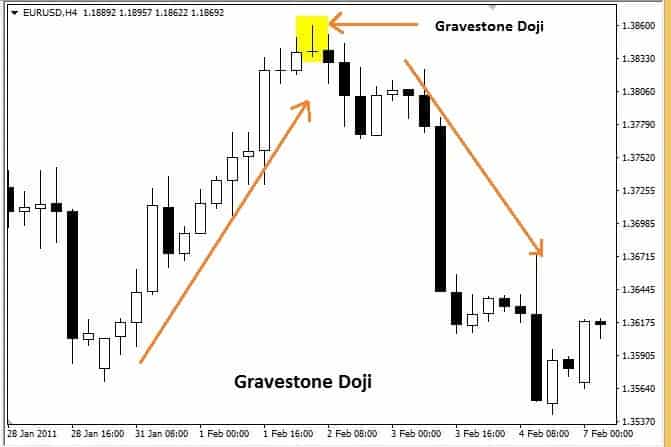
Picture F shows a EURUSD H4 chart with Gravestone Doji formation. The distance between the open & close and the high is at least 3 times longer than the distance between the open & close and the low.
During this Gravestone Doji candle, the Doji displays its ability to provide additional information to the trader. In Picture F, the buyers were able to take the prices higher from the opening price. However, due to a lack of buying momentum, the prices failed to move higher and the sellers were successful in bringing back the prices lower and closed the candle very near to the low, leaving a long wick to the upside and a very smaller wick to the downside. This reflects the underlying strength of the sellers. The Gravestone Doji signaled the trader to consider a potential move to the downside rather than the upside.
Trading method:
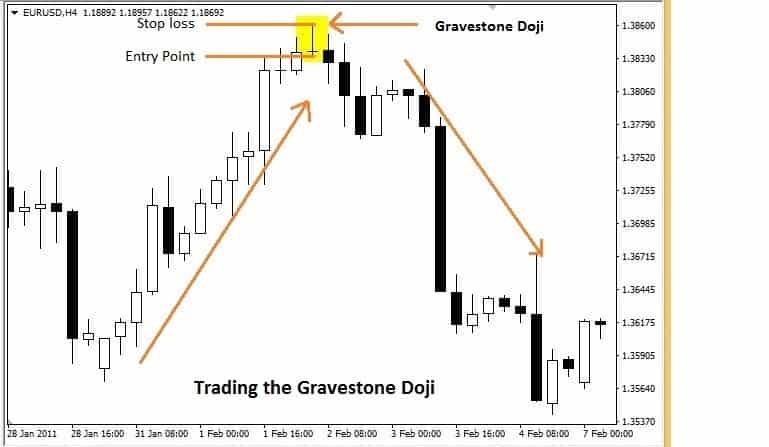
The trading method considers the high and the low of the Gravestone Doji. Once the next candle of the Doji breaks the low of the Doji we can enter the markets and place our stops a few pips above the high of the Doji. It is at the trader's discretion to place an additional buffer of 10 pips above the stop loss, however, the buffer can be lower in smaller timeframes. The take profit can be decided as per the trading plan of the trader.
4. Dragonfly Doji Candle:
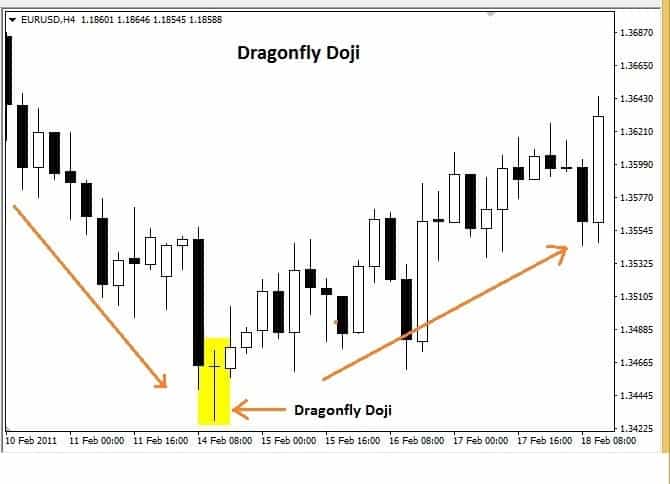
Picture H shows a Dragonfly Doji in the EURUSD H4 chart. It's the opposite of the Gravestone Doji, with a longer wick towards the downside.
In Picture H, the EURUSD prices were in a downtrend and then reversed the direction of the trend after the Dragonfly Doji. The underlying market sentiment can be understood by the length of the wick towards the downside. Prices continued to move lower during the downtrend, however, buyers entered the market and pulled the prices higher, and reversed the direction. The price fluctuations during the candle reflected the underlying weakness of the buyers and the strength of the sellers. The Dragonfly Doji provides the trader to warn about the waning buying momentum and the growing strength of the sellers.
Trading method:
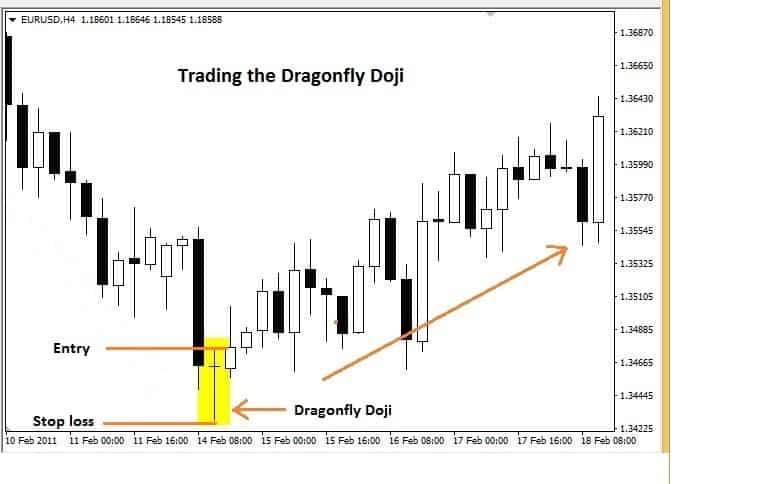
Trading of Dragonfly is similar to trading the Gravestone Doji except it's the opposite. The trade can be entered once the high of the Doji is broken by the next candle. The stops can be placed at the low of the Doji, profits can be booked at the discretion of the trader.
2 Doji Candlesticks in a row:
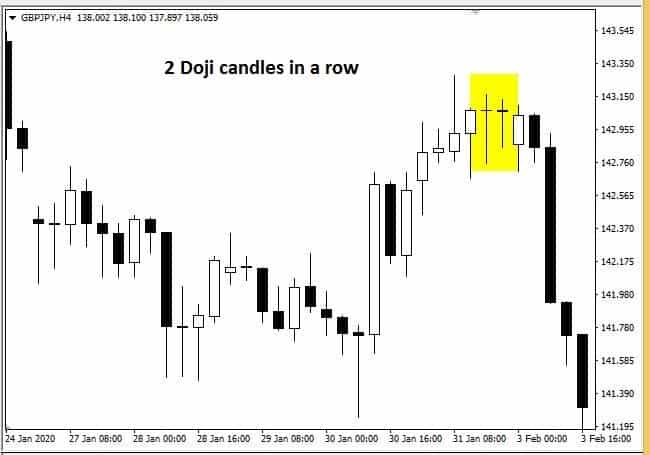
The above picture shows the H4 chart of GBPJPY displays an instance where 2 Doji candles are formed in a row. The Doji primarily shows indecision in the market sentiment, due to the sellers and buyers unable to win over each other. The extension of this condition for an extended period shows the market players seriously looking for a trend direction, but once the market decides the direction the move is not only quick but also significant.
Traders look for market sentiments continuously, if the Doji shows up twice in a row it provides an excellent opportunity to look for trade with a good risk reward ratio.
Trading method:
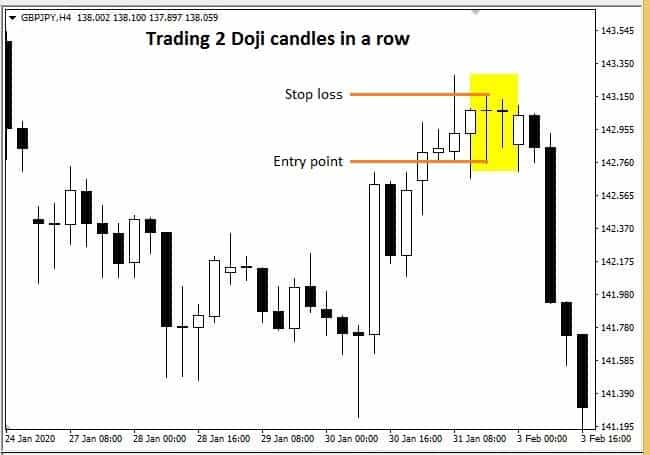
If 2 Doji candles form subsequently then the larger candle is used to calculate the entry point and stop loss. If the Doji forms in a bearish scenario the entry point is confirmed once the price breaks below the low of the larger Doji and the stops are placed at the high of the larger Doji. The conditions are opposite in a bullish scenario.
Bullish Doji Candle and Bearish Doji Candle:
The Doji can provide future market direction based on the location of Doji in a chart pattern when combined with other candlesticks. There are 3 types of bullish and bearish patterns that form frequently and are tradeable.
1. Bullish Doji Pattern – Morning Star:
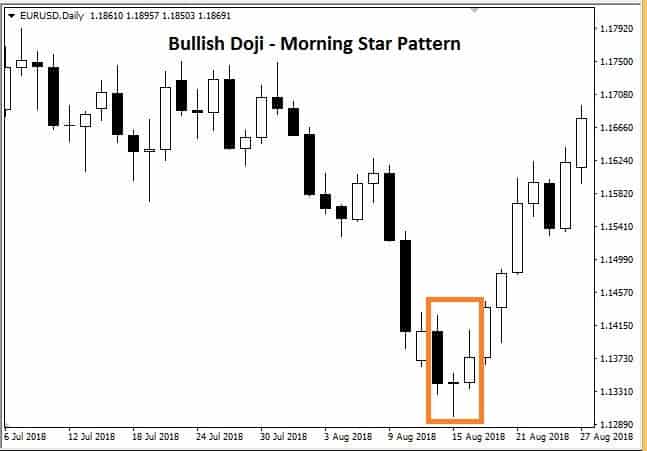
The Morning star pattern happens when the prices are in a downtrend, the pattern consists of 3 candles a down candle, Doji, and an up candle. In the picture, L prices continue to fall and sellers were in control until the Doji forms, the next candle turns bullish. The completion of this candle happens if the up candle closes more than half the size of the down candle.
Bullish Doji Pattern – Bullish Harami:
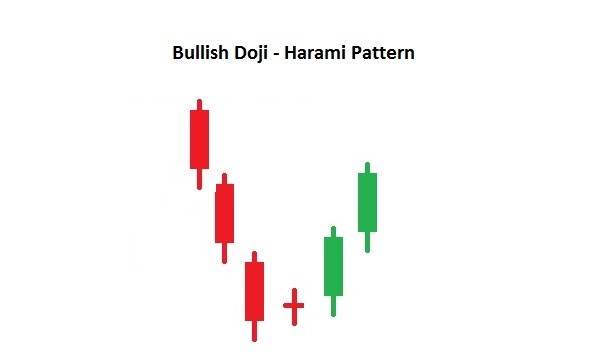
The Bullish Harami pattern can be seen in a downtrend. The pattern is confirmed if the Doji forms within the body of the previous down candle.
Bullish Doji Pattern – Bullish Abandoned Baby
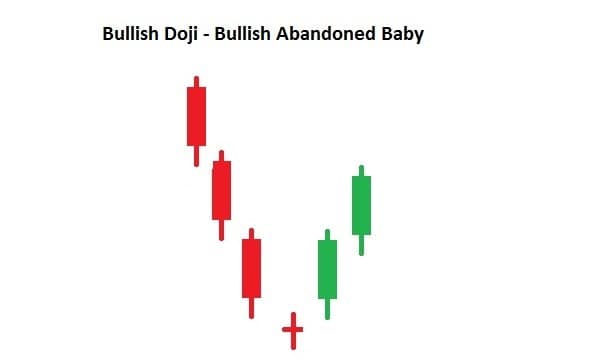
The Bullish Abandoned Baby is a pattern that occurs rarely. To confirm, the Doji should open lower than the previous down candle and the next up candle must open higher than the closing value of the Doji candle.
2. Bearish Doji Pattern – Evening Star:
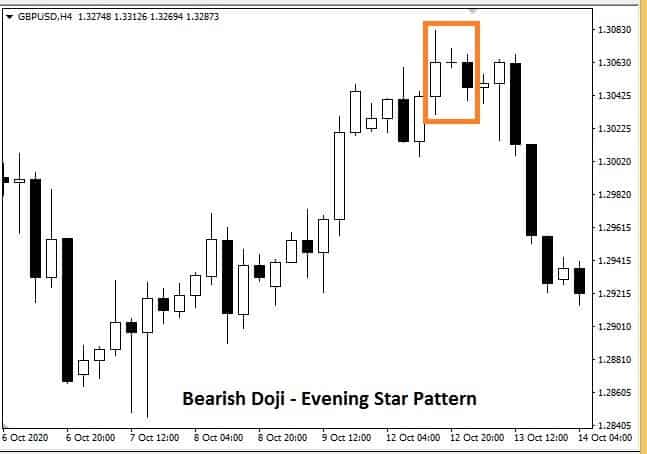
The Evening star pattern is the opposite of the Morning star pattern. It happens in an uptrend the pattern consists of 3 candles an up candle, Doji, and a down candle. In the picture, O prices continue to rise and buyers were in control until the Doji forms, the next candle turns bearish. The completion of this candle happens if the down candle closes more than half the size of the up candle.
Bearish Doji Pattern – Bearish Harami:
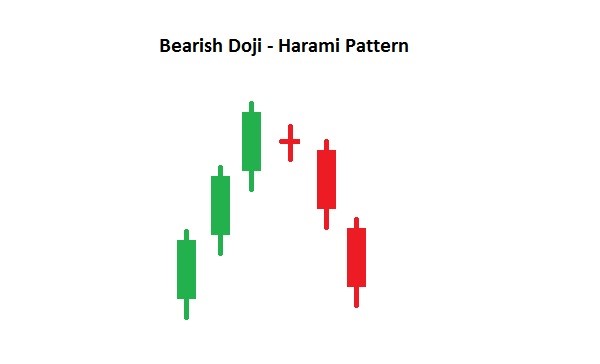
The Bearish Harami pattern can be seen in an uptrend. The pattern confirms that the Doji should form within the body of the previous up candle.
Bearish Doji Pattern – Bearish Abandoned Baby:
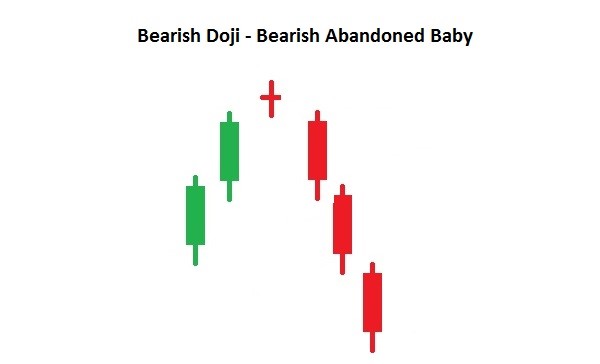
The Bearish Abandoned Baby is a pattern that occurs in an uptrend. To confirm, the Doji should open higher than the previous up candle and the next down candle must open lower than the closing value of the Doji candle.
Limitations:
It is imperative that Doji offers insight and provides signals to the trader, but Doji cannot be traded independently. The trader needs to use additional indicators, chart patterns, candlestick patterns, or any other form of technical analysis to confirm the directional bias provided by the Doji.
A Doji formed in certain market conditions may not be significant, for example, the Doji candles formed at the lower time frame charts like the M1, M5, M15 charts during the lull periods of the market hours may not have any meaning also trading sessions during the end of the trading day of Friday may display a single Doji or even a row of Doji.
Doji does not provide take profit calculations or price projections.
Conclusion:
Every technical indicator or pattern is successful by itself, they provide multiple information and signals regarding various components for a trader to trade successfully. However, combining multiple technical tools and only trading when they are in confluence is the best approach to be successful in technical analysis. Doji candle performs its best if combined with other technical tools.