
When investing in the stock market, traders traditionally focus on figuring out if the market is stabilizing or trending, but smart money is on volatility.
For currency trader’s volatility is profit territory, and something that is followed closely, if there’s an appetite for fast earnings by making short-term trades. Implied volatility is the evaluation of the price and that's the key takeaways volatility is a determining factor.
But not everybody has enthusiasm about volatility, before newbie traders start writing in their notebooks that volatility equals profit, we should accentuate that volatility brings uncertainty into the market. It can be a wave that takes stocks prices in a direction you didn’t predict, resulting in losses.
Investors that use volatility as part of their trading strategy can benefit from excellent tools to measure volatility and interpret the chaos displayed on charts.
There are several volatility indicators, for optimal results traders are advised to focus on popular technical tools that have enabled investors to identify volatility and exploit trade opportunities.
Also Read: Most Accurate Intraday Trading Indicators
Contents
- Identifying Market Volatility
- The Average True Range
- Calculating the ATR
- Keltner Channel
- Advantages and Disadvantages
- Donchian Channel
- Cboe Volatility Index
- Bollinger Bands
- Historical Volatility
- Apply Volatility Indicators When Trading
- Conclusion
- FAQs
Identifying Market Volatility
Indicators identify high and low volatility and pinpoint excellent entry and exit positions for trades.
Large volatility is an obstacle for risky trade producing doubt about serious market moves can also generate purchasing opportunities and is productive territory for veteran traders.
Alternatively, periods of reduced volatility in tandem with trades stability can prompt fuzzy conditions and possible market tops.
Several frequently used volatility analysis tools to estimate the levels of volatility are the average true range (ATR), the Cboe Volatility Index (VIX), Bollinger Bands, and Keltner Channel.
Learning the proper method for using measuring volatility enables investors to trade more effectively. The driving force for volatility is dramatic news that influences the market and prevents trades.
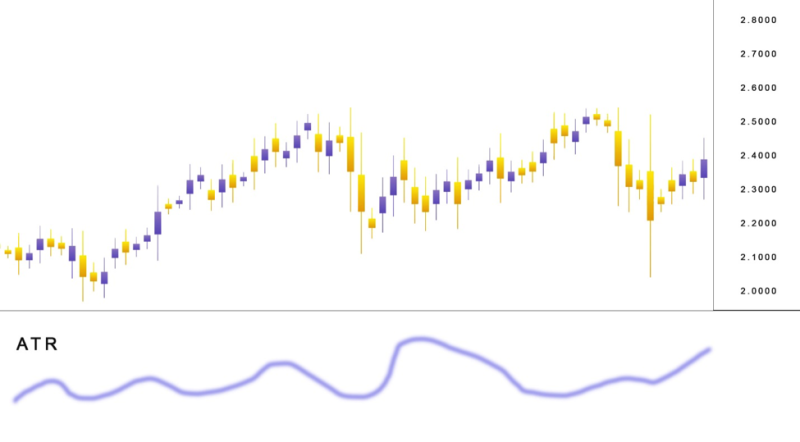
The Average True Range
ATR is popular volatility indicator that may not signal a trend. It’s conceivable to have volatile price movement in a choppy market, this is a regular occurrence when important news arrives.
The attractiveness of the Average True Range is that newbie traders can master it fast and make it part of a trading strategy, making it possible to estimate the correct moment to put set stops and price targets concerning the volatility strength.
Calculating the ATR
The calculation for the ATR gets performed in three steps. It begins with deducting the present days’ low from the high of the present day.
After that, deduct the preceding days’ close from the present days’ high. In the end, make another deduction this time he present days’ low from the preceding days’ to get three different values.
A crucial thing to keep in mind is that the ATR is a lagging indicator.
Which is not good news for traders that prefer to work with leading technical indicators that provide an advantage by identifying opportunistic trades fast. Which is not an option with the average true range.
A higher ATR signals higher trading ranges and increased volatility. Readings on the low scale from the ATR are typically in line with periods of quiet or uneventful trading
Another minus in the ATR resume is the fact it can’t signal the course of a price swing, but can only indicate the possibility for a swing in price, which is not ideal for traders.
The most productive option for implementing the ATR is as a signal of a change in a market. The rise in ATR indicates that volatility will hit the market.
When this happens investors should relax their stops, the dimensions of the candlesticks should be a focal point during ATR increase.
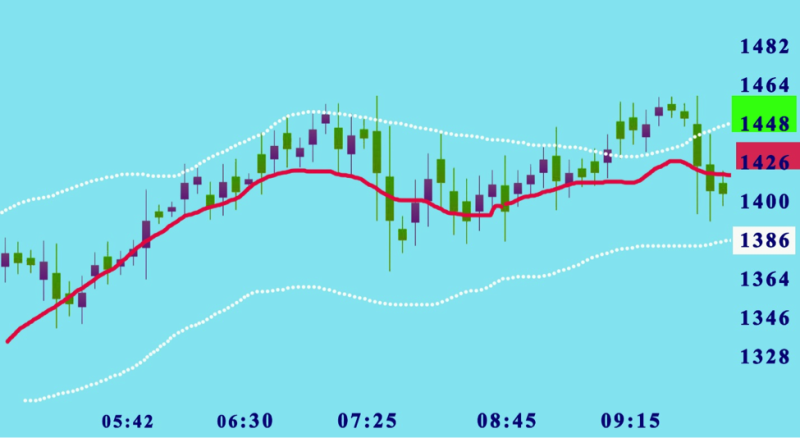
Keltner Channel
The Keltner Channel is a mix of the Average True Range indicator and the Exponential Moving Average. It shares many of the characteristics of the Bollinger Bands, although for identifying volatility it implements a different method.
In comparison with the Bollinger Bands that uses 2 standard deviations over the 20-day moving average, the Keltner Channel is thither and the range is deduced with a band double the dimensions of the ATR on each side of the 20-day EMA.
Investors need to observe for movements in price that break over or under the Keltner Channel lines. Signaling the potential for the prices to stay the course providing fast profit options with upcoming volatility.
Also Read: What Is The Keltner Channel?
Advantages and Disadvantages
The problem with the Keltner Channel is that it's slower to locate volatility when compared with other indicators.
The positive is that if price activity can’t attain the boundaries of the Keltner Channel, the reducing activity will show falling price volatility.
Similar to other indicators in our review the Keltner Channel is a guide for setting trade entries and exits. It can locate overbought and oversold levels concerning the moving averages, most frequently in a flat trend.
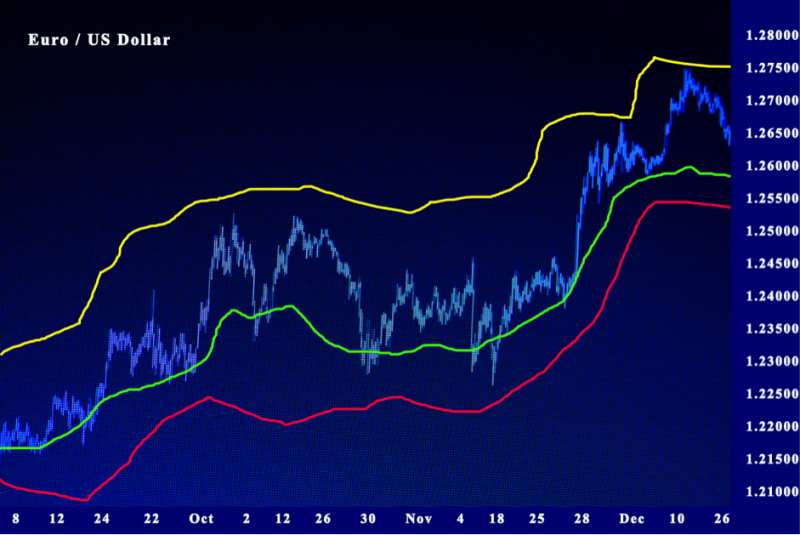
Donchian Channel
Donchian Channels is also part of the volatility indicator pack that is vying for investor attention by identifying volatility in the market prices.
The format of the indicator is based on three lines that get produced with moving averages calculations.
The three bands are: upper and lower bands that go around a median band. The upper band displays the highest price of security and the lower band indicates the lowest price of a security in a given period, typically about a month. The Donchian Channel is the space amid the upper and lower bands.
Cboe Volatility Index
The most used instrument to estimate market volatility is the Cboe Volatility Index , known by its symbol, VIX, and gets estimated with an option-pricing model and shows the expected volatility. The usefulness of the VIX is in displaying present suggested or forested volatility.
The calculation for the indicator uses put or call ratio, strikes prices, and expiry dates that show the reading.
The indicator offers no guarantees and price charts at its own accord, the benefit of the VIX comes from offering an assessment about how traders perceive the market in the short term.
Bollinger Bands
Numerous investors swear by Bollinger bands as a precise instrument for market volatility. Bollinger bands identify if prices are high or low on a relative basis. This is done with a pair of upper band and lower band used in tandem with a moving average.
Crucially the bands should not be used independently but in tandem to verify signals produced from other indicators.
When the bands are wider, it shows the market is getting volatile, on the other side of the band's contract is shows the balanced state of the market.
Focus on the Squeeze and Bounce
Investors search for squeezes and bounces that reveal resistance and support levels. The popular volatility squeeze occurs if the top and bottom band move in the direction of the moving average, signaling an imminent breakout of the price of the given asset.
The opposite scenario happens with bounces signaling approaching retracement.
Still, as is the case with most indicators, Bollinger bands are not precise, and any data should get verified with other analysis methods.
The big upside is that the Bollinger bands can be used in any commodities or stock chart. Just like ATR, the Bollinger band is a lagging indicator without forecasting the power of price patterns it follows present price movements.
Meaning investors may not be informed in time that the movement of the price has commenced.
Generally, the Bollinger Bands make it possible to estimate if the stock is overbought and oversold, the direction of the trade, and when it's ready for a big move.
With these parameters, it’s possible to spot opportunistic entry and exit points.
Historical Volatility
Historical Volatility is drawn on an unconnected pane, which is different when compared with other volatility indicators.
It estimates the length that price covers from a central mean in the selected time period. Frequently used option for estimating the volatility is standard deviation although some version implements different measurements.
When the indicator climbs the risk also multiplies and declines when it goes down. It is non-directional, increasing or declining volatility will not be optimal for strategies focusing on buying or selling.
Apply Volatility Indicators When Trading
These are some of the more popular volatility indicators offered in charting platforms. Investor should check the selection and experiment and find out which indicator is practical for their trading strategy.
They are great instruments for recognizing transitions in the market and when used in tandem with other trending indicators opens plenty of trading options.
There is a warning to remember when trading highly volatile markets the risk of losses is high.
There is no perfect trading setup nor technical indicators the are accurate 100% the best route is to get the most of them in a proven strategy.
Some options are offered by modulating indicators such as those that work for volatility yet this can be a risky and is preferred to stay clear from such practices.
Conclusion
Volatility indicators are great tools for locating trading opportunities during market transitions from high to low periods of volatility.
When used in an integrated trading system with other technical analysis instruments they can generate an extremely flexible trading system.
Volatility is one parameter that can investigate price action in any market and show the high risk. Comprehending the volatility of an asset makes it possible to forecast price movement that can potentially surprise you.
Many traders have a popular volatility indicator that they to locate volatile periods used for future results in options trading.
Forex traders must have risk tolerance with situations of extreme volatility and good investment advice is to be on the lookout for important news events that can create high volatility.
FAQs
How do You use Volatility Indicators?
Traders use different indicators to track volatility and to choose the best exit or entry points for trades.
Is ADX a Volatility Indicator?
The ADX is a short-term indicator frequently implemented to estimate different market conditions including high or low volatility.
Is Volatility a Technical Indicator?
Volatility-based indicators are practical analysis tools that reveal changes in the market in a given time period. The quicker the prices change, the larger the volatility. The opposite is the result of slower prices change, the creates lower volatility.
How do You Measure Volatility?
Volatility is measured by comparing present or predicted returns contra the stock or market's average usually displays a large positive or negative change.


