
Most Accurate Intraday Trading Indicators
Intraday or day trading can be a tough gig because of the unpredictable nature of the market. To still make sense of it, traders use indicators to analyze the charts, identify patterns, entry and exit points, trend reversals, and the list goes on. However, in intraday trading, every second count and you do not want to leave any margins of errors lest your strategy breaks apart. For this reason, traders want to get their hands on the most accurate intraday trading indicators. We will talk about the best indicators for day trading 2020 and 2021.
Content
- Top 5 Intraday Trading Indicators
- Moving Averages (MA)
- Moving Average Convergence Divergencce
- Bollinger Bands (BB)
- Relative Strength Index (RSI)
- Stochastic Oscillator
- Making the Most from Your Indicators
- Putting the Most Accurate Intraday Trading Indicators to Use
Top 5 Intraday Trading Indicators
Some of the most accurate technical indicators are created with a proper formula. However, the developer allows you to adjust certain values. That means savvy traders would know how to tweak the settings to suit their trading styles. If you are new to the whole game, you might be better off not touching the settings and use the default loadout.
Also, you should not use only one indicator. While one can tell you some interesting information about the market, you need more to cover all your bases. Even the best indicator for intraday trading would not be able to tell you everything. That way, your indicators can pick up a positive buy/sell signal and other indicators can confirm or deny it. This creates a system of mutual checks so that you would have the most accurate information at hand.
Also read: Forex academy
You want to use at least two indicators. You might need to use more depending on your preferences. Ideally, indicators should provide you with four main pieces of information. The first is trend, which just tells you the general market’s direction. Momentum indicates the strength behind the trend. Volume tells you how much of the asset is being bought or sold at that moment. Volatility tells you how much the price changes at any given moment. Therefore, the best combination of technical indicators for intraday trading should tell you about the market’s trend, momentum, volume, and volatility.
With this in mind, what are the best or more accurate technical indicators?
Moving Averages (MA)
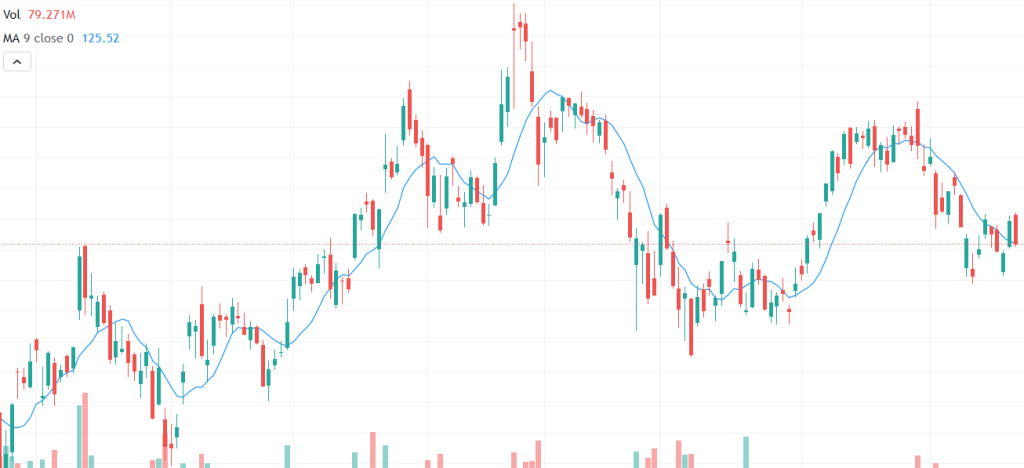
We will start with Moving Averages (MA), which draws a blue line alongside the candles. There are many variants to this indicator such as MACD and EMA. Traders consider this to be the best intraday indicator because it covers many important aspects of the market. It tells you about the momentum behind the trend, potential trend reversal points, and where you can set up your stop-loss and take-profit points.
Moving Average Convergence Divergencce
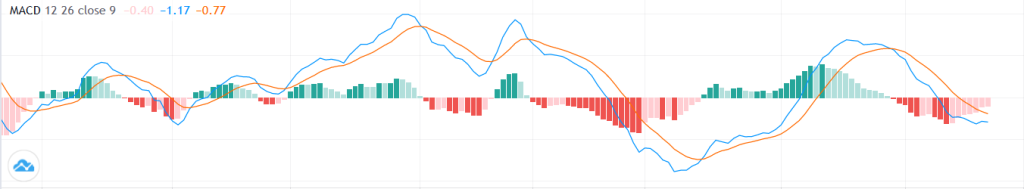
When we talk about Moving Averages, we have to talk about Moving Average Convergence Divergence (MACD). It is among the best technical indicators for day trading. It builds upon two periods of Exponential Moving Averages by drawing a line that indicate the distance between the two, another line to measure the price momentum, and a row of pillars to indicate momentum. You might start to see why traders love this indicator. It gives you almost all the information you need in a neat and convenient package.
Bollinger Bands (BB)
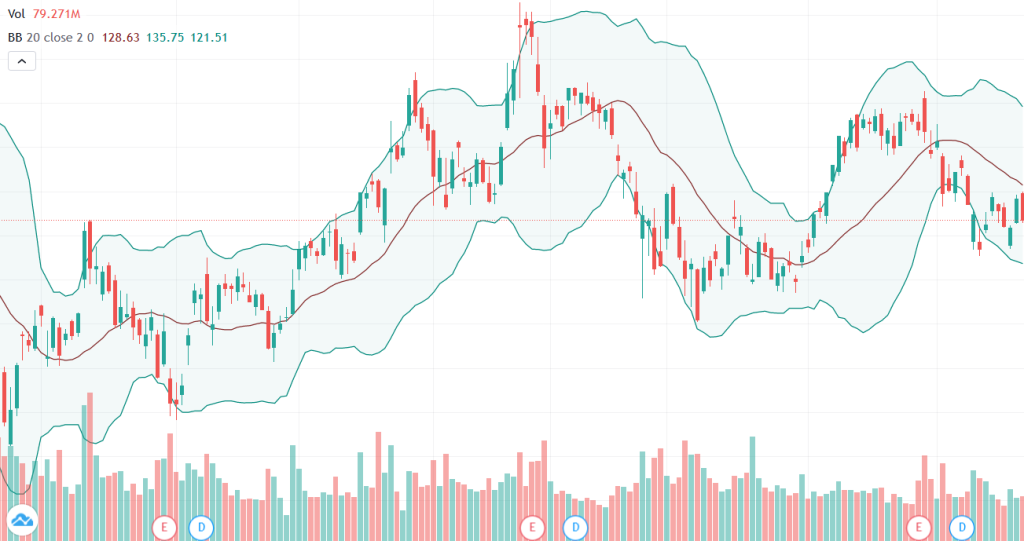
Next up, we have the Bollinger Bands (BB). It draws three lines, one of which is the 20-day period of Moving Averages and two standard deviation bands. The price moves between the two bands and the distance between them tells you the market’s volatility. Bollinger bands help you understand the price range for an asset.
Relative Strength Index (RSI)
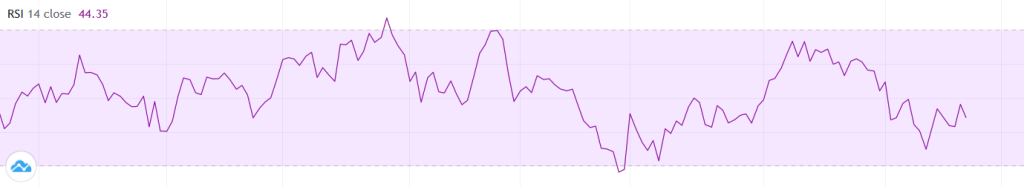
Relative Strength Index (RSI) is one of the best indicators for intraday options trading but it is useful in other markets as well. RSI shows you the momentum behind a trend with a line that goes from 0 to 100, with 30 to 70 highlighted in purple. If the line goes above 70, the asset is overbought. If the line goes below 30, the asset is oversold. Since the market would normalize, that means there is a potential trend reversal in the overbought and oversold areas. Some traders also use RSI to gauge the current trend of the market. Above 50 is uptrend, below that is downtrend.
Stochastic Oscillator
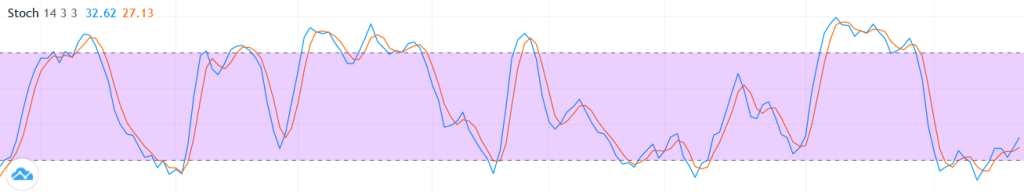
Stochastic Oscillator is also a momentum indicator. Because of its accuracy, this is the best indicator for intraday trading in TradingView. It can give you an accurate reading of when an asset is overbought or oversold. It is a lot like RSI but the overbought is above 80 and oversold is below 20. One way to use the Stochastic Oscillator would be to wait until the two lines cross above 80 or below 20. If they intersect in either area, that means an asset is overbought or oversold, and you should consider going short or long, respectively.
Making the Most from Your Indicators
It is worth pointing out that indicators can only get you so far. They are only as good as the traders themselves. In other words, how much you get out of these indicators is proportional to your skill as a trader. However, if you are new to the whole game, stop. Take a breather and calm down. The prospect of being fully financially independent just by trading a few hours every week is nothing short of a dream. If it is that easy, everyone would be doing that by now.
The fact that no one does tells you a thing or two about the reality of the situation. Many novice traders fall to the allure of this dream and end up putting all of their money into a single position, only to lose it all. Some are successful, but it is luck more than anything. And who wants to put their entire life saving into a bet in which success is based solely on luck?
With this in mind, there are a couple of things to keep in mind if you are new to the whole intraday trading game. Even if you are a veteran, stick around. You might pick up on a couple of tricks here and there.
Also read: Forex reversal patterns
First and most importantly, do your research. Information is everything, especially in the trading world. You have two sources of information. One is from your indicators, which we have already discussed. The other one is from external outlets such as news websites or even community posts. Do your homework and make sure that the information you get is actually true. Indicators do not lie, but people do.
Second, invest your money wisely. That means a few things. For one, it takes time to build up your skill set as a trader. If you are a novice, no number of indicators are going to help you spot the right trading opportunities. If anything, they just confuse you more. So, take your time to learn the basics.
Luckily, you do not have to waste money while you try to learn. Some trading platforms offer demo accounts that allow you to trade with real data but with fake cash so you can see how you fare in the real-world market. This is the best place to try out different trading strategies and styles and see which fits you best. This might not be enough and sometimes you just have to learn the hard way.
On the topic of money, only use the money that you are willing to lose. If you are starting with a small capital, chances are you won’t make a lot of money right off the bat, even if you use leverage. It might be tempting to put in all your money so you can make a lot more quickly, but this usually does not end well. The thing about intraday trading is that even the best strategies are not guaranteed to bring in profits consistently. The market is volatile, so you might end up losing money because you are unlucky.
Therefore, traders consider the money they put into their account to be disposable. In other words, you need to make peace with the fact that you will lose money, maybe even all of it, on a really bad day. That means, you should only trade with the money you can afford and are willing to lose. That way, if you really lose everything, your overall financial health would still be stable.
Also read : Forex patterns
Putting the Most Accurate Intraday Trading Indicators to Use
If you are just starting out, you would need a lot of practice to familiarize yourself with the market and interface. You may even feel lost with the sheer volume of information. That might occur even when you start fiddling with indicators. But learning takes a lot of time and the free articles you find on the internet can only get you so far.
For this reason, why not try out our One Core program? Here at AsiaForexMentor, we have shared our effective ROI-driven trading system with independent traders and professionals alike and have gotten many positive feedbacks. Plus, it works in any market as long as it has a chart.
You can start by checking out our five-part trading system course for free. That alone should help you become a more effective trader. But when you see the value in that book, you will see the value in our course. We will go over the fundamentals of trading, how to use the most accurate intraday trading indicators, trading strategies , and more.


