
Traders search for game-changing technical indicators that will help them identify moments of volatility. There is no doubt that investors increase profitability with the right trading tools in the arsenal.
Within the plethora of trading strategies, brokers use the TTM Squeeze is starting to emerge as a productive tool for future results.

The advantage offered by the TTM Squeeze is that it exploits the habit of security price to break out after assembling in a tight trading range. Professional investors must understand that they are trading a setup and not the stock.
To achieve profits traders must understand the market data like the average true range and all other parameters to prevent potentially rapid changes that expose investors to risk. The volume and volatility in the market can delay account access and the realization of trades.
Also read: Best Technical Indicators for Day Trading
Contents
- What Does TTM Do?
- Momentum Indicator
- Reading the Bollinger Bands and Keltner Channels
- Trading the TTM Squeeze Indicator with Divergences
- Conclusion
- FAQs
What Does TTM Do?
Investors who use the TTM Squeeze know that it can produce results three-quarters of the time it gets used. A great choice for veteran and beginner traders who benefit from the TTM Squeeze and convert a tiny investment into a large asset.
The technical analysis indicator can get used to boost trading techniques that eliminate relevant risk factors, target entry, and exit points, and improve profits.
It has proven itself repeatedly as a dependable tool because it helps in predicting large moves and displays precise timing for options traders. Using momentum components, the standard deviation and looking at the special risks inherent to trade give the optimal squeeze condition.
It has been proven that the TTM Squeeze works, using it properly can potentially make a trader rich steadily. There is a reason it's part of most charting software.
It's a good building block indicator for different trading strategies and to be used with many other trading tools. Traders should learn how to implement the TTM Squeeze if they sell futures or trade other assets.
But is also important to remember that technical indicators are not good standalone tools, they have to be backed up by other indicates or chart patterns, to prevent false signals slipping through and affecting a trade, resulting in losses that can have been avoided if in time the faulty information had been spotted.
A market is a dynamic place, there is a reason so many analysis instruments are used to gauge the condition. Although most attempt to predict future prices movements effectively showing the direction of the trend, they have their shortcomings.
The research has shown that the TTM Squeeze is effective about 70% of the time, traders should worry about the remaining 30% and have that statistic in their minds when making a trade. It can be the difference between a rich bank account and serious losses.
Momentum Indicator
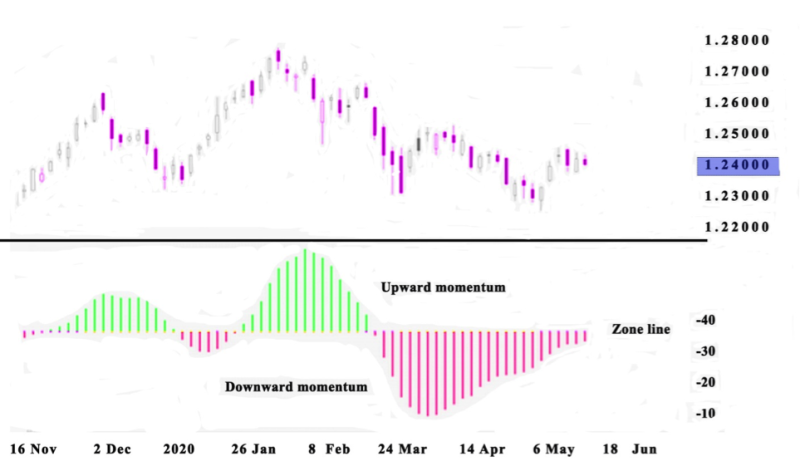
The TTM Squeeze indicator measures the momentum oscillator to display the normal course when the squeeze starts.
The histogram oscillates near the zero line and rising momentum over the zero-line signaling possibility to buy long, while momentum declines under the zero-line signals opportunity for shorting.
There are two elements to the TTM Squeeze, the zero line, and the momentum oscillator. The zero line visually represents the squeeze with red and green dots, while the momentum oscillator signals the direction of the momentum.
It also uses lines, but unlike the horizontal nature of the zero line, here we have vertical lines, where the orange color indicates negative and positive is represented by the blue color, both can be under or over the zero line.
Reading the Bollinger Bands and Keltner Channels
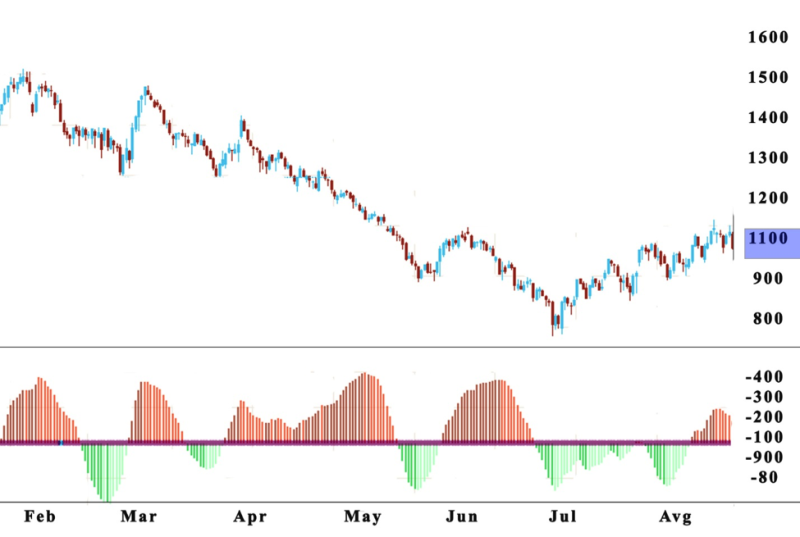
As previously mentioned, the TTM Squeeze indicator incorporates momentum and volatility. The dots that make up the squeeze reveal if volatility circumstances are appropriate for purchases, while the direction of the investment is signaled by the momentum histogram.
The red color of the dots means the volatility is low. But if the volatility starts rising and the Bollinger Bands enlarge and leave the Keltner Channels the squeeze is activated, and the dots will become green. Most analysts advise purchasing on the first green dot.
Many different timeframes can get used for the squeeze. Most analysts verify an asset by observing it in several timeframes. If a squeeze gets activated at the same period in hourly and daily charts, it’s a good signal that a squeeze is forming only in a given timeframe.
With the momentum histogram, trades locate the course in which to perform transactions. If the momentum is over the zero line and climbing then you should purchase long. Yet when the histogram is declining under the zero line it signals a shorting opportunity.
The color-coded dots get used for easier interpretation. Most traders have noticed that the nuance of the dots also changes concerning their position in the zero line. If higher than the previous dot that the color will be lighter, and then lower it will be darker.
The momentum histogram can also be used to regulate distinct exit points. The best course of action is to sell when two new colored dots appear.
When the squeeze is activated and the dots s are light blue traders need to begin selling when they spot a row of dark blue dots.
Typically, the movement of a price after a squeeze continues for up to ten dots. When the histogram changes course and begins backtracking to the zero line, it’s an indication to sell.
Also read: What Is The Keltner Channel?
Trading the TTM Squeeze Indicator with Divergences
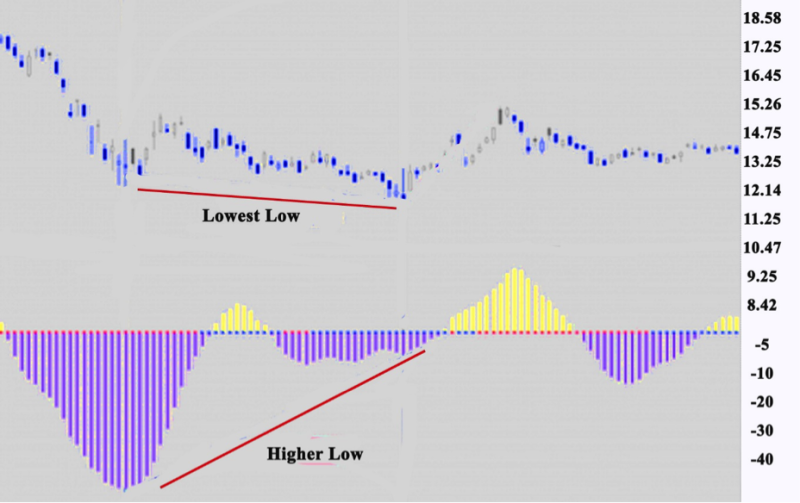
One option for investing with the TTM Squeeze indicator is by using divergence. There is the moment when the momentum starts to descend from the zero line while the price goes the other direction.
When the price is at highs, but the angles of the histogram on the TTM form lower highs on the plus side of the zero line then the result is a bearish divergence. The opposite is true for bullish divergence.
In any trading strategy, adequate risk management needs to be prepared. There are two schools of thought about trading TTM Squeeze Divergences.
The conservative approach uses divergences by taking the angles of momentum and price. The alternative idea states that only the slopes from the histogram can be used when trading divergences on the TTM.
Conclusion
A TTM squeeze happens fast but not frequently. The market energy is what technical investors are trying to locate by looking at stock price change and market volatility. Measuring the potential of an asset is always a good indication of future activates.
The TTM Squeeze indicator estimates volatility and momentum to spot trading options. The volatility element of the squeeze signals potential breakouts after periods of low volatility. Helping to pinpoint the upcoming market direction on stock charts.
While the momentum shows the probable course of the breakout and can provide exit points.
Most investors like to use the squeeze indicator on higher timeframes making it easier to verify a breakout or a trend. The longer periods create more space on the charts, giving traders more metrics that can verify the expected course of the asset.
Most traders know that there are no totally accurate technical indicators, all of them come with a degree of error in the data they provide. And it's never a good idea to blindly believe the signals or get too excited if the indicators show the promising result that may increase the balance on your trading account.
It doesn't make a difference what you are trader forex, options trading, or other assets. It can be a good opinion for your trading system. Following the histogram bars is not enough for the right squeeze setup, you need confirmation from other technical data to get a credible squeeze.
The squeeze is not immune to false signals and because of these needs to be used in combination with other technical indicators. TTM Squeeze Indicator makes recognizing momentum changes and incoming volatility simpler to visualize on the chart.
As a volatility indicator, it can give a good reading of stock prices in most financial markets. That's why it's important to implement a good squeeze strategy to get the correct price trend.
FAQs
Is the TTM Squeeze a Good Indicator?
The TTM Squeeze is a solid indicator with a success rate of 75% it’s great too for complimenting other indicators.
How do I Trade the TTM Squeeze Indicator?
Understanding momentum and the course of the stock price is one of the most problematic concepts for traders. With the TTM Squeeze, investors receive a tool that helps in identifying momentum something that can be the deference of triumph or disaster when starting a trade.
What Is the Best Timeframe for TTM Squeeze?
The time frame depends on your trading strategy, TTM Squeeze can be used on hourly, daily weekly, and monthly charts.
What Is Squeeze Indicator?
The Squeeze indicator estimates the interaction among the Bollinger Bands and Keltner's Channels. Whit the rise in volatility proportional here is an increase in the distance between the bands, and if the volatility declines so will the distance.


