The vortex indicator is a relatively new analytical tool, that gets used to estimate the situation in the market. It focuses on identifying the present trend and its direction. The indicator was created in 2010 by Douglas Siepman and Etienne Botes, two market technicians from Switzerland.
The duo got inspired by vortexes that are created in water and borrowed the concept for following vertical movement in both directions in the financial markets.

At first glance, it may look like a straightforward instrument, but in reality, the vortex indicator is complex. Most retail investors don’t use it frequently. The building blocks of the indicator is two lines that oscillate on a chart and show negative or positive trend movement.
If the lines cross, that that’s a signal that the market is starting to have bullish characteristics. People are beginning to purchase the asset, or it can be bearish when more investors will be inclined to sell the stock. This indicator has a bias, meaning there is no neutral position, it can be either bullish or bearish.
The indicator is formed by looking at the previous two day’s highs and lows. The interval between the present high to the previous low marks positive trend movement. On the other hand, the interval amid the present low and the previous high marks negative movement.
The length of the lines reveals the potential of the trend. For stronger positive or negative trend movements the length will be longer between the two numbers. And a shorter line will indicate a weaker trend movement that can be negative or positive.
Also read: Best Technical Indicators for Day Trading
Contents
- Calculating the Vortex Indicator
- Interpreting the Positive and Negative Trend Movements
- The Limitations of the Vortex Indicator
- Confirm Current Trends on Charts with Vortex
- Technical Analysis with the Vortex Indicator
- Conclusion
- FAQs
Calculating the Vortex Indicator
The formula for calculating the vortex indicator comes in four phases. The initial step is the True Range , which is estimated by locating the present high minus the present low, and present high minus the preceding close, and the present low minus the preceding close and then comparing them to identify of the three which is the largest.
The following step focuses on the positive movement and the negative movement. The positive momentum has the complete value of the present high minus the previous low, while the negative momentum represents the complete value of the present low minus the previous high.
The third step is the length, which typically is between 14 and 30 days. At this point, you take the whole of the time period’s true range, and the positive and negative momentum.
Then calculate the TR over the length of n to get TRn, the positive momentum over the length of n to calculate the VM+n, and the VM- over the length of n to get VM-n.
In the finishing stage of the formula, it’s needed to divide VM+n by TRn to get VI+ and divide the VM-n by TRn to get VI-.
It seems complex yet the formula is straightforward. Most often the trading software will perform the calculations for you, but if we remember that it’s not used on many platforms, then it may be practical to lar the calculation.
Interpreting the Positive and Negative Trend Movements
The most crucial element in interpreting the vortex indicator is the amount of period used in the estimation. Some short-term traders are inclined to the vortex indicators that span a few periods. The opposite is true of long-term traders who are aiming at many periods.
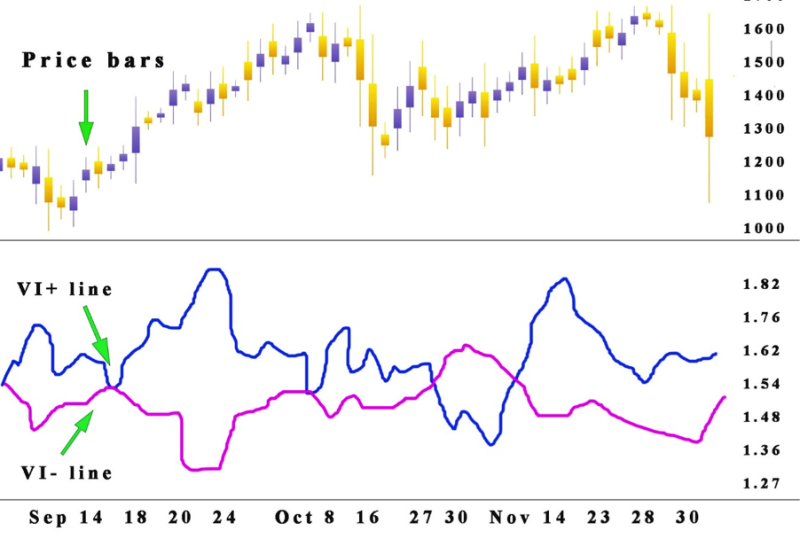
When the number of periods rises, the sensitivity of the indicator declines. The vortex indicator gets created with price bars. A single price bar amount to one period, and then the period can get subdivided into any length of time.
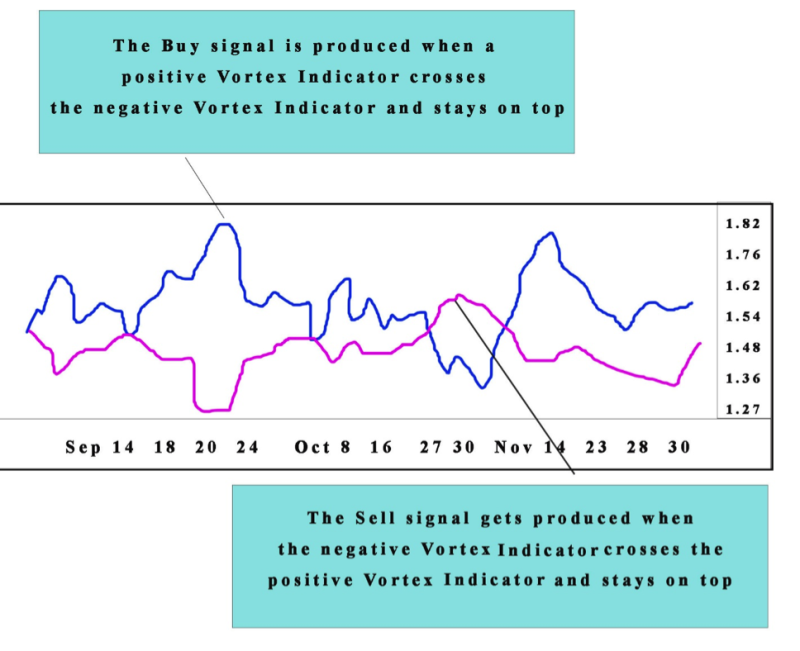
In financial markets, the vortex indicators can generate information on new or current trends. If the positive vortex crosses the negative vortex and stays on top, it’s a signal for possible upward price momentum, creating a buy signal.
As in physics so in trading, everything that goes up must come down. So, if the negative vortex crosses the positive vortex and stays at the top, this situation indicates a possibility for a downward movement in price. That is seen as a sell signal.
Using more simplified language is the plus or minus version of the vortex indicator stays at the top it’s a signal if the asset is going into a downward or upward trend.
The Limitations of the Vortex Indicator
The vortex indicator offers benefits for traders, yet it has some drawbacks, most crucially it only shows the current situation in the market, and cannot forecast future movements.
When trading the best investment is quality research, the price can move in both directions, and its previous performance will not be evidence for future results.
False reading is possible with a vortex indicator something that is possible for technical instruments that look at market oscillations in the market. This can be more obvious in shorter periods.
The young nature of the indicator, being in use for only a decade, means it has not been seriously tested. When compared to other tools the experience is limited. However, it can be practical for analyzing market information, yet it should always be used in combination with other technical indicators.
Confirm Current Trends on Charts with Vortex
When trading and using charts to determine the situation ton the market, the initial step is to review the chart and get a visual representation of the movement of prices. The next move is to implement the vortex indicator on the chart.
Check the default period used for the indicator. Typically, it's 14, yet you can always modify it to meet the trading strategy that's used in the market.
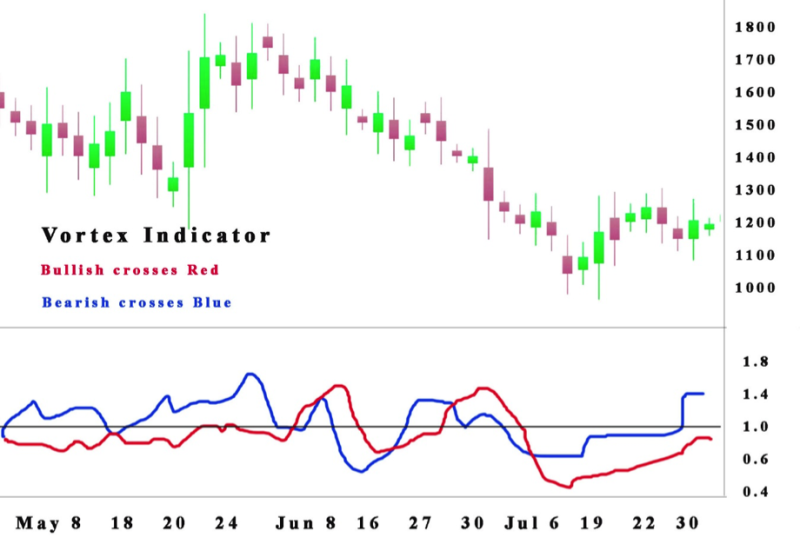
When you implement the vortex indicator, drawing a horizontal line at one, that’s the middle line. Usually, the price will decline if the positive line is decreeing. The price climbs if the positive vortex indicator line rises.
Also Read: Forex Trading Strategies: Which trend should I look?
Technical Analysis with the Vortex Indicator
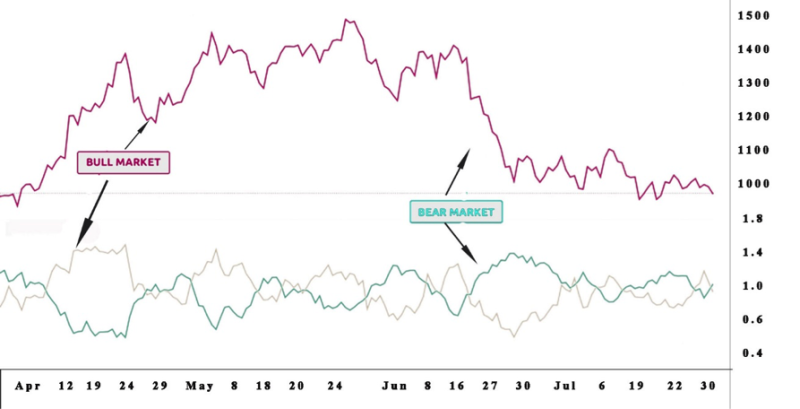
The initial goal for the creators of the vortex indicator was to produce an instrument that will eliminate false signals. With a trading strategy that incorporates the vortex indicator the major low or high during the current day of the transition between the bearish market and a new bullish market sentiment is crossover is the planned entry price.
It is possible that the levels cannot be achieved in the same time period when the indication was revealed, encouraging sell or buy order that stays in active for several sessions, if that is needed.
When placed during the transition, the major high or low turns into a level of reverse action and a stop. When implementing this type of trading scheme, the short sale is will be shield and return to the long side when the price returns to the drastic high after a crossover that is on the plus side.
The long position can be offloaded on the market and made into a short sale after the price comes back to the major low after a crossover with negative characteristics.
It is advisable to mix the entry with different tactics for controlling possible risk levels that can produce loses.
These safeguard measures reduce false signals and increase profits on the current trend, these apply in circumstances when the significant momentum is not accomplished.
But the approach doesn’t take care of the period length, creating a landslide of incorrect alarms these will happen until adapted to the prearranged stay in place period.
Conclusion
The vortex indicator is not completely original it gets based on previous work done by J.Welles Wilder. At its core it’s a trend following indicator that s formed from two oscillating lines that follow the market's price bars to locate key trend change points. The points where the lines cross reveal solid entry points.
Most trading strategies can benefit from this directional indicator that offers signals and show trend reversals. It can get used for different assets and timeframes.
The interesting thing is that it can be applied to locate a larger trend within weekly charts, and then use it within a daily chart to further locate details about the trend.
When working with a daily chart, analysts should focus on a bullish signal is the vortex indicator is signaling an uptrend. They can also use t for bearish signals.
When implementing the indicator, it’s smart to combine it with another technical tool like the MACD to minimize false signals.
FAQs
How Does a Vortex Indicator Work?
The vortex indicator uses two oscillating lines. One for locating a positive trend movement while the other reveals negative price movement. When the lines cross it activates buy or sell signals that get created to exploit the most dynamic trending action.
What Is Vortex Indicator in Stock Market?
The vortex indicator gets used in the stock market to verify an existing trend and locate a reversal in trend.
How can Vortex Indicators Prevent False Signals?
The traditional application of the indicator can produce a large quantity of false trade. Preventing false signals is best accomplished when increasing the number of periods.
What Is the VUD Indicator?
The VUD indicator is the most precise tool to identify real-time demand or supply in the market