
What's up traders, Ezekiel here! Let's get straight into it, your quick market breakdown covering what's happening right now, why you should care, and how to navigate it like a seasoned trader:
- Today's market mayhem. S&P 500 at 7,445.72, EUR/USD at 1.1608, Bitcoin at $77,686, and Gold at $4,544 today
- The dollar is holding near a six-week high and the yen is getting crushed, here's exactly what the Iran situation means for your FX trades
- Oil is swinging $3 a day on Iran headlines, Brent held near $106 Friday even as weekly losses piled up, and traders are caught in the crossfire
- Smart Money doesn't care where price bounced last time, they care where their orders are sitting, and our latest video shows you exactly how to find those zones
WEEKLY MARKET MAYHEM🔥
For this week's market mayhem, here’s what we got for you today:

The Dollar Won't Quit, and the Rest of the World is Paying for It
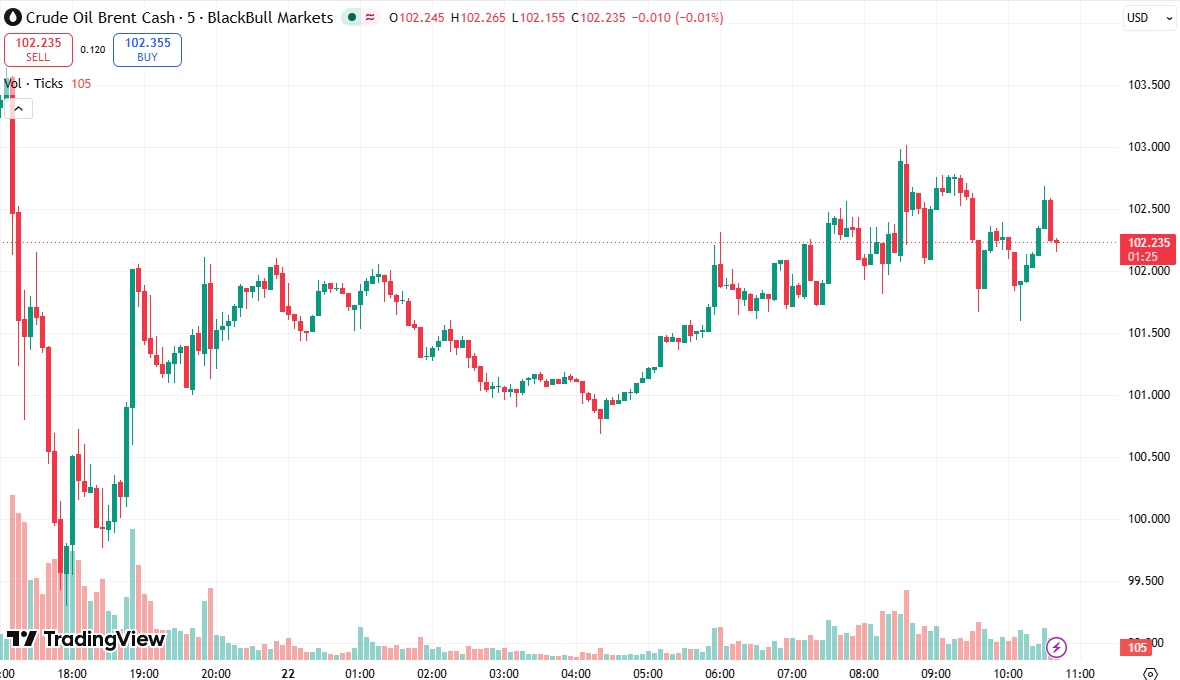
The U.S. Dollar Index sat at 99.23 on Friday, hovering just below the 99.515 peak it hit the day before, its strongest level since April 7. That's not luck. Weekly jobless claims dropped, manufacturing activity surged to a four-year high in May, and suddenly the American economy looks like the one kid who did their homework while everyone else panicked.
The elephant in the room is still the U.S.-Iran peace talks, which have been sending markets on a roller coaster ride all week. Secretary of State Marco Rubio offered a cautious “some good signs,” but both sides remain deadlocked on Tehran's uranium stockpile and control of the Strait of Hormuz. 💬 Markets whipsawed overnight, though Asian trade on Friday was relatively calm as traders waited for actual clarity rather than diplomatic vibes.
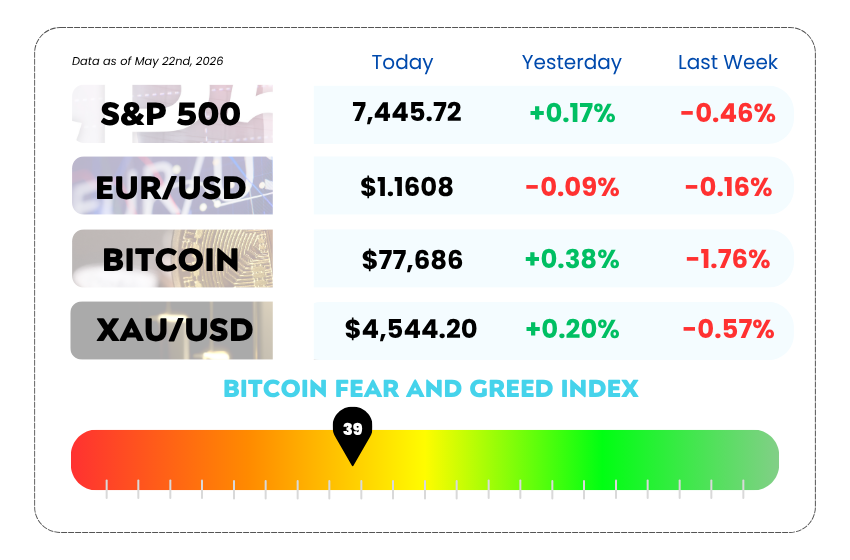
The euro was on track for its second straight weekly loss, down 0.1% at $1.1607. The pound was slightly softer at $1.342, shrugging off data showing British retail sales fell at the fastest pace in nearly a year in April as consumers buckled under war-driven inflation.

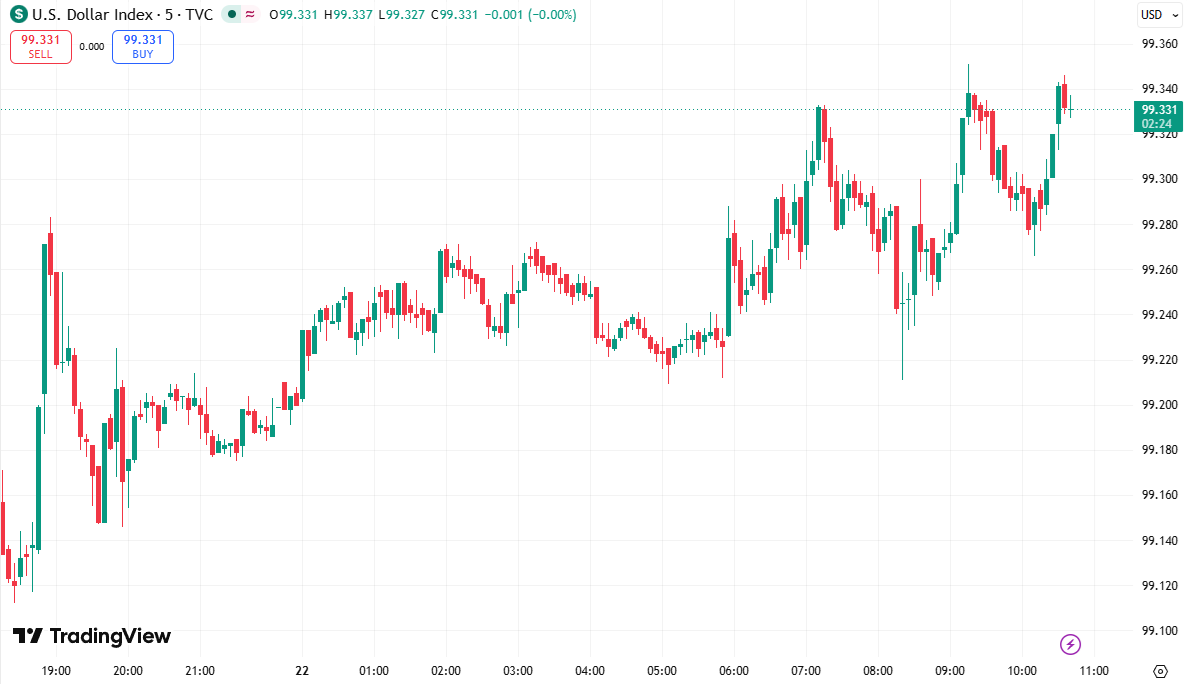
US Dollar Index Daily Chart as May 22, 2026 (Source: TradingView)
Then there's the yen, which is having a genuinely rough time. USD/JPY was sitting above 159 on Friday, with the yen having already given back roughly 75% of its gains from Tokyo's presumed currency intervention just weeks ago. The Bank of Japan is expected to hike rates very gradually, while the European Central Bank is signalling rate hikes could come as early as June, and that rate differential is absolutely punishing the yen. On a trade-weighted basis, the yen is at record lows, which is great for Japanese exporters but brutal for households getting hammered by expensive imported energy. Japan's core inflation slowed to a four-year low in April, which makes the BOJ's job even harder.
Across the rest of Asia, the pain is spreading. Indonesia announced this week that all natural resource exporters must park 100% of their export revenues in state-owned banks starting June 1, an extraordinary move to shore up the collapsing rupiah. It didn't help much. The rupiah was sitting near a record low of 17,710 per dollar on Friday.
🤔 Asia Forex Mentor Insights
USD/JPY is approaching a critical zone. A sustained break above 160 would likely put Japanese authorities on high intervention alert. Watch for BOJ comments over the weekend and don't hold large yen long positions into Sunday's open without a tight stop.
EUR/USD is grinding toward 1.1600. If the pair closes the week below that level, the next area of interest is around 1.1500. ECB rate hike talk in June could either accelerate or stall this move depending on tone.
Emerging market pairs like USD/IDR are showing systemic stress. Indonesia's 100% repatriation rule signals policymakers are running out of conventional tools. Avoid trading these pairs without extremely tight risk management, and be aware of weekend gap risk.
The dollar's strength is real and data-backed. Don't fight the trend until there's a meaningful shift in the Iran situation or a deterioration in U.S. economic data.
Oil is Playing Ping-pong with $106 and Traders are the Paddle
Brent crude climbed $3.30 (3.2%) to $105.88 a barrel on Friday morning, while WTI was up $2.53 (2.6%) at $98.88. Sounds great, right? Except on a weekly basis, Brent was still down over 3% and WTI was down around 6%, because oil prices have been swinging violently as traders try to read every U.S.-Iran headline like it's a fortune cookie. 🔮
The core issue hasn't changed in six weeks. The fragile ceasefire is holding, but peace talks have made painfully little progress. The U.S. and Iran remain split on Tehran's uranium stockpile and who controls the Strait of Hormuz. A senior Iranian source told reporters that gaps have “narrowed,” Rubio talked about “good signs,” but the market has heard this before and wasn't exactly throwing a party.
Around 20% of global energy supplies once transited the Strait of Hormuz. The war has effectively removed roughly 14 million barrels per day from global markets, about 14% of world supply, cutting off exports from Saudi Arabia, Iraq, the UAE, and Kuwait. Think about that for a second. 🛢️ That's not a supply disruption. That's a supply crater.

Crude Oil Brent Cash Daily Chart as of May 22, 2026 (Source: TradingView)
Even if a deal is signed tomorrow, the head of UAE state oil firm ADNOC said full oil flows through the Strait won't return before the first or second quarter of 2027, thanks to infrastructure damage and the time needed to rebuild operations. Fitch Solutions has already revised its average 2026 Brent price forecast up to $90 from $81.50 to account for the supply deficit and that normalisation window.
Meanwhile, OPEC+ is expected to agree to a modest production hike for July when its key members meet on June 7, though several members' own output remains disrupted by the war. China's refined fuel exports in June are expected to rise only slightly to around 550,000 metric tons, as Beijing prioritises its own domestic demand first.
The market summary, according to oil analysts, is that “optimism of an imminent truce” keeps prices from running higher, while the reality of depleting global inventories stops them from falling too far. Oil is essentially stuck in a tension range, and headline risk is everything right now.
🤔 Asia Forex Mentor Insights
Watch oil-correlated FX pairs closely. USD/CAD and NOK/USD are sensitive to Brent moves. Brent holding above $100 supports CAD strength, but a peace deal headline over the weekend could trigger a sharp spike. Be ready, not caught off-guard.
The weekly loss in oil (Brent down 3%+, WTI down 6%) matters more than Friday's bounce. Don't chase oil longs near $106 without clear confirmation. The trend is volatile, not bullish. Wait for structure.
Risk sentiment and crypto are linked here. When oil headlines turn negative and equity markets get nervous, Bitcoin tends to get sold too. Keep an eye on BTC's reaction to any major Iran development over the weekend.
The $90 Brent forecast from Fitch for the full year 2026 is already below current prices. That tells you analysts expect a deal eventually, just not yet. Trade the range, not the direction.
MEMES OF THE DAY 🤣
It's about the passive income, right

Watching others profit like
