What’s up traders, Ezekiel here! Let’s not waste a second, here’s your market breakdown on what just moved, why it should be on your radar, and how to play it before the rest of the crowd catches up.
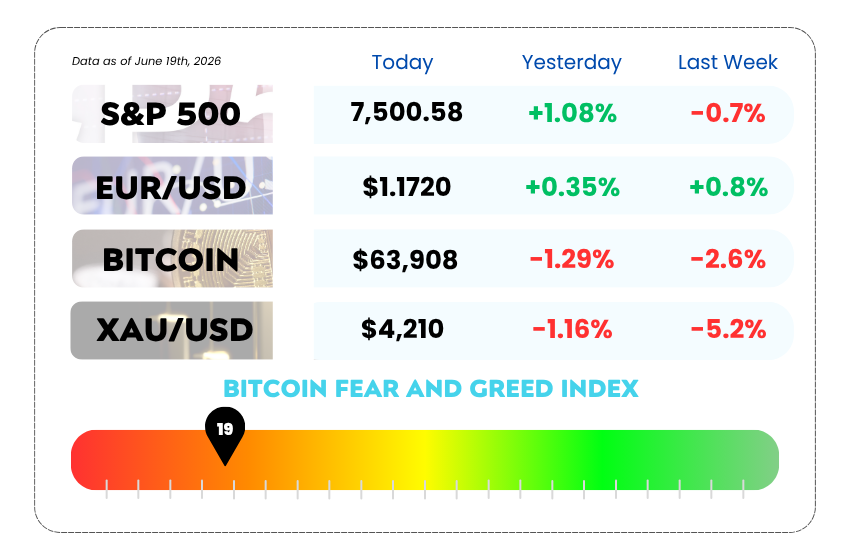
- Today’s market mayhem. S&P 500, EUR/USD, Bitcoin, and XAU/USD today
- Trump signed the US-Iran 14-point peace deal at the Palace of Versailles, the Strait of Hormuz is reopening, oil is sliding toward $80, and stocks are ripping to fresh highs
- New Fed Chair Kevin Warsh just dropped a hawkish bomb in his first FOMC meeting, with 9 of 18 officials projecting a rate hike in 2026, forward guidance eliminated, and Bitcoin stuck at $63K while stocks celebrate the Iran deal
- Most traders take every clean supply and demand zone and wonder why results stay inconsistent. Our latest video breaks down the exact 5-filter Smart Money framework that separates A+ setups from noise
WEEKLY MARKET MAYHEM🔥
For this week’s market mayhem, here’s what we got for you today:

The War Is Over. Trump and Iran Signed the Deal at Versailles. Markets Are Repricing Everything.
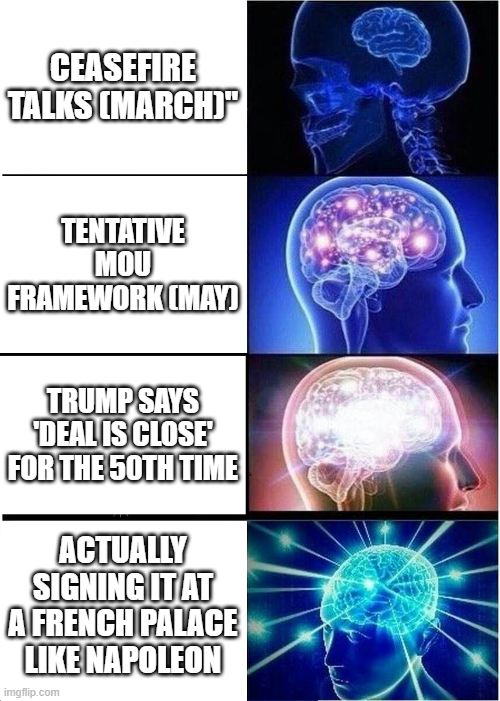
It’s done. On Wednesday evening, President Trump signed a 14-point memorandum of understanding with Iran at the Palace of Versailles in France. Iranian President Masoud Pezeshkian signed separately, posting an image on X and calling it a “historic document and a message from a strong Iran: peace will be achieved in the shadow of mutual respect.” 🕊️
Trump, in classic fashion, told reporters: “It’s signed. Signed in Versailles. Just signed it.”
Here’s what the deal actually says. Iran will dilute its stockpile of enriched uranium. The US will lift all sanctions, unfreeze Iranian assets, and allow Tehran to immediately sell oil freely. The Strait of Hormuz blockade, which has been in place since April, is being lifted. VP JD Vance confirmed both sides are honoring their commitments, and the US Navy is standing down from the blockade. The formal ceremony is scheduled for today, June 19, in Switzerland, kicking off a 60-day negotiating window for a final peace deal on Iran’s nuclear program.
Markets loved it. The S&P 500 rallied 1.08% to 7,500.58, the Nasdaq surged 1.91%, and the Russell 2000 popped 2.12%. Oil is now sliding toward $80 a barrel (Brent), down from $97+ just two weeks ago, as the prospect of restored Iranian oil exports takes the supply squeeze out of the energy equation. Energy stocks got hammered on the deal, which tells you the market believes this one is real.
Gold, meanwhile, is getting absolutely crushed. XAU/USD hit $4,210, down over 5% in two weeks. The combination of the Iran peace deal (killing safe-haven demand) and the hawkish Fed (raising yields and the opportunity cost of holding gold) has created a perfect storm for the precious metal. Gold is now down from its January all-time high of $5,602 to $4,210, a 25% drawdown.
🤔 Asia Forex Mentor Insights
This is the most significant geopolitical shift of 2026, and it changes the macro playbook for every market. If Iran’s oil comes back online, that’s a disinflationary force that directly pushes down energy prices, which have been the primary driver of inflation for the last four months.
For forex traders, this is where it gets interesting. Lower oil prices should weaken the dollar (less inflation = less hawkish Fed), but the dollar is currently being supported by the hawkish Warsh dot plot. Watch for these two forces to collide over the next 2-4 weeks. EUR/USD is likely to test 1.18-1.19 if oil sustains below $85, as the ECB could potentially pause hikes while the Fed stays on hold.
For gold traders, the $4,200 level is critical support. If it breaks, the next floor is $4,000, which would represent a 28% drawdown from the all-time high. The gold bull market isn’t over, but it’s taking a serious beating from the twin forces of peace and higher yields.
The Warsh Era Has Arrived. Forward Guidance Is Dead. And Bitcoin Is Trading a Completely Different Market Than Stocks.
Here’s the most important divergence in markets right now: the S&P 500 is up 1.7% and the Nasdaq is up 3.1% on the Iran deal. Bitcoin is down 1.3% at $63,908. Stocks are trading geopolitics. Bitcoin is trading Fed policy. And those are two completely different risk profiles. 📉
On June 17, Kevin Warsh chaired his first FOMC meeting as the new Federal Reserve Chair, and he didn’t just change the tone, he rewrote the entire communication playbook. The Fed held rates at 3.50%-3.75% for the fourth consecutive meeting (12-0 vote), which was expected. But everything else was a shock.
The dot plot showed 9 of 18 officials now project at least one rate hike in 2026, with six of those projecting two 25-basis-point hikes. The median fed funds rate forecast for year-end jumped to 3.8%, up from 3.4% in March. The PCE inflation forecast was raised to 3.6%, up from 2.7% in March, a massive revision that tells you the Fed sees inflation staying much stickier than anyone hoped.

And then Warsh did something no Fed Chair has done in the modern era: he eliminated forward guidance entirely. The FOMC removed all previous references to “additional rate adjustments” and adopted a purely data-dependent, neutral stance. No hints, no breadcrumbs, no hand-holding. ZeroHedge noted that one dot was missing from the plot, likely Warsh’s own, meaning the Chair is withholding even his personal rate projection.
Goldman Sachs’s Kay Haigh put it bluntly: “Despite the recent pullback in oil, half of FOMC members expect rate hikes this year, reflecting strong labor market and inflation data. Our base case remains that the Fed can just about avoid hikes, but the path is narrow.”
The impact on crypto was immediate. Bitcoin and Ethereum spot ETFs lost $111 million on June 17 as rate-cut hopes collapsed. BTC is now down 50% from its October 2025 all-time high of $128,198 and showing no signs of bottoming as long as the Fed stays hawkish. The Dollar Index is on the verge of a major breakout, which is historically toxic for crypto.
But here’s the silver lining: long-term Bitcoin holders absorbed 125,000 BTC in June, one of the largest monthly accumulation events of the cycle. Someone is buying this dip aggressively, just not the ETF crowd.
🤔 Asia Forex Mentor Insights
This is the most important macro setup of the year, and traders need to understand what’s actually happening. Two massive forces are now pushing markets in opposite directions: the Iran peace deal is disinflationary (lower oil = lower CPI = eventually less hawkish Fed), while the Warsh dot plot is hawkish (higher rates = stronger dollar = pressure on risk assets).
The resolution comes down to timing. If oil sustains below $80 and the July CPI print comes in cooler, Warsh’s data-dependent Fed gets the data it needs to soften. That’s the catalyst that could flip BTC from $63K back toward $70K-$75K. But if CPI stays hot despite lower oil, the September meeting becomes a live hike risk, and crypto enters a much deeper drawdown.
Three catalysts to watch: the US-Iran formal signing today in Switzerland (if oil drops further, bullish for everything), the CLARITY Act (Senate floor calendar, targeting July 4 signing, the biggest crypto regulatory catalyst of the year), and the July CPI print (mid-July, the data point that determines whether the Warsh hawks get their hike or stand down).
For forex traders, the dollar is king right now. USD/JPY is testing 160 again. EUR/USD is caught between Iran-deal-driven optimism (bullish euro) and Warsh-driven yield differentials (bullish dollar). Trade the data, not the narrative, because right now the narratives are contradicting each other.
MEMES OF THE DAY 🤣
This man has been begging us since 2020 and we still won’t listen 🙏

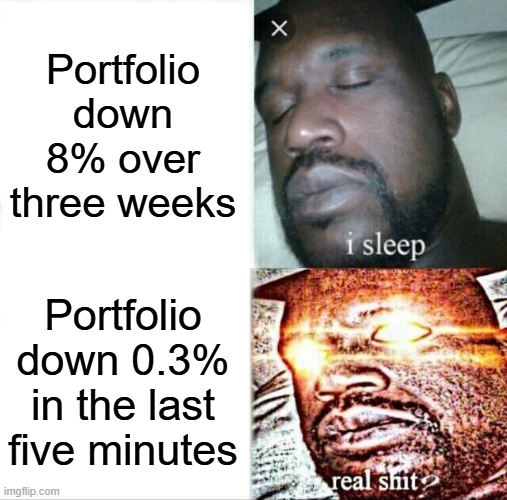
It’s not the size of the loss. It’s the speed 😳