Have you ever looked at a forex chart and wondered why forex patterns keep repeating during different market conditions? Many traders feel confused when they see constant price movements without knowing how to read trading chart patterns or understand their meaning. These chart patterns are not random at all. Each pattern form reflects human emotions, fear, greed, and hesitation, seen through candlestick charts. Learning chart pattern analysis helps traders understand the story behind every price movement and anticipate future price movements with confidence.
Every successful trader learns that forex patterns mirror human behavior, not luck or guesswork. When traders master reversal patterns, continuation patterns, and candlestick patterns, they gain clarity about market structure. They stop reacting emotionally and start trading based on logic and technical analysis. Recognizing a bullish reversal pattern or bearish reversal pattern helps traders plan precise entries and exits. Whether new or experienced, mastering these common chart patterns builds discipline, improves timing, and strengthens every forex trading strategy.
What are Forex Patterns?
In the forex market , charts record every price action and show how traders respond to changing market conditions. Each price movement reveals the balance between buying pressure and selling pressure, shaping the ongoing prevailing trend. These trading patterns repeat because human behavior stays consistent during similar situations. A bullish pattern forms when confidence rises and prices push higher, while a bearish pattern appears when weakness builds and a trend reversal begins. These visual clues help traders see how support and resistance lines influence every breakout point and possible reversal chart pattern.
Understanding chart patterns allows traders to identify trading opportunities and plan better entries with solid risk management. Tools like technical indicators, momentum indicators, and volume analysis strengthen decisions by confirming continuation signals or reversal signals. Common setups such as the bullish flag pattern, double bottom, or head and shoulders pattern guide traders toward more accurate profit targets. With discipline and patience, traders learn to manage their trading capital wisely, react calmly to market volatility, and trade with greater confidence in both bullish and bearish candlestick patterns.
What Are Chart Patterns?
Chart patterns are visual formations that show how market price reacts to changing trader emotions and momentum. Each pattern tells a story about where the current trend might continue or reverse. When price breaks a key level, it signals if a new trend may start or if the overall trend will stay in the same direction. Traders study these shapes carefully to plan the best entry point and estimate their price target with accuracy.
Some common formations include the double top pattern, symmetrical triangle, and gartley pattern. Each helps traders predict whether the next price changes will push price higher or create a low point. The bullish engulfing pattern suggests strength and buying interest, while the bearish engulfing pattern warns of weakness and market indecision. When a breakout occurs, traders confirm signals using tools like the relative strength index and apply proper risk management before taking a long position. With practice and discipline in managing risk, chart patterns become powerful guides for every currency pair and even the stock market.
How Chart Patterns Work in the Forex Market
-
They Show the Market’s Story
Chart patterns in the forex market reveal how traders react during changing market conditions. Each movement reflects the struggle between buying pressure and selling pressure across different currency pairs. By reading these shapes, traders begin to understand how emotions drive every price change on the chart. -
They Help Predict Future Direction
When a price breaks a key level, it hints at a possible trend reversal or continuation. A bullish engulfing pattern often marks strength, while a bearish engulfing pattern shows fading momentum. Learning to recognize these signs helps traders anticipate where the current trend may head next. -
They Guide Entries and Exits
Understanding patterns helps traders plan the right entry point and choose realistic profit targets. When a breakout occurs, confirming it with technical indicators like the relative strength index builds confidence. Each trade becomes more controlled when traders apply proper risk management before taking a position. -
They Build Trading Discipline
Reading chart patterns trains traders to slow down and trust their analysis instead of emotions. Patterns like the double top pattern or symmetrical triangle teach patience and structure. With consistent practice, traders learn to manage risk, avoid false signals, and trade with long-term confidence.
Understanding Continuation Patterns in Forex Trading
Continuation patterns show moments when the market pauses but still plans to move in the same direction. These formations signal that the current trend remains strong, giving traders confidence to stay with the move instead of exiting early.
-
Pennants
Pennants form when prices pause after a strong move, creating a small triangle-shaped range. When a breakout occurs, the trend usually continues with similar energy. Traders often use pennants to confirm momentum before taking their next entry point. -
Rising Wedges
A rising wedge appears during an uptrend when prices move higher but begin losing strength. The narrowing range shows that buying pressure is fading and a reversal could soon follow. Traders stay alert for a breakout below the wedge as a warning of a potential pullback. -
Falling Wedges
A falling wedge forms when prices drop within two downward-sloping lines. This pattern signals that selling pressure is slowing and buyers may return soon. When the price breaks upward, it often confirms the start of a new bullish trend.
Reversal Chart Patterns
Reversal chart patterns signal that the market trend is losing strength and may soon move in the opposite direction. These patterns help traders spot turning points early, allowing them to adjust positions before major price changes occur.
-
Head and Shoulders
-
Inverted head and shoulders
-
Double top
-
Double bottom
-
Triple top
-
Triple bottom
-
Ascending triangle
-
Descending triangle
-
Rounded top
-
Rounded bottom
Bullish Forex Patterns
Based on the direction of the ability of the patterns to indicate the potential price direction, the following can be classified as bullish patterns
-
Ascending triangle
-
Rounded bottom
-
Penants
-
Rising wedges
-
Cup and handle
-
Double bottom
-
Triple bottom
-
Inverted head and shoulders
Bearish Forex Patterns
The forex patterns mentioned below indicate the higher possibility for the bearish price action once the pattern is completed
-
Falling wedges
-
Penants
-
Descending triangle
-
Rounded top
-
Double top
-
Triple top
-
Head and Shoulders
Forex-patterns
Head and Shoulders
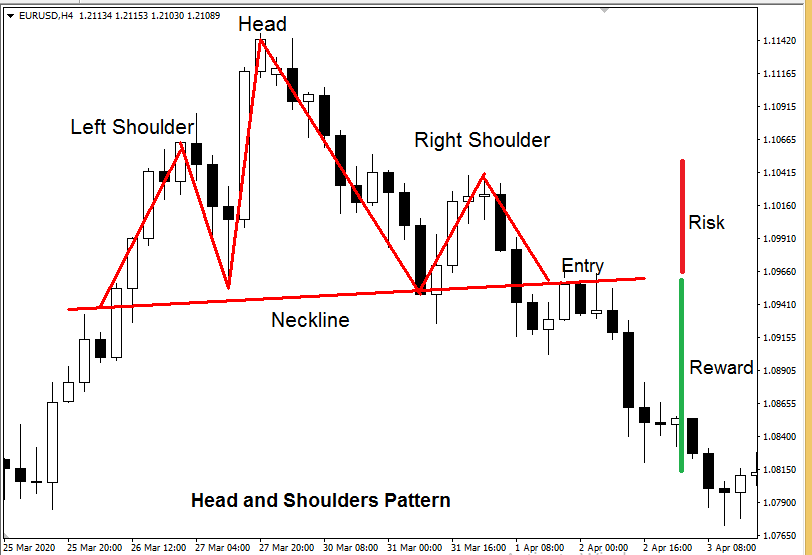
The most important of the chart patterns is the head and shoulders pattern, which signals a bearish reversal. This pattern gives traders both an entry point and a stop loss for better control and risk management. The take profit is calculated as a multiple of the stop loss, helping traders plan realistic profit targets. Its unique shape shows a left shoulder, a head, and a right shoulder forming one complete structure. The neckline connects the base of both shoulders and the head, acting as a key support level. The pattern completes once the left shoulder, head, and right shoulder form clearly, followed by a neckline break.
When the price breaks the neckline, traders see it as the ideal entry point for short positions. The stop loss is placed just above the right shoulder for protection against sudden reversals.The take profit can be measured using a 1:2 risk-reward ratio, balancing safety and potential gain.
Inverted Head and Shoulders
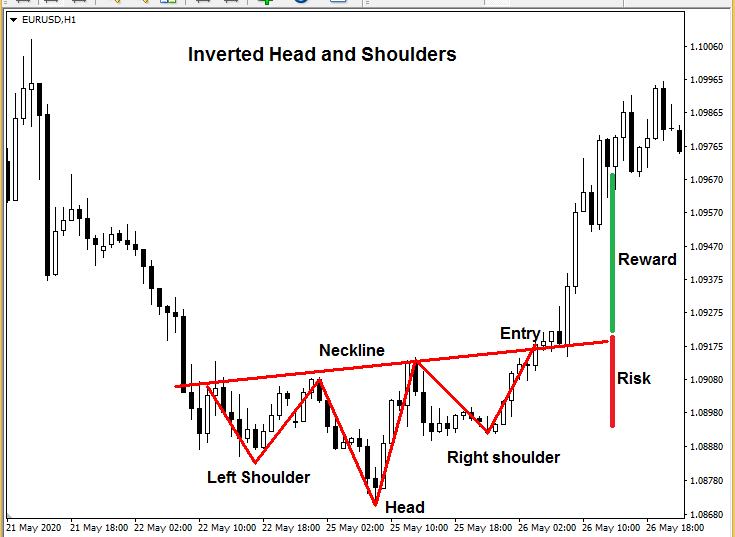
The inverted head and shoulders is a bullish reversal pattern that mirrors the regular head and shoulders setup. This pattern has the same components as the original but forms in the opposite direction during a downtrend. Most new forex traders and experienced traders can trade the head and shoulders pattern successfully with proper confirmation.Those who master this setup are often considered skilled and consistent profitable traders in the forex market.
Double Top Pattern
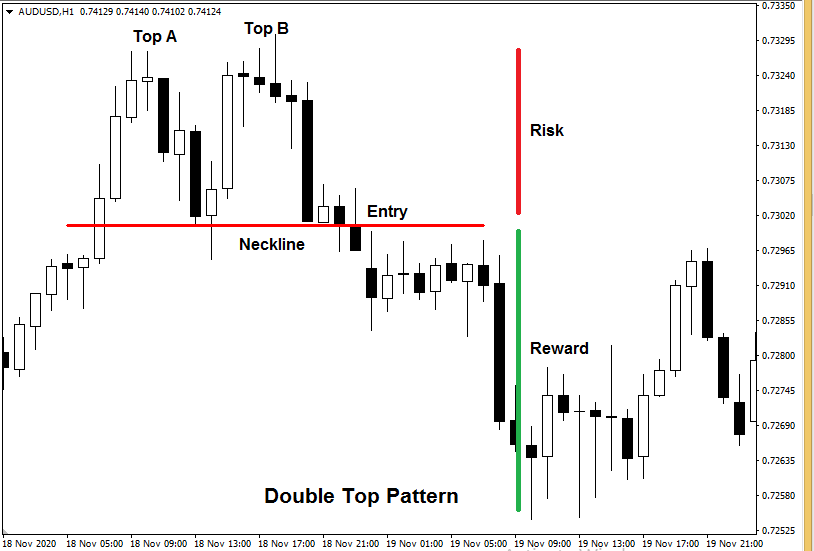
This pattern is a bearish reversal pattern that often signals a change from an uptrend to a downtrend. It begins when the price forms a swing high at Top A, showing strong upward movement at first. Then, the price retraces before moving up again to Top B, but this time it fails to create a new higher high. This failure shows weakening buying pressure, and the market starts to fall back toward the neckline area. The neckline is a horizontal line drawn between the lowest retracement points of Top A and Top B.
When both tops and the neckline clearly form, the pattern nears completion and signals potential reversal. A break below the neckline confirms this reversal and gives traders the best entry point for short positions. Stop loss levels are usually placed just above the previous swing high to limit risk exposure. Finally, profits are often targeted at twice the risk, giving a balanced and disciplined risk-reward ratio.
Double Bottom Pattern
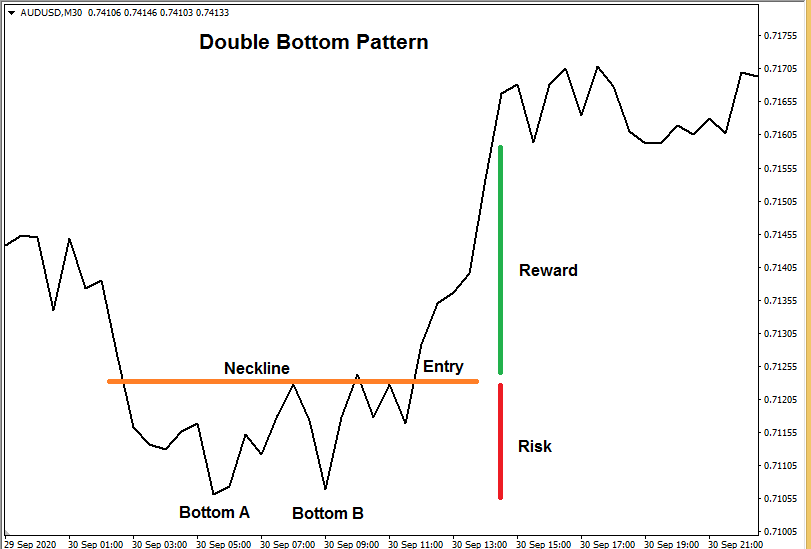
A double bottom pattern is a bullish reversal pattern that forms after a downtrend and signals potential upward movement. It is the opposite of the double top pattern and is popular among both new and advanced forex traders. The pattern is confirmed once the price breaks above the neckline after forming two clear bottoms, labeled A and B. Traders often place stop loss levels at the swing low of Bottom B to control risk effectively. Profit targets are usually set at twice the risk, maintaining a solid and disciplined risk-reward ratio.
The double top and double bottom patterns are also known as the “M” and “W” patterns, based on their visual shape. These formations help traders recognize when the market price is ready to reverse and start a new trend.
Triple Top Pattern
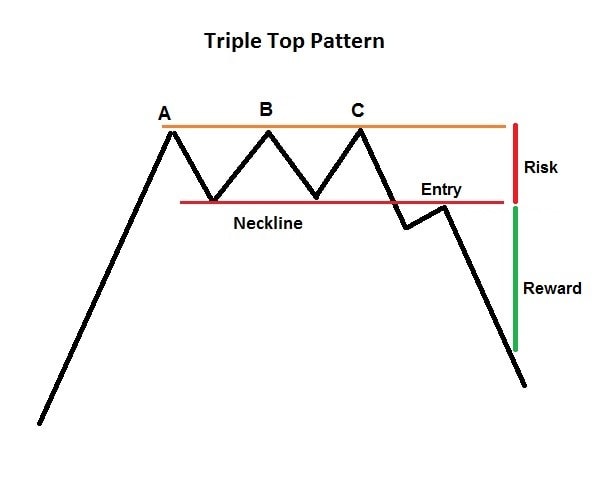
The triple top pattern is an extension of the double top pattern and signals a bearish reversal in the market. It forms when three consecutive tops appear at similar levels, showing strong resistance that the price cannot break. When the price breaks below the neckline, it confirms the completion of the pattern and trend reversal.
The entry point usually comes after the neckline break, which confirms the pattern’s strength. Risk is measured against the swing high at point C, ensuring controlled risk management. Finally, traders often set a profit target at a 1:2 risk-reward ratio, balancing safety and potential return.
Triple Bottom Pattern
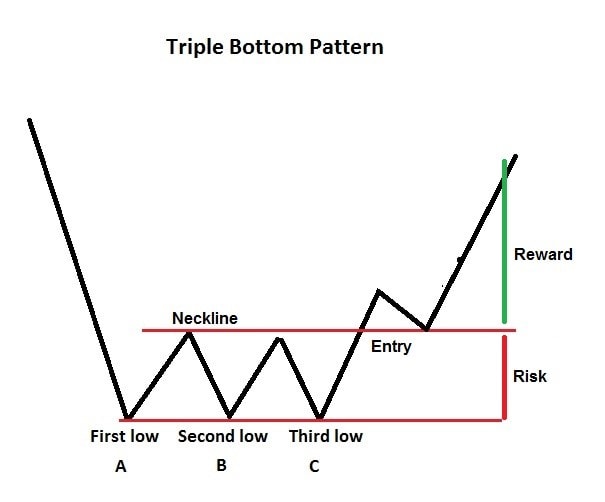
Triple bottoms are the opposite of the triple top pattern and signal a bullish reversal in the market. They form when the price creates three equal lows, showing strong support and growing buying pressure from traders. When the price breaks above the neckline, it confirms the pattern and the start of a potential upward trend.
Rounded Top Pattern
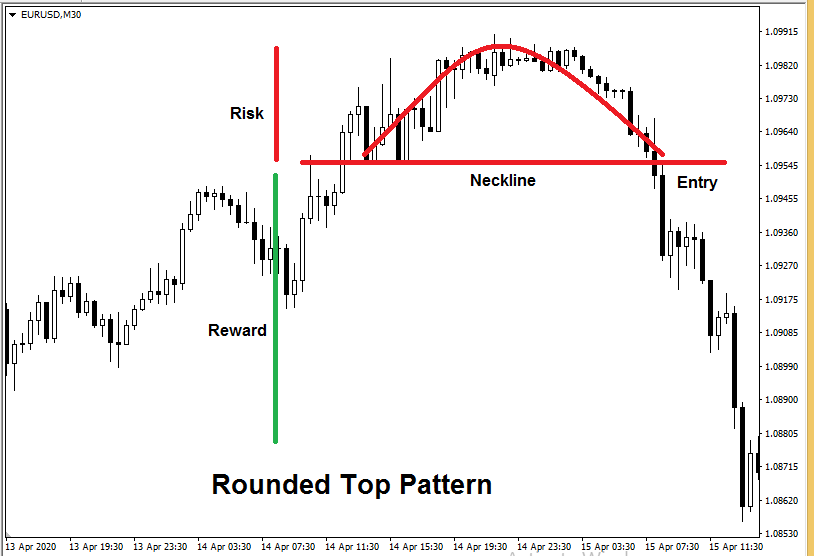
The rounded top pattern is a bearish reversal pattern that signals a possible end to an ongoing uptrend. During the uptrend, the price fails to move higher and stalls near its highest highs, showing market hesitation. Then, the price forms lower highs and lower lows, revealing a gradual loss of buying pressure. This smooth curve creates a rounded top, which visually shows the market’s shift from strength to weakness. The pattern is confirmed once the price breaks below the neckline, signaling a clear trend reversal.
Rounded Bottom Pattern
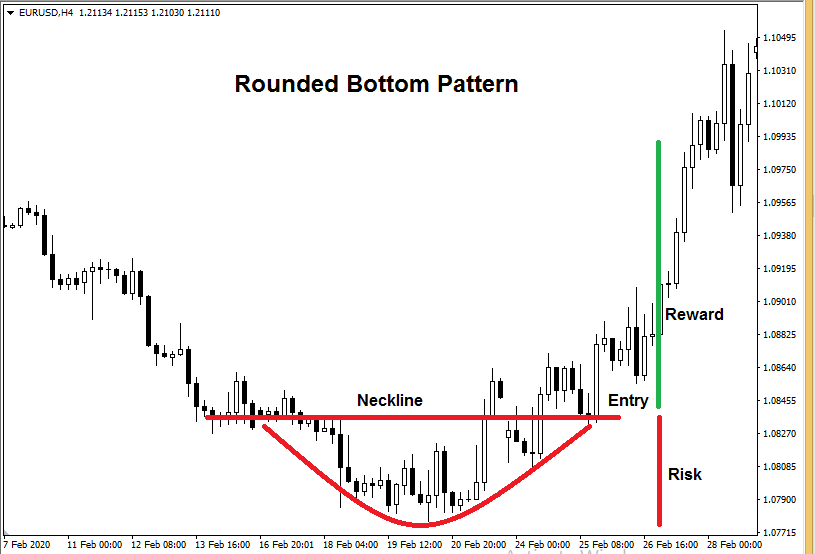
The rounded bottom pattern is a bullish reversal pattern and the opposite of the rounded top pattern. It forms when the price gradually shifts from a downtrend to an uptrend, showing steady buying pressure. Traders usually enter once the price breaks above the neckline, confirming the pattern’s strength. Stop losses are placed at the lowest low of the curve to manage risk effectively. Finally, profit targets are set using a balanced risk-to-reward ratio for steady and consistent gains.
Ascending Triangle Pattern
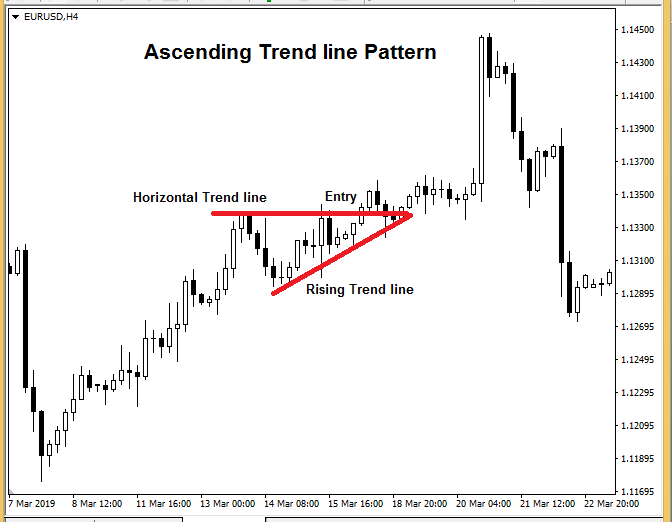
The ascending triangle is a bullish continuation pattern that forms through the connection of two key trend lines. The first is a flat or horizontal resistance line, showing where sellers consistently stop price advances. Then the second is an ascending trend line, revealing that buyers are gradually pushing the price higher. So the meeting point of these lines creates a rising triangle, showing growing buying pressure in the market.
The pattern completes when the price breaks above the triangle, confirming continued upward momentum. Traders usually place stop losses at the previous swing low inside the triangle to limit potential losses. Profit targets are then set using a 1:2 risk-reward ratio, allowing for strong gains with controlled risk.
Descending Triangle Pattern
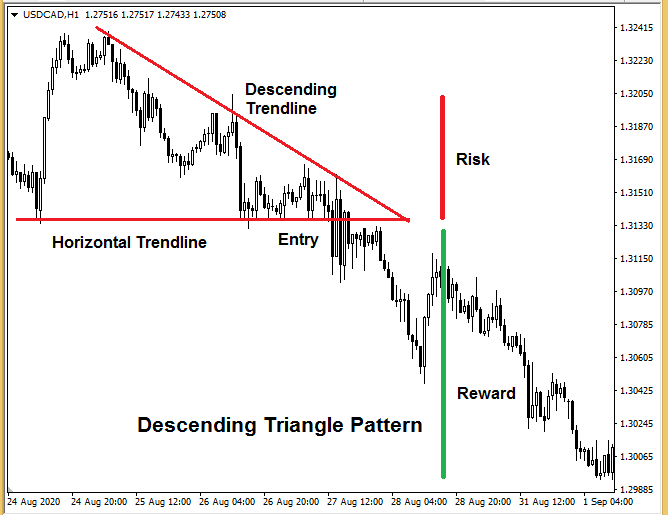
The descending triangle pattern is a bearish continuation pattern that often appears during a downtrend. As the market pauses, sellers prepare to push prices even lower once momentum returns.
This setup forms when a horizontal support line meets a descending resistance line, showing rising selling pressure. When the price breaks below the support line, it confirms the continuation of the bearish trend. These patterns often give traders ideal moments to book partial profits or add positions to existing trades.
Falling Wedge Pattern
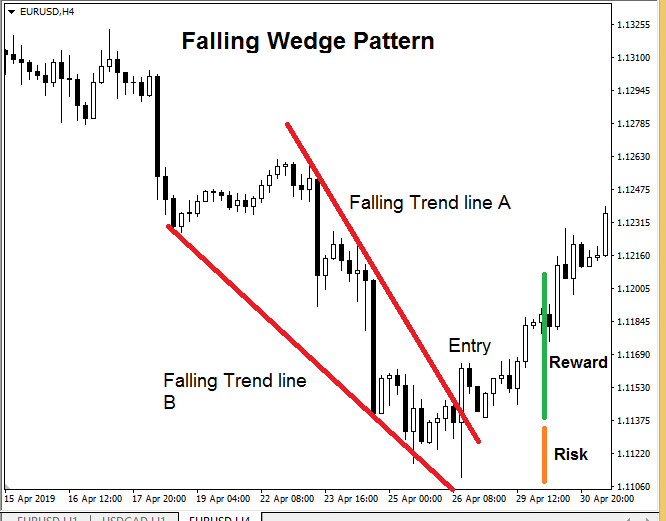
The falling wedge pattern is a bullish reversal pattern that signals a potential shift from a downtrend to an uptrend. It forms between two falling trend lines, where prices move within the narrowing range of those lines. These lines converge gradually but do not meet, showing that selling pressure is losing strength over time.
The pattern is confirmed once the price breaks above the upper falling trend line A with a strong candle close. This breakout signals that buyers are taking control and momentum is turning upward. Stop losses are usually placed below the previous low to protect against false signals. Finally, traders often set profit targets at a 1:2 risk-reward ratio for a balanced and consistent approach.
Rising Wedge Pattern
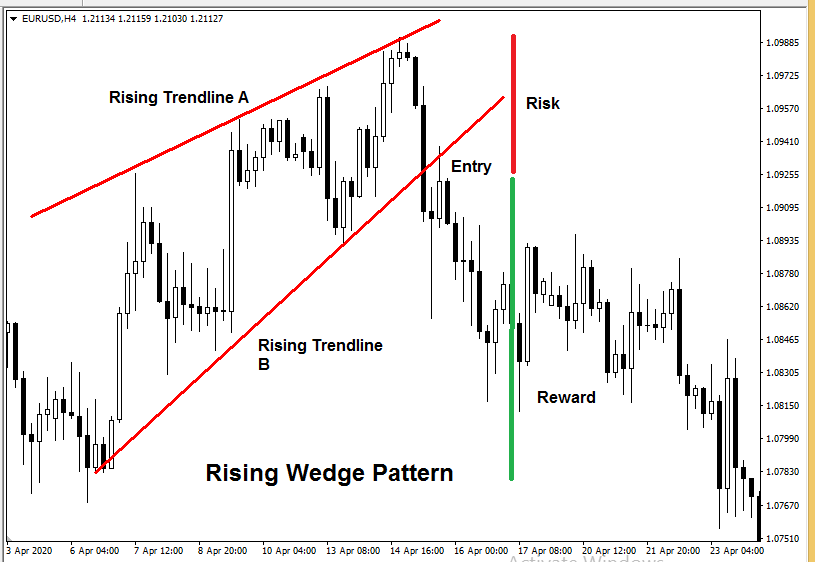
The rising wedge pattern is a bearish reversal pattern that often appears near the end of an uptrend. It forms between two rising trend lines that gradually converge, signaling weakening buying pressure in the market. Although prices move upward, each new high becomes smaller, showing that momentum is fading.
The entry point is confirmed once the price breaks below the lower trend line B, marking the start of a downturn. Stop losses are typically placed above the previous high to limit potential losses. Traders then aim for profit targets with a strong risk-reward ratio, allowing for steady and controlled gains.
Rising Pennant Pattern
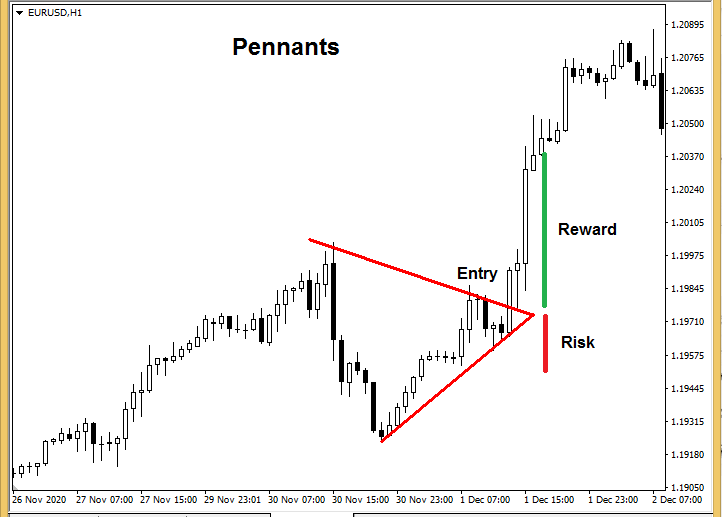
Pennants are continuation patterns that signal a pause before the trend continues in the same direction. Depending on where they form, they can be either bullish or bearish in nature.
In a rising pennant pattern, prices move within two converging trend lines during an ongoing uptrend. This happens as traders take partial profits, causing a brief consolidation phase in the market. The tightening price range forms a small triangle shape, showing balance between buyers and sellers.
The pattern is confirmed when the price breaks above the pennant with a strong candle close. After this breakout, prices usually continue in the same upward direction as the previous trend. This move often gives traders a clear entry point to ride the next wave of momentum.
Falling Pennant Pattern
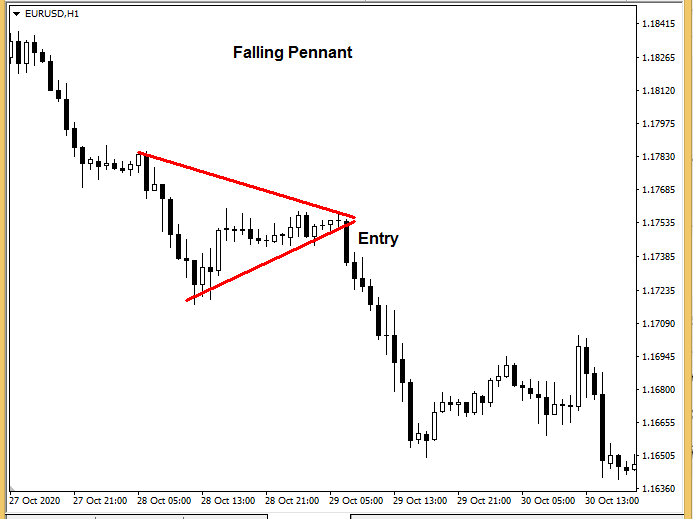
A falling pennant is a bearish continuation pattern that forms during an ongoing downtrend. It appears when the market briefly pauses, creating a small consolidation before continuing downward. This setup forms within two converging trend lines, showing a short period of market indecision.
Once the price breaks below the lower trend line, it confirms the continuation of the bearish trend. Both new and experienced traders can trade this pattern with confidence when proper risk management is used. Since pennants form frequently, they often provide great entry points to strengthen existing positions. Many traders take advantage of these setups to add multiple trades and ride the trend more profitably.
Forex Chart Patterns Cheat Sheet
A Forex chart patterns cheat sheet is a helpful guide that organizes the most common trading setups in one place. It gives traders a clear picture of how patterns form and what signals to watch during price movement. Having this visual summary helps identify entry points, stop losses, and profit targets with more confidence.
By keeping a cheat sheet nearby, traders can react faster to market changes and avoid second-guessing their analysis. It serves both beginners learning pattern basics and experienced traders refining their trading strategy. For convenience, many traders download a Forex patterns PDF to use as their personal trading reference.
Forex Candlestick Patterns
Forex candlestick patterns play a major role in technical analysis, helping traders read market sentiment and predict future movement. Each candle shows the story of buying and selling pressure, revealing whether bulls or bears control the session. By combining candlestick patterns with trading chart patterns, traders can confirm signals and avoid false entries.
Some candles show a bullish flag pattern or a strong bearish pattern, marking possible reversals or continuation setups. Others, like the symmetrical triangle, reflect temporary pauses before the next move begins. When analyzed correctly, these candles guide traders to set accurate price targets and improve their trading strategy.
Also Read:
Conclusion
Best technical traders always look for clues in the charts and use the charts to make their trading decisions. Chart patterns provide the traders with invaluable insight and assist the traders in spotting the best entry points. It's always recommended to keep a chart pattern cheat sheet handy in a pdf. For quick reference, you can download the 28 Forex Patterns pdf file here.
FAQ's
1. What are the most reliable forex candlestick patterns for beginners?
Beginners often start with simple and effective candlestick patterns like the bullish engulfing pattern, bearish engulfing pattern, and doji. These patterns are easy to identify and help traders understand market sentiment before making trading decisions.
2. How do candlestick patterns improve technical analysis?
Candlestick patterns add depth to technical analysis by showing real-time price reactions at support and resistance levels. They help confirm trading chart patterns, filter out false signals, and guide traders toward stronger entry points and price targets.
3. Can candlestick patterns be used with other trading strategies?
Yes, traders often combine candlestick patterns with tools like trend lines, moving averages, or symmetrical triangles. This combination improves accuracy, enhances risk management, and builds confidence in both reversal and continuation setups.