Hey, what’s up guys, traders. It’s Ezekiel Chew here.
Let me hit you with this.
Most traders think they know how to use Bollinger Bands, but the Bands are actually the reason they keep blowing trades. They chase breakouts after the move is already gone. They short reversals before the market is ready. And they miss the high-probability entries that are hiding right in front of them.
Here’s the truth.
Bollinger Bands aren’t just lines on a chart.
They’re the market’s pressure system. They show you when volatility is about to explode, when momentum is dying, and where the real sniper entries are sitting.
And when you understand that, you stop trading like everyone else.
Today, I’m breaking down the exact Bollinger Bands strategy I’ve used to pull six-figure trades. A simple, powerful, and repeatable approach.
Once you see this, you’ll never look at Bollinger Bands the same way again.
📺 Watch the full breakdown in this video:
What Is Bollinger Bands?
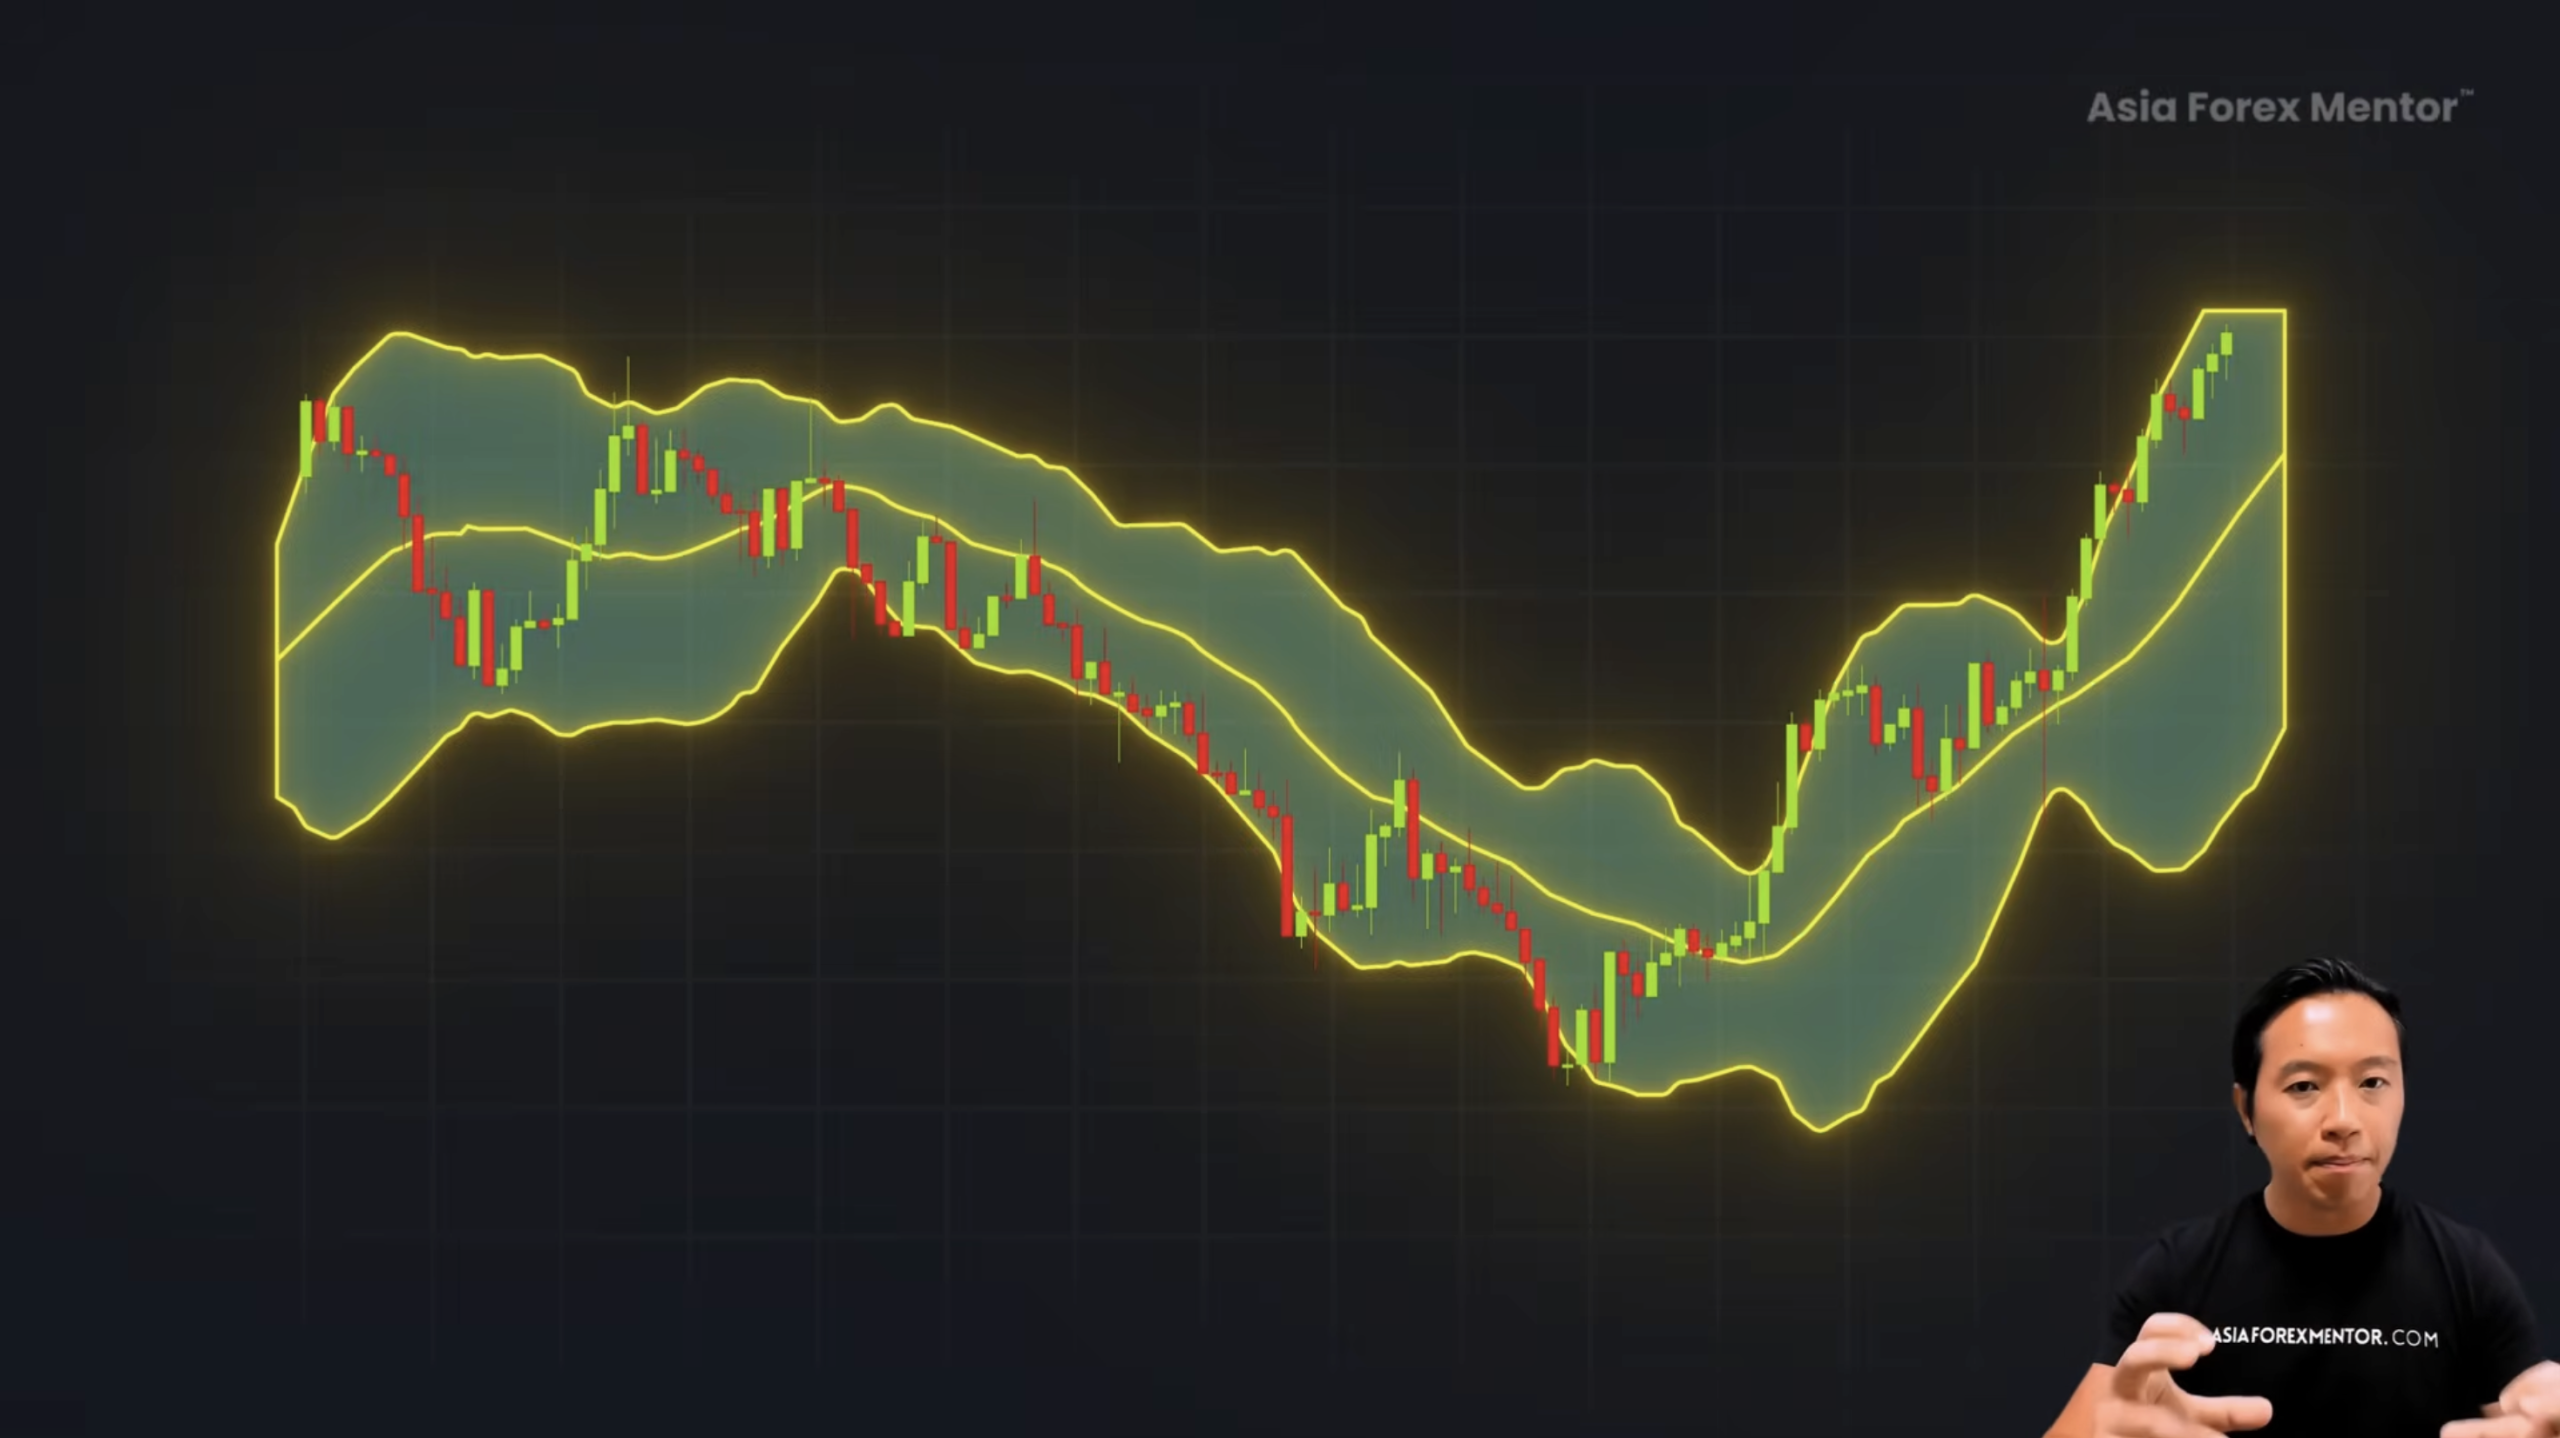
Okay, so first things first. Bollinger Bands.
A lot of traders talk about them like they’re some secret formula. But when you strip it down, it’s really just three lines wrapped around price. The middle line is a simple moving average. The outer bands stretch and shrink based on volatility.
That’s the framework. Clear. Simple. Nothing mystical.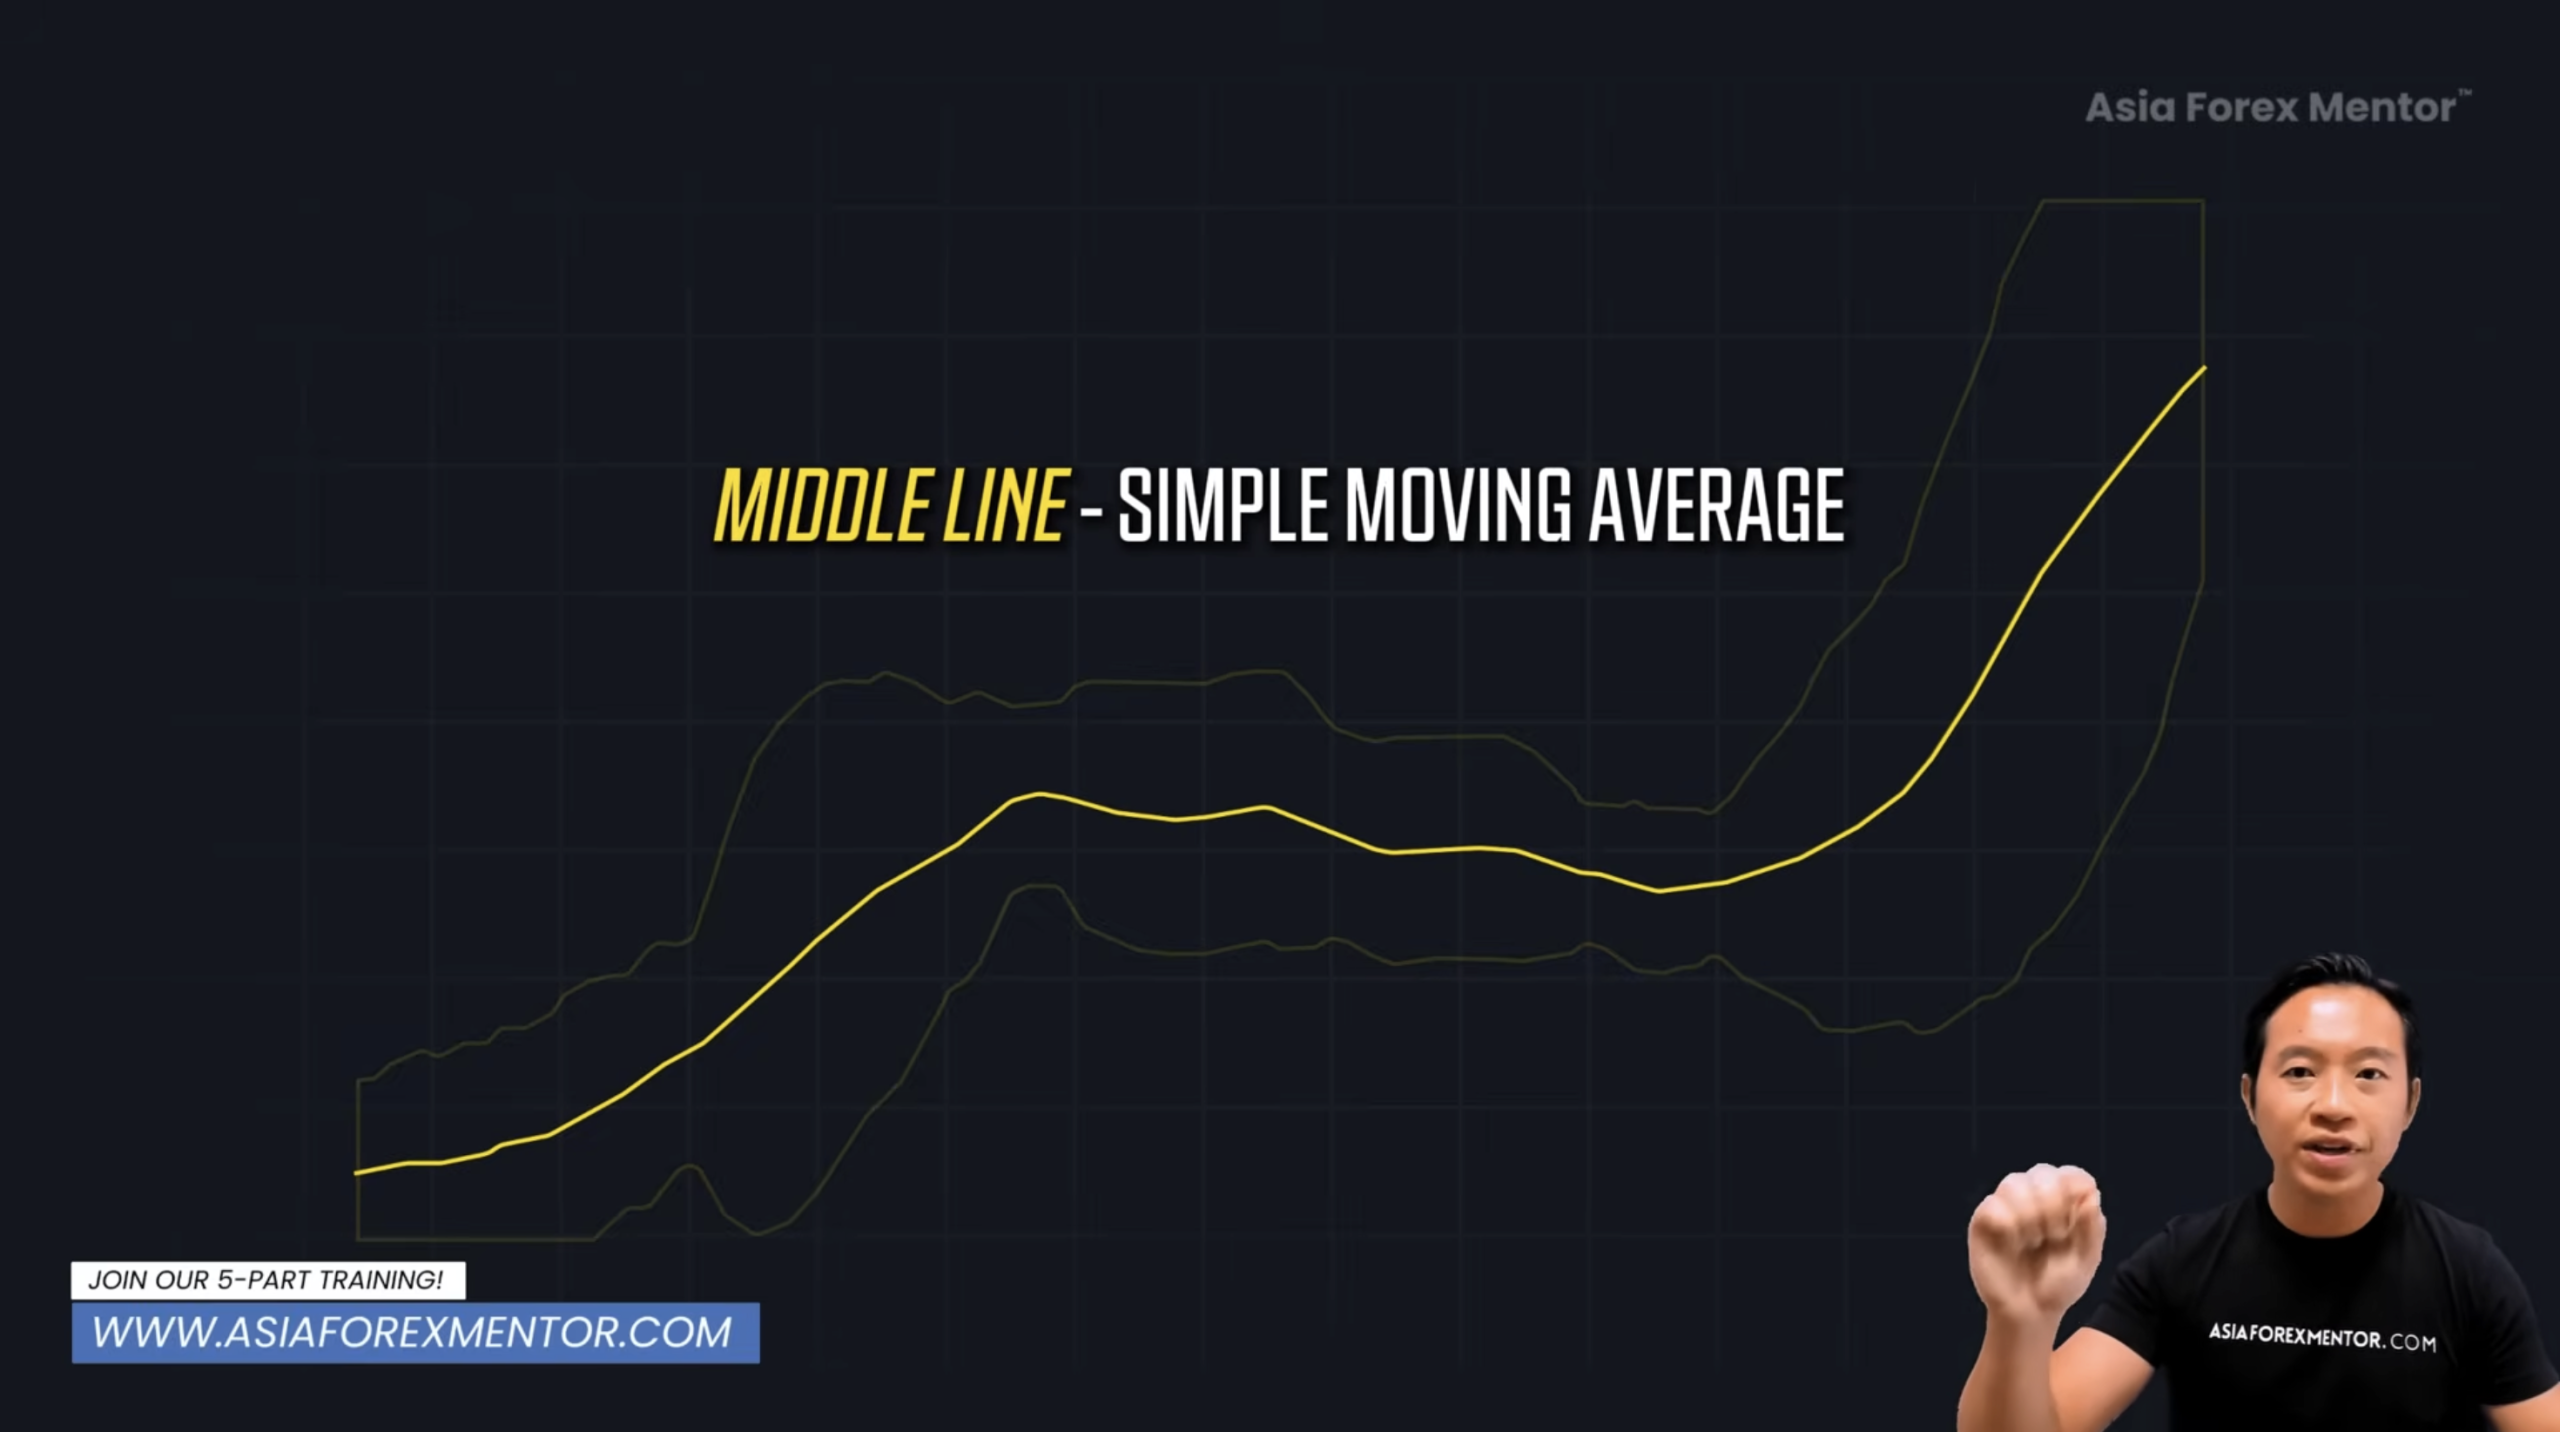
But here’s what most people miss.
Those lines breathe with the market. They tighten when price quiets down, like a spring slowly coiling. They widen when momentum bursts, like pressure finally being released.
And it’s never random.
There’s a rhythm to it. A constant cycle of tension and release. Once you learn to read that pulse, you stop reacting blindly. You start anticipating.
So how do you actually use this to know when the market is about to explode and leave everyone else chasing?
That’s where the first strategy comes in.
Strategy 1: Breakouts – The Squeeze Before the Explosion
We call this the squeeze, because that’s exactly what happens.
The market gets compressed into a tight range, and sooner or later, it bursts. Bollinger Bands give you a front-row seat to that moment.
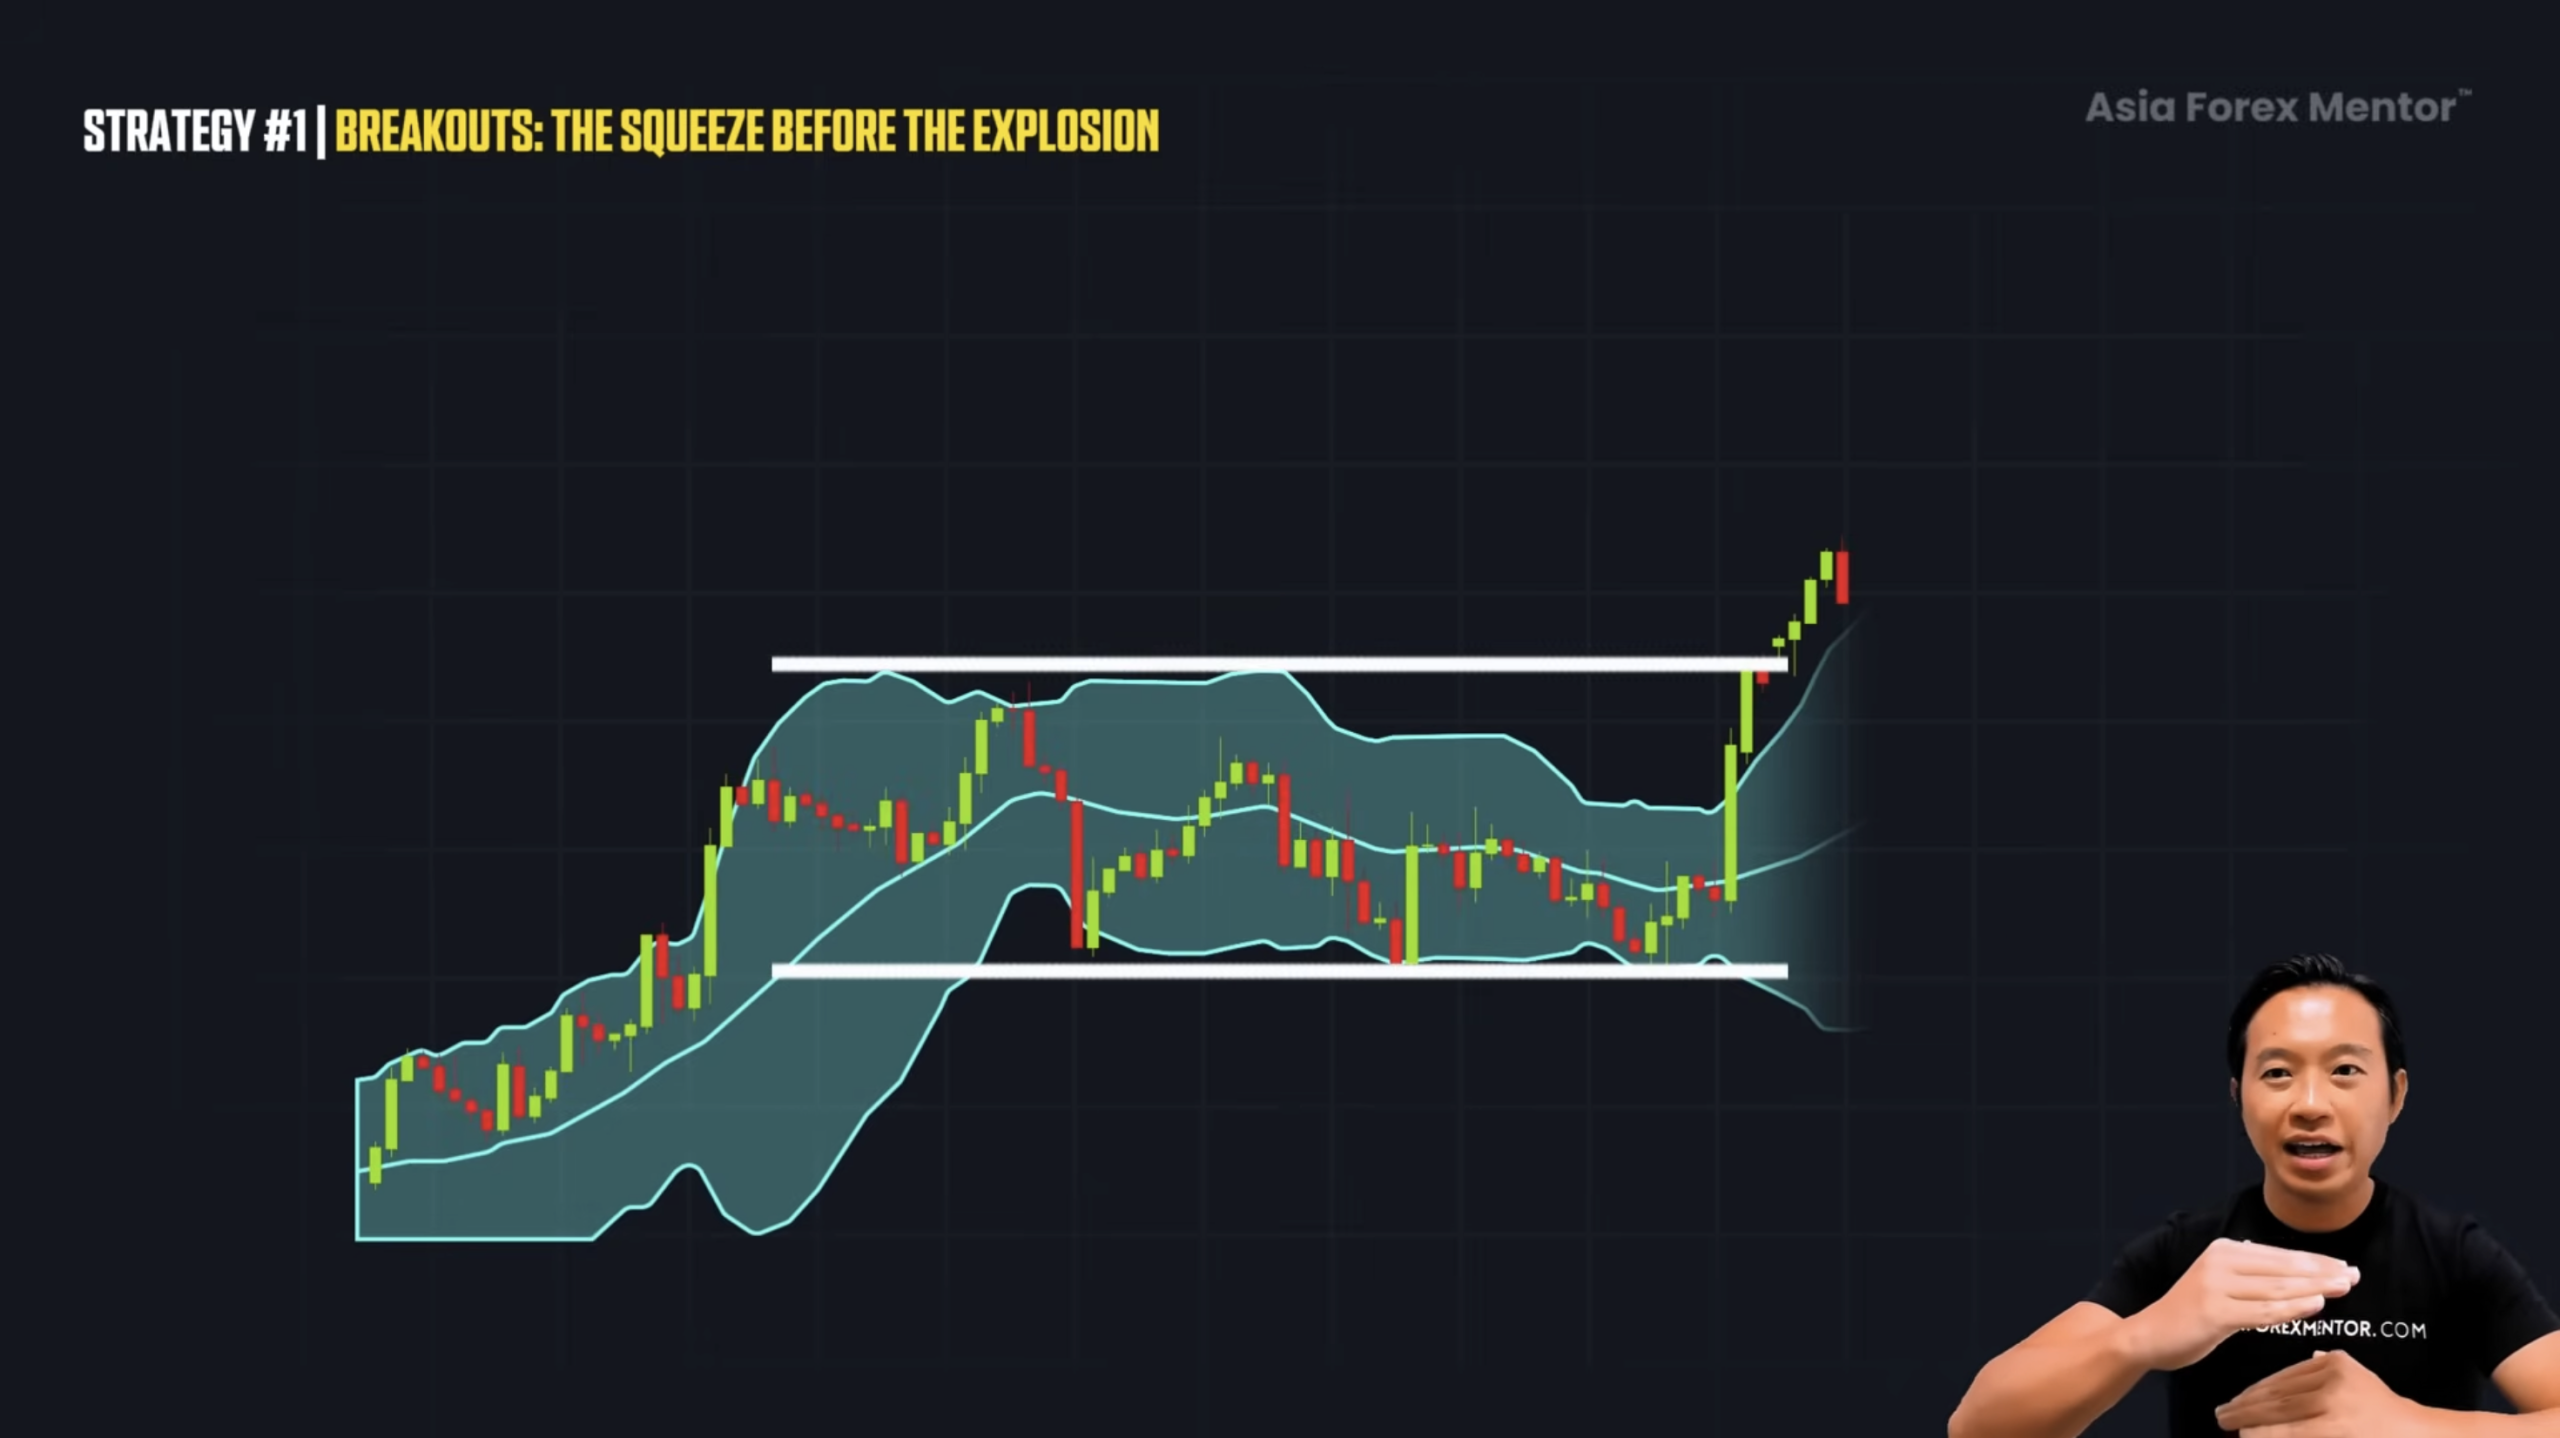
During these narrow phases, price drifts sideways. The bands act like invisible walls of support and resistance, holding price in a tight box. Buyers and sellers are testing each other, but no one has real control yet.
Then suddenly, a strong candle breaks out.
A green candle shoots through the upper band, or a red candle slices through the lower band. That decisive close outside the band is the release of energy.
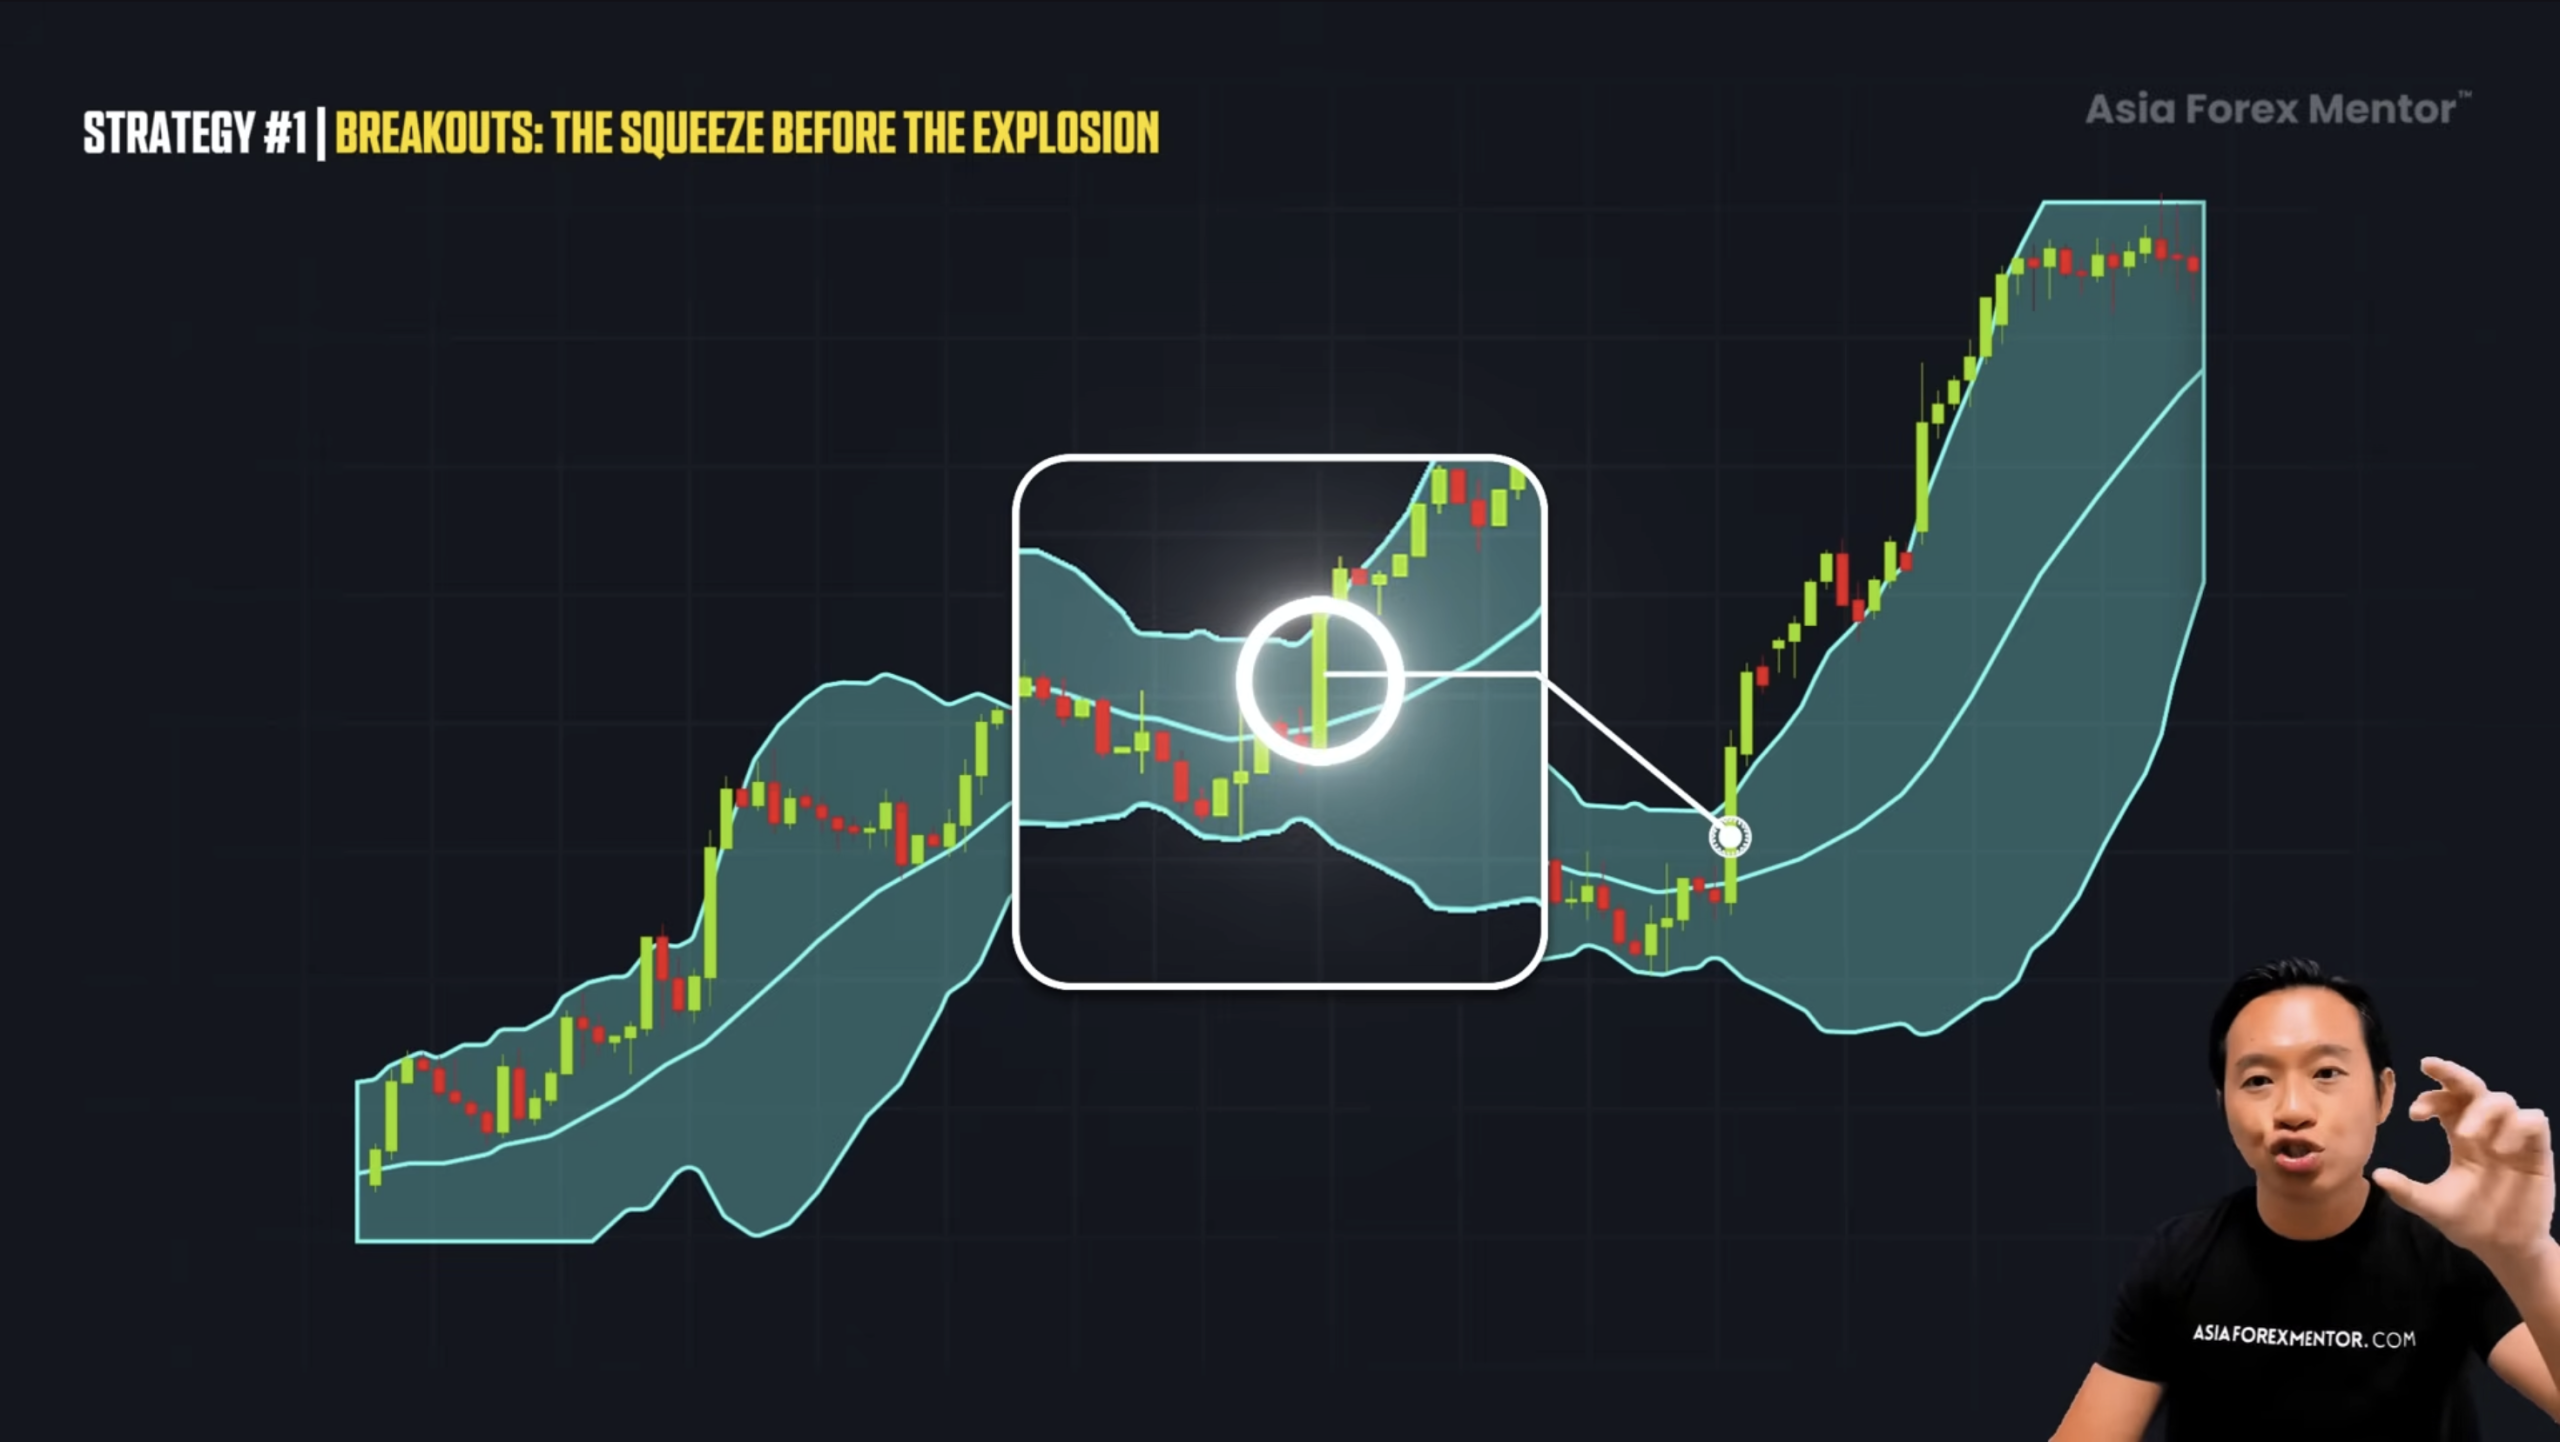
The upper band now acts as a support area where price moves through. Price can still break back down, but the momentum has already shifted upward.
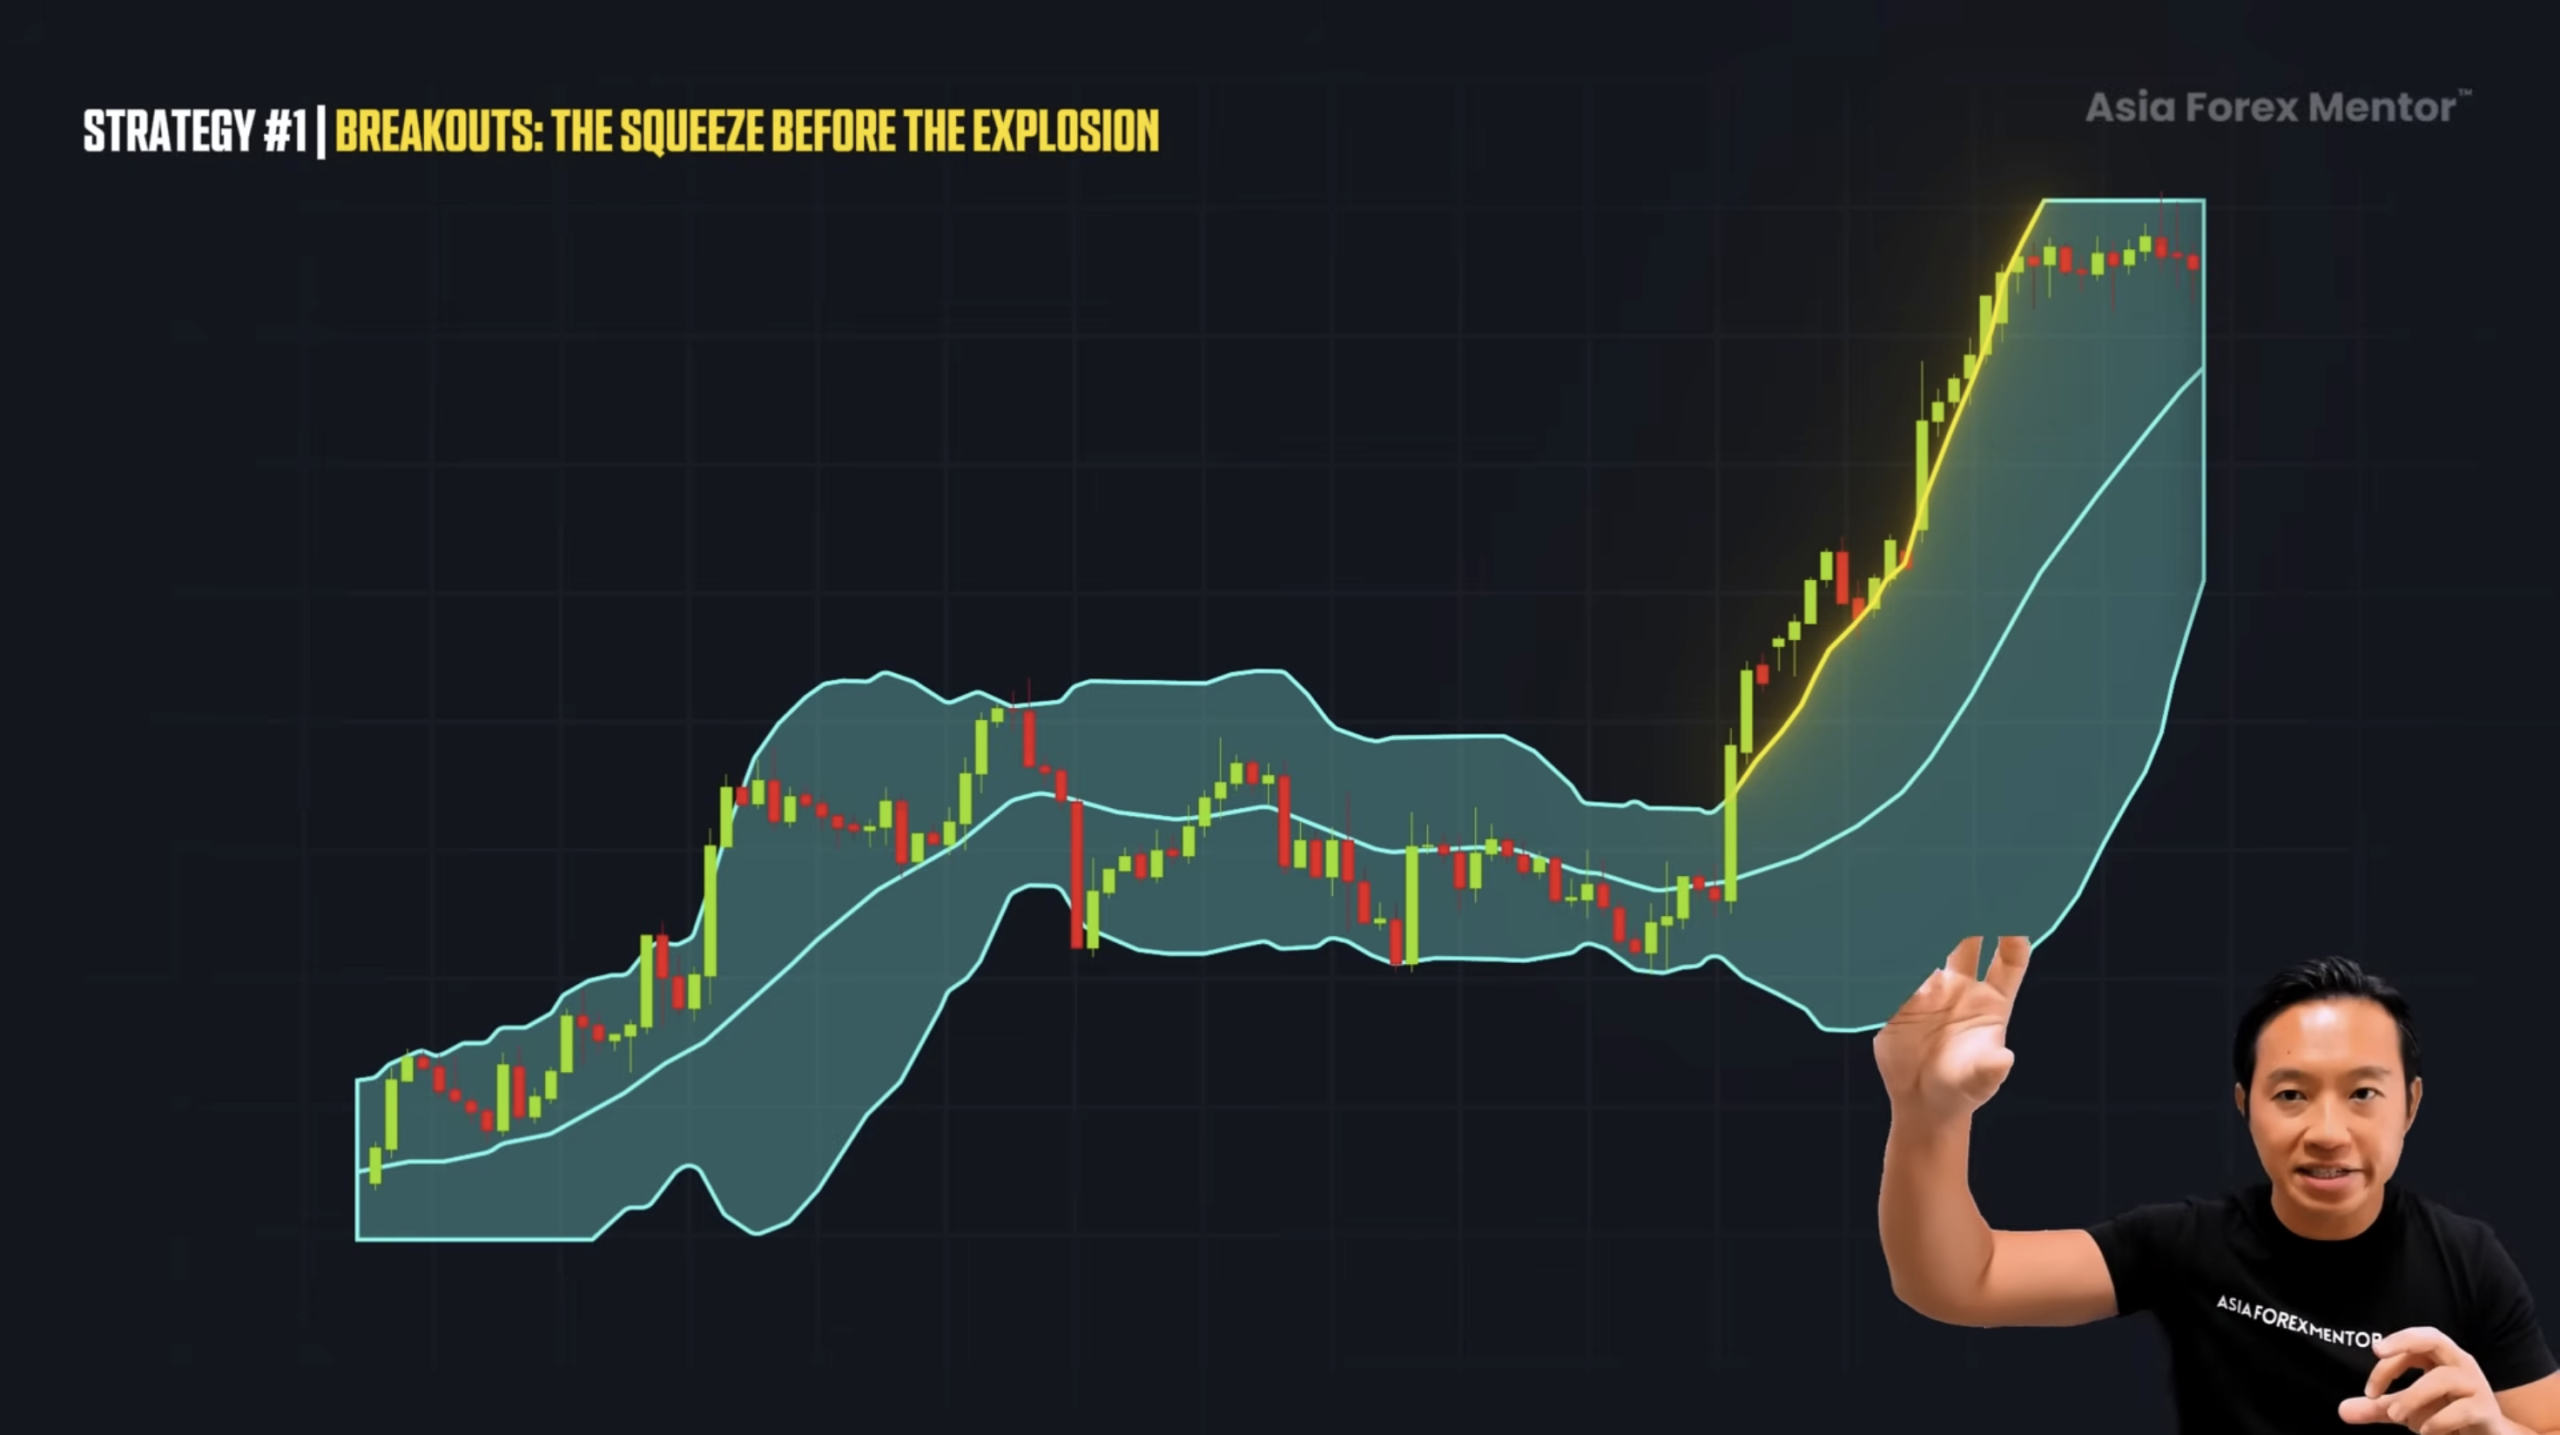
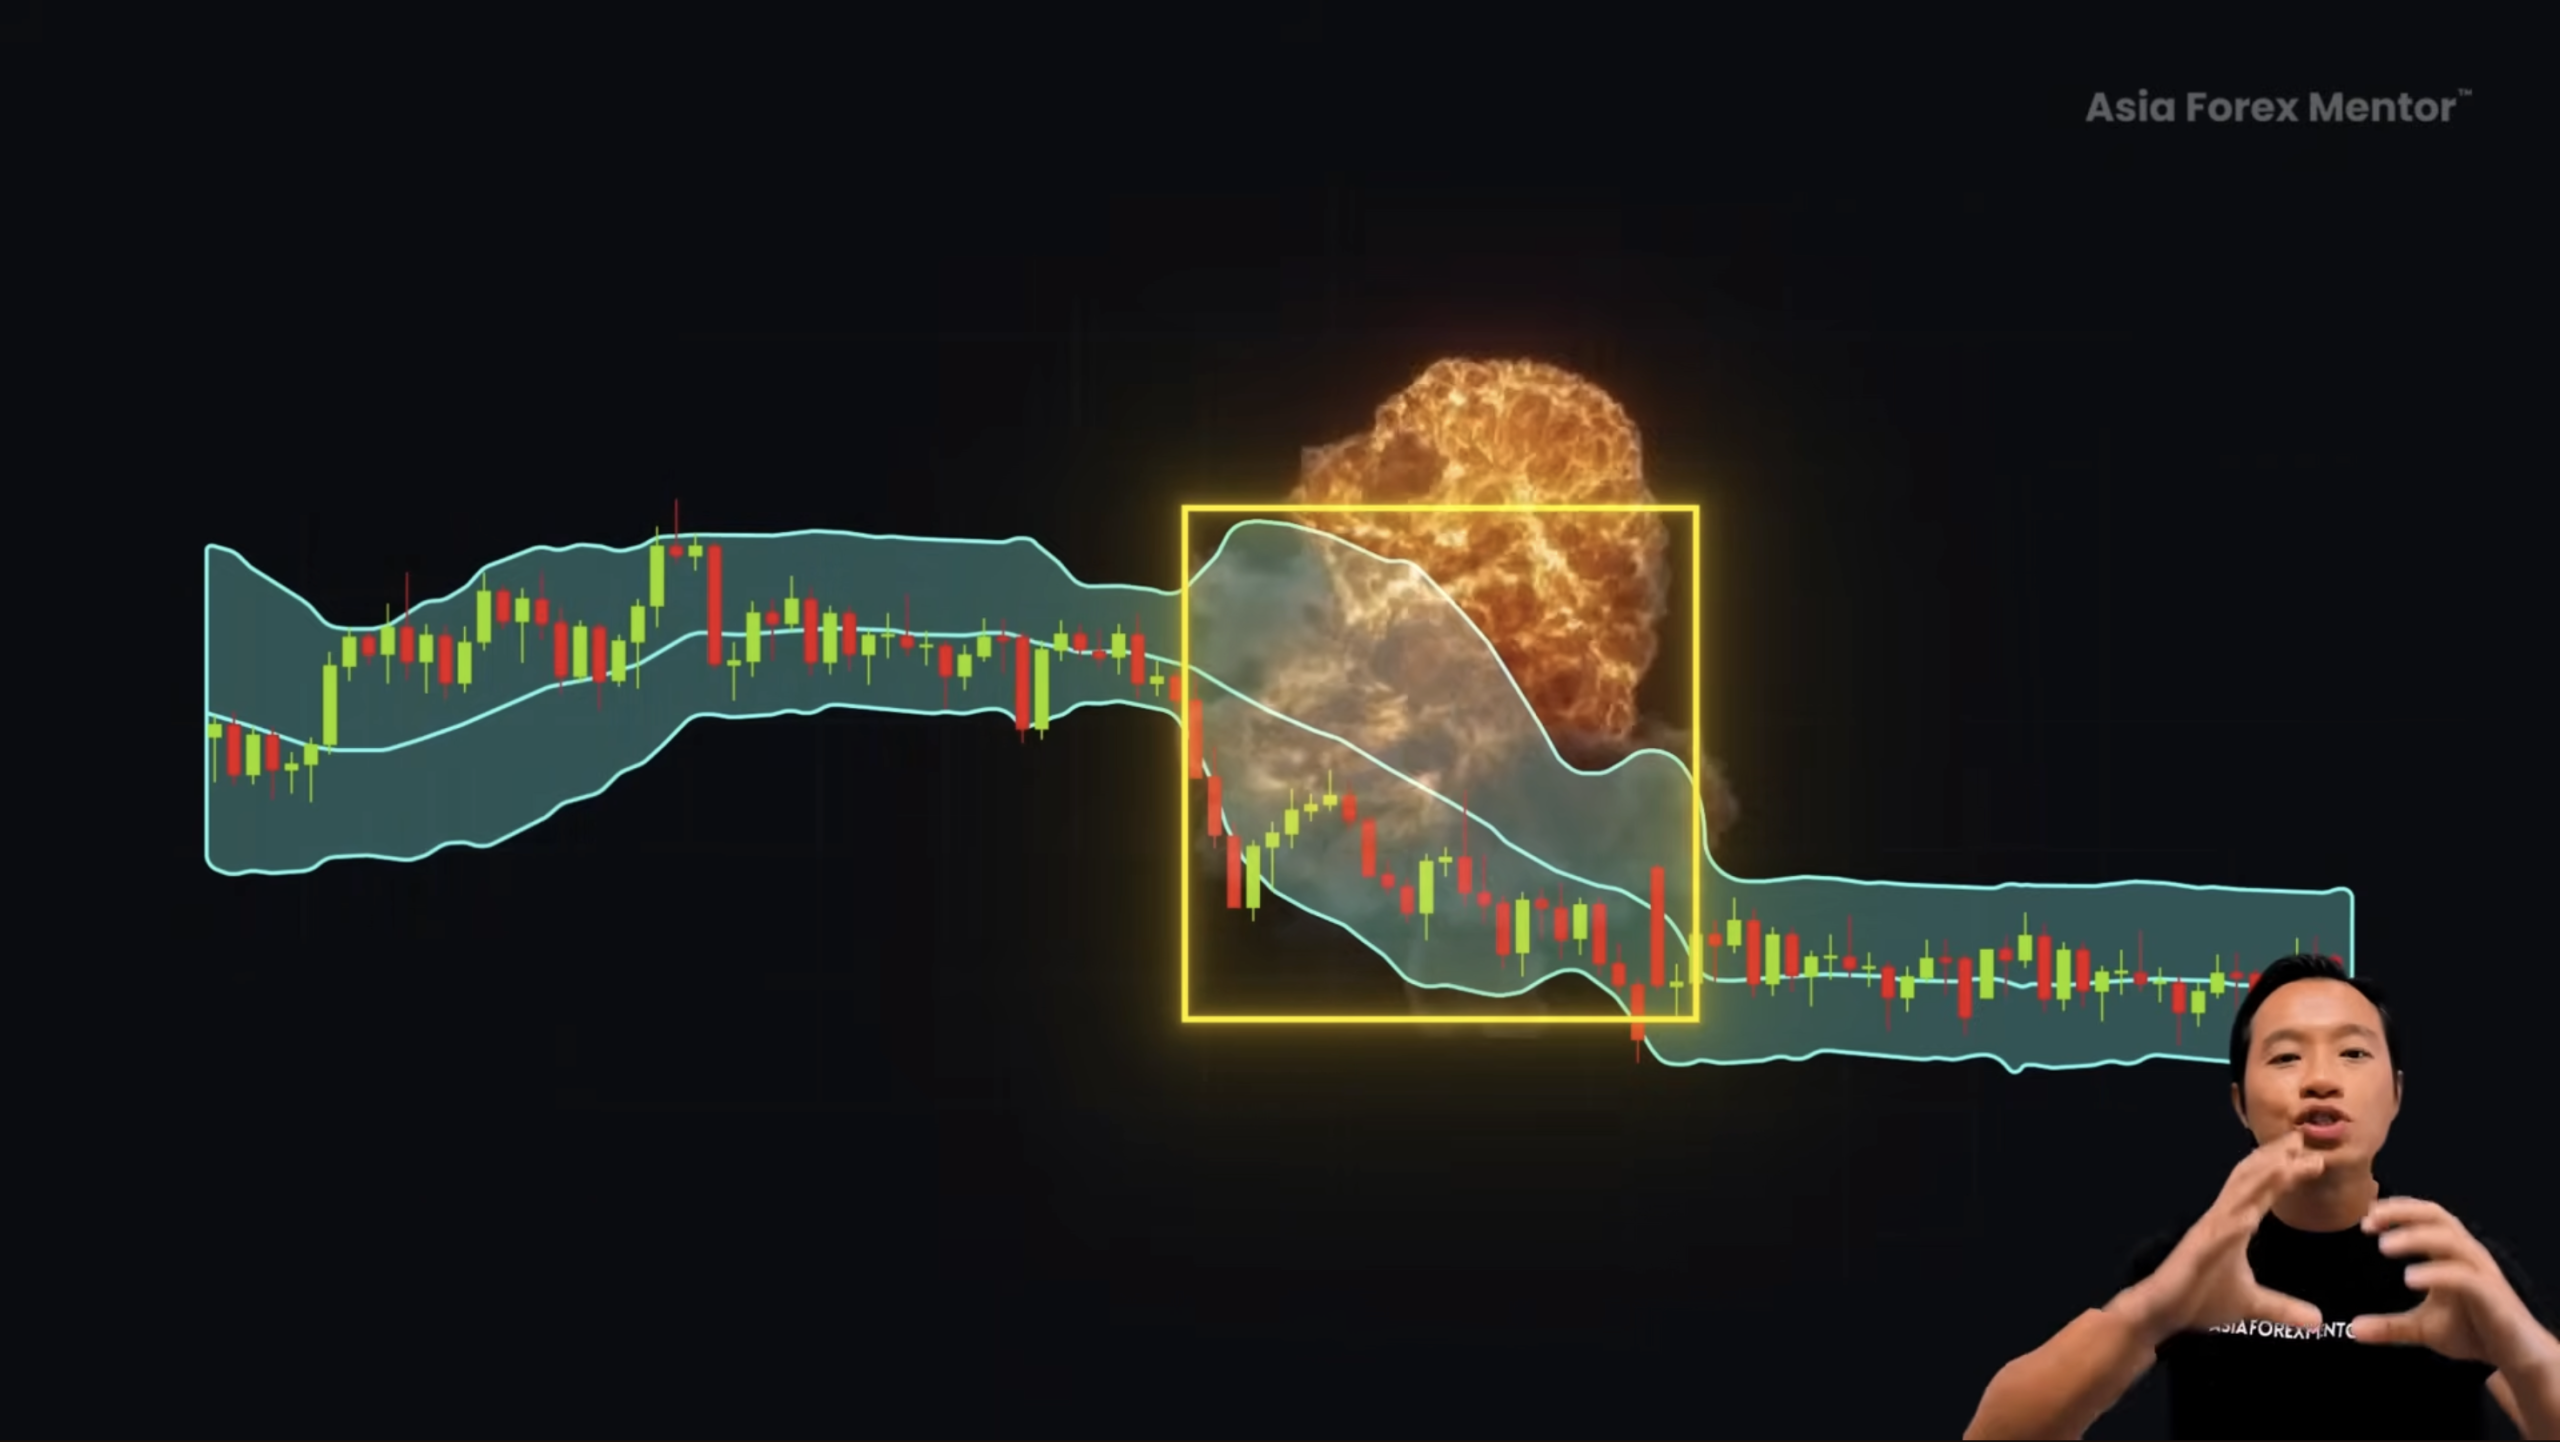
In a downward move, it’s the same idea but flipped. Price sticks close to the lower band. This is the moment where the Bollinger Bands widen. And when that happens, it signals that the breakout has transitioned into what we call a high-volatility phase.
Now here’s something important to understand.
Price doesn’t have to stay outside the band the whole time. It can go back inside the band and then come back out again. But the key moment is that transition from a narrow range into expansion. That’s where the market shifts gears into high volatility.
So how do we enter?
First, inside the narrow range, there must not be any closes above or below the range.
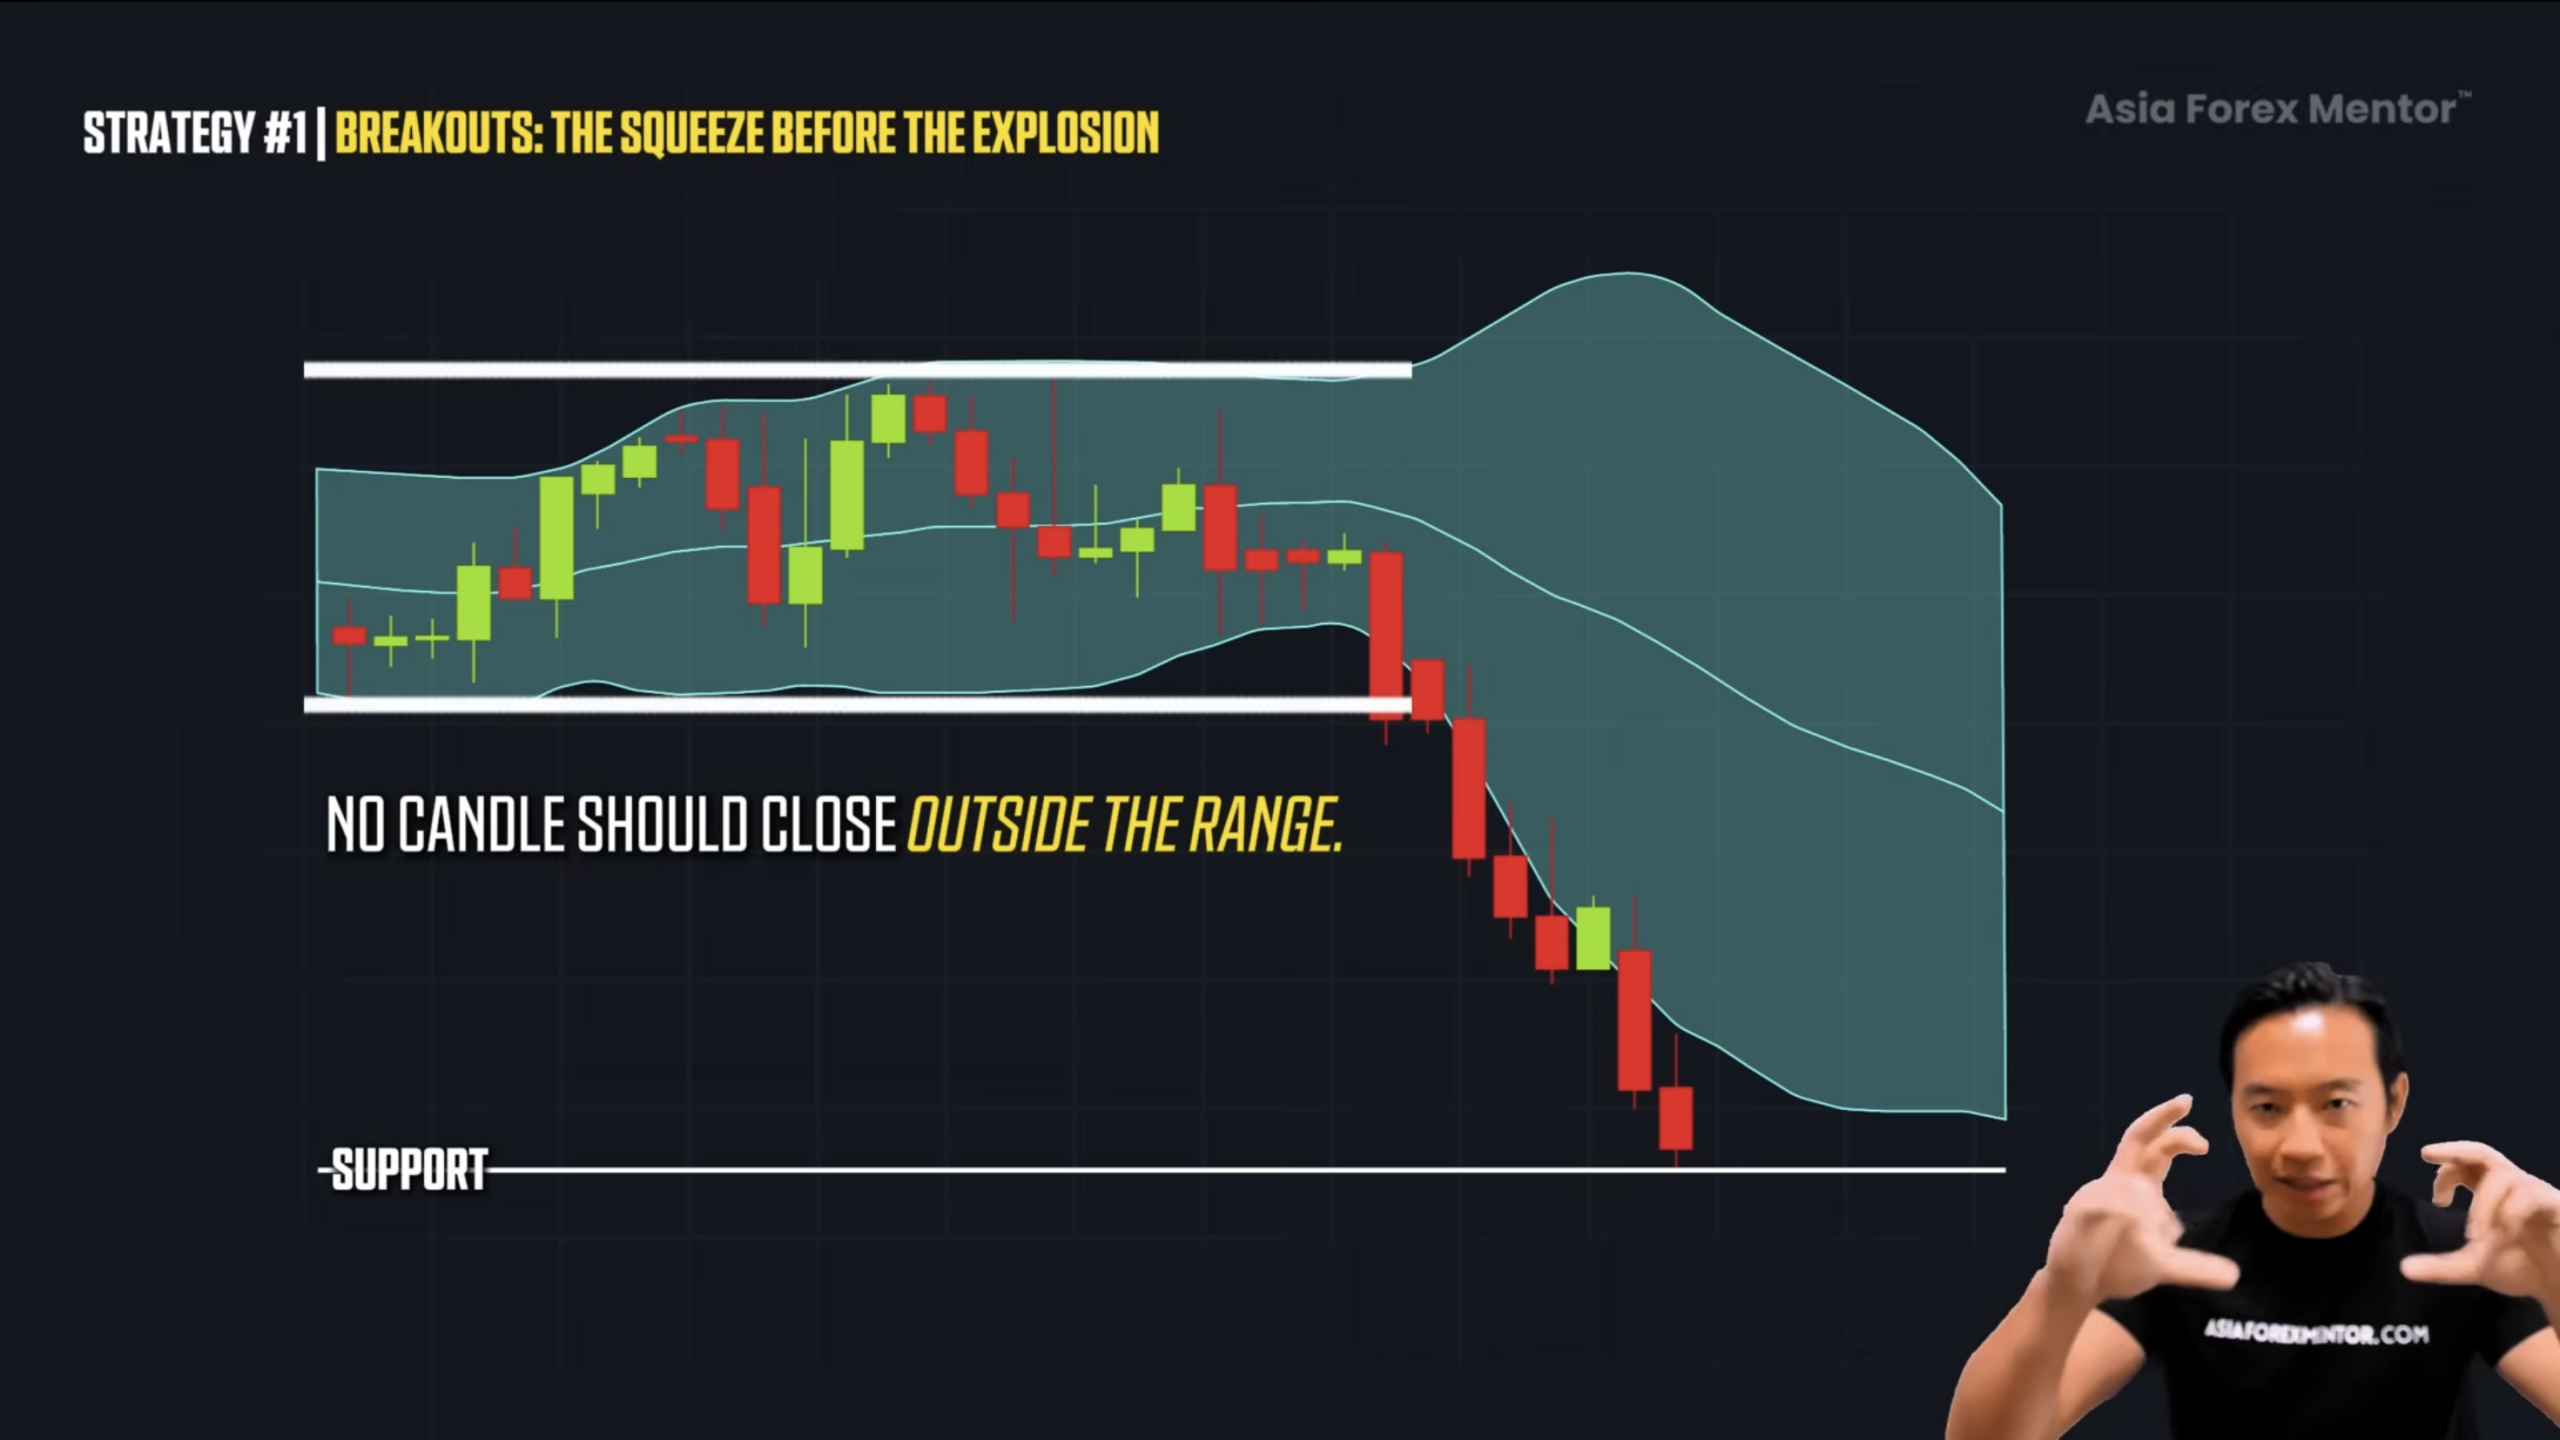
We need to make sure price has not broken that level before. This increases the probability of the trade.
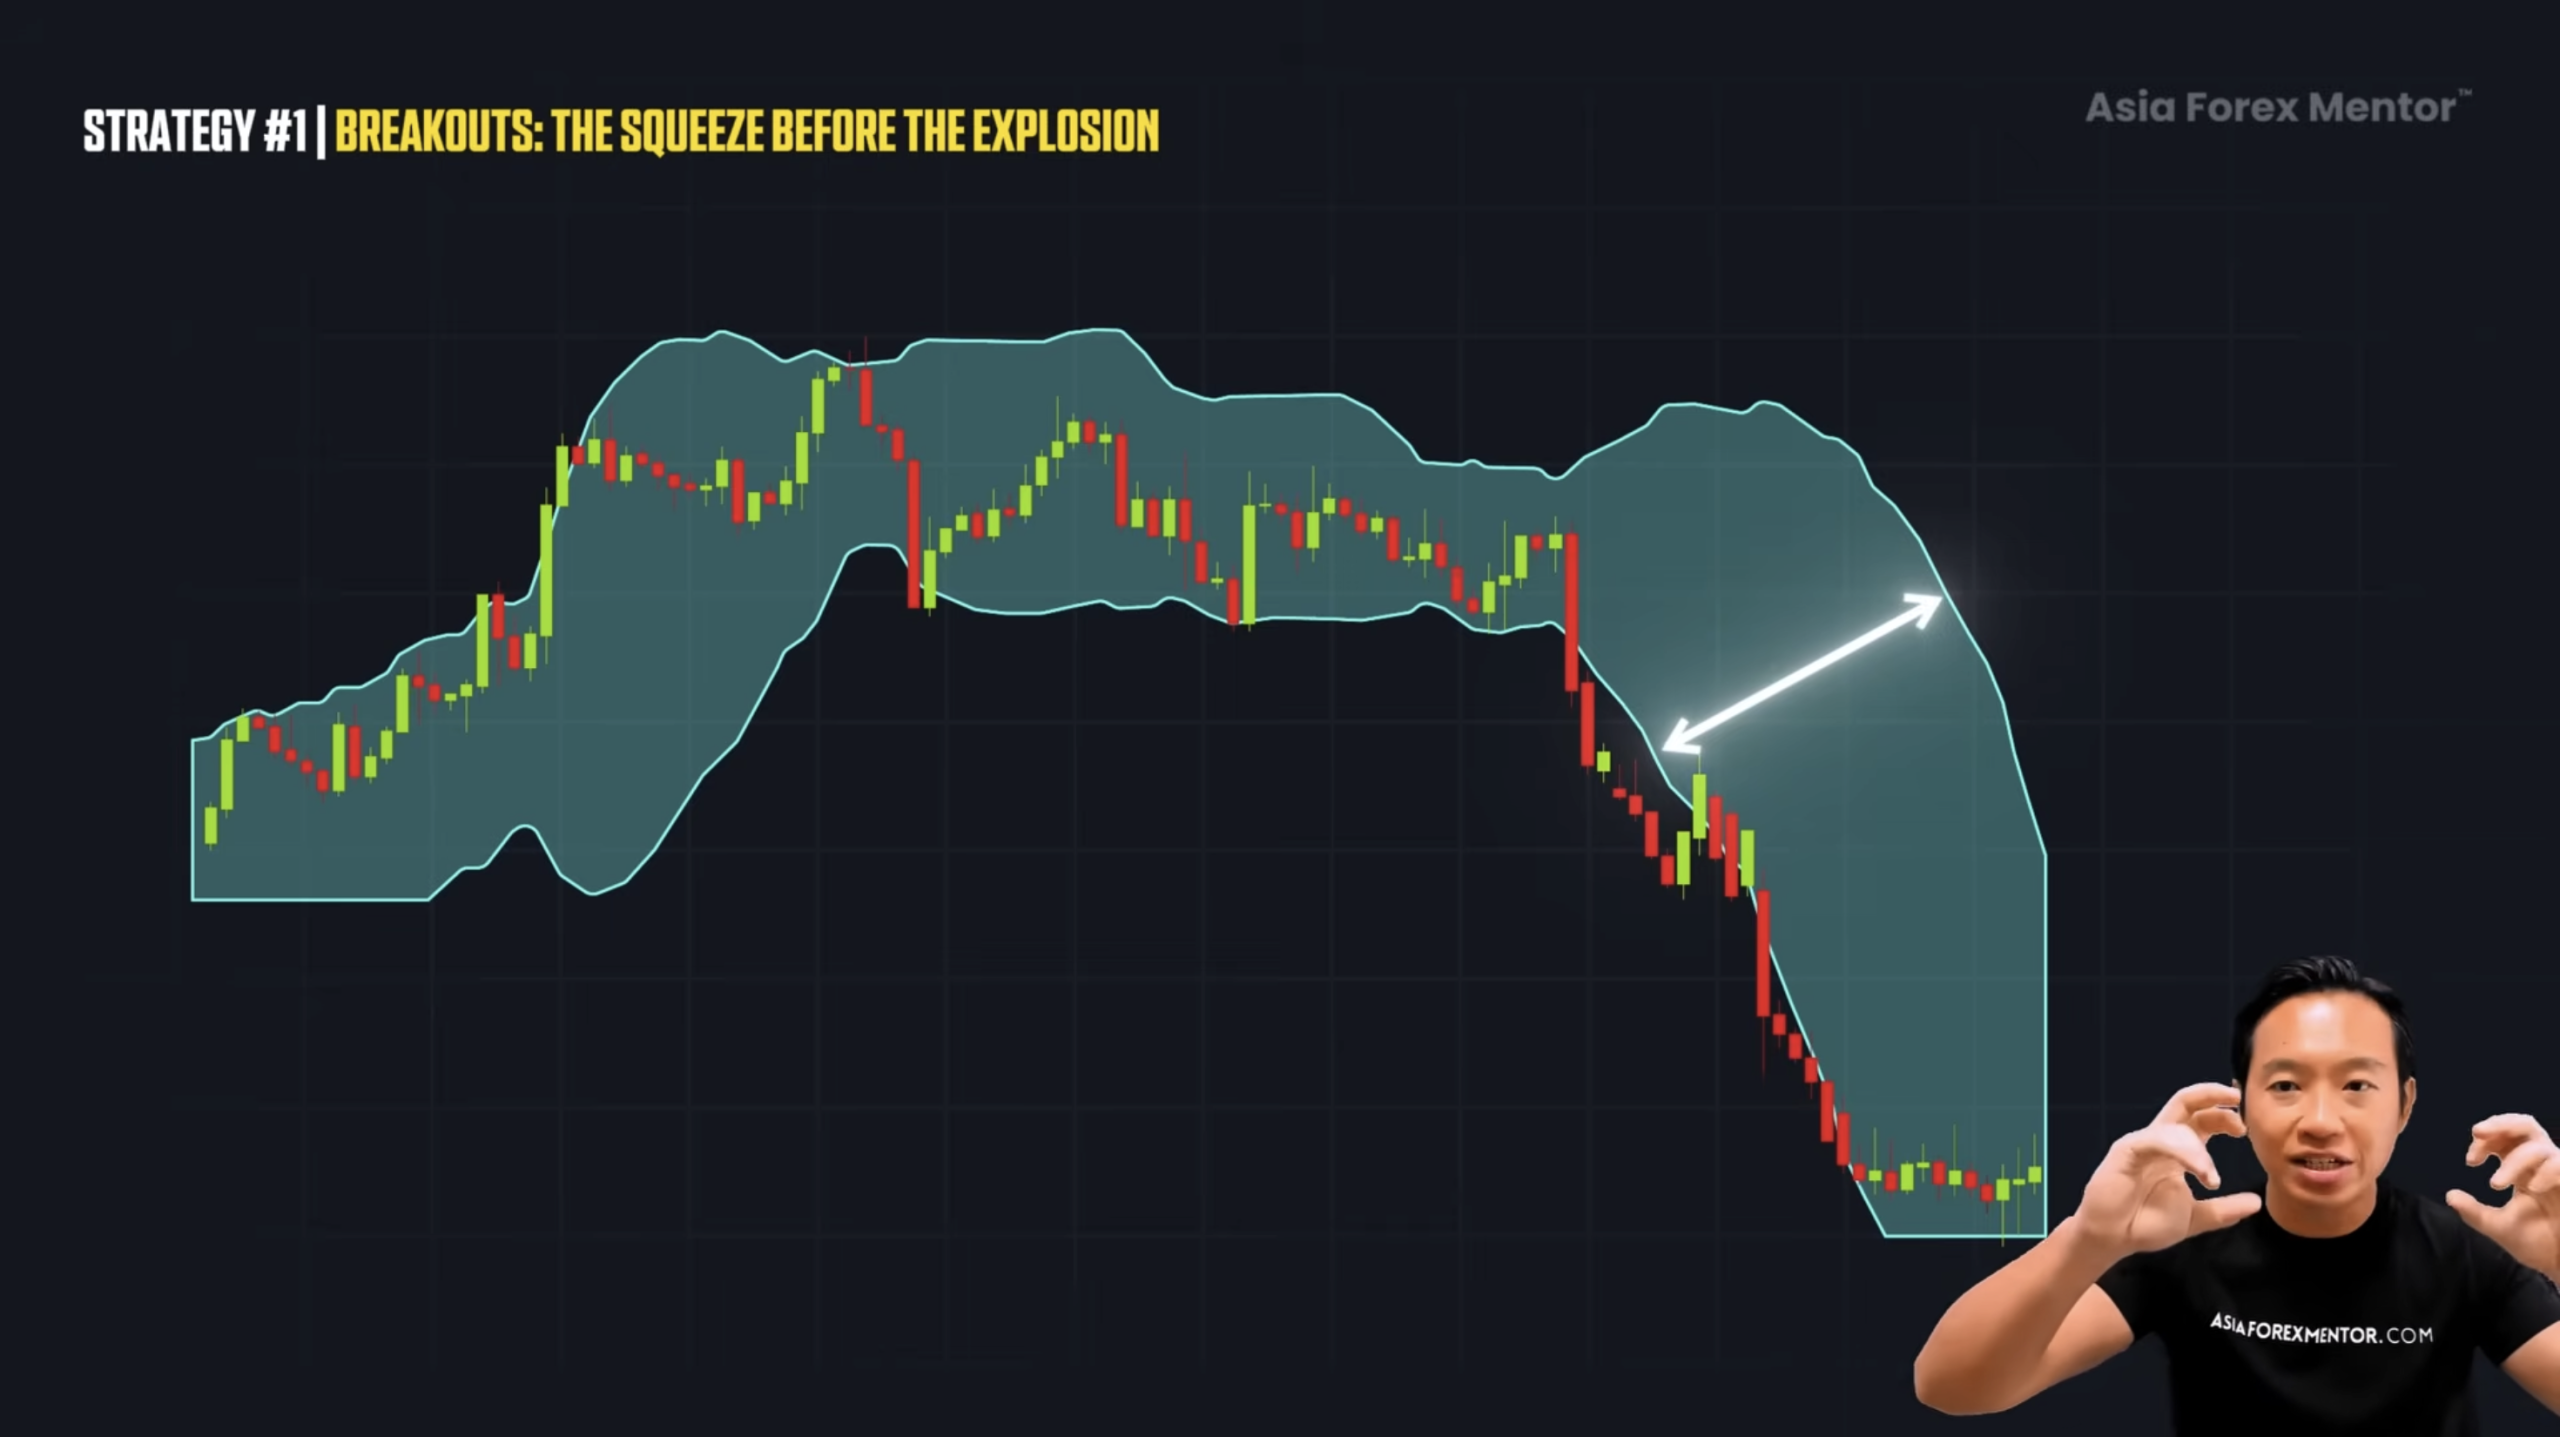
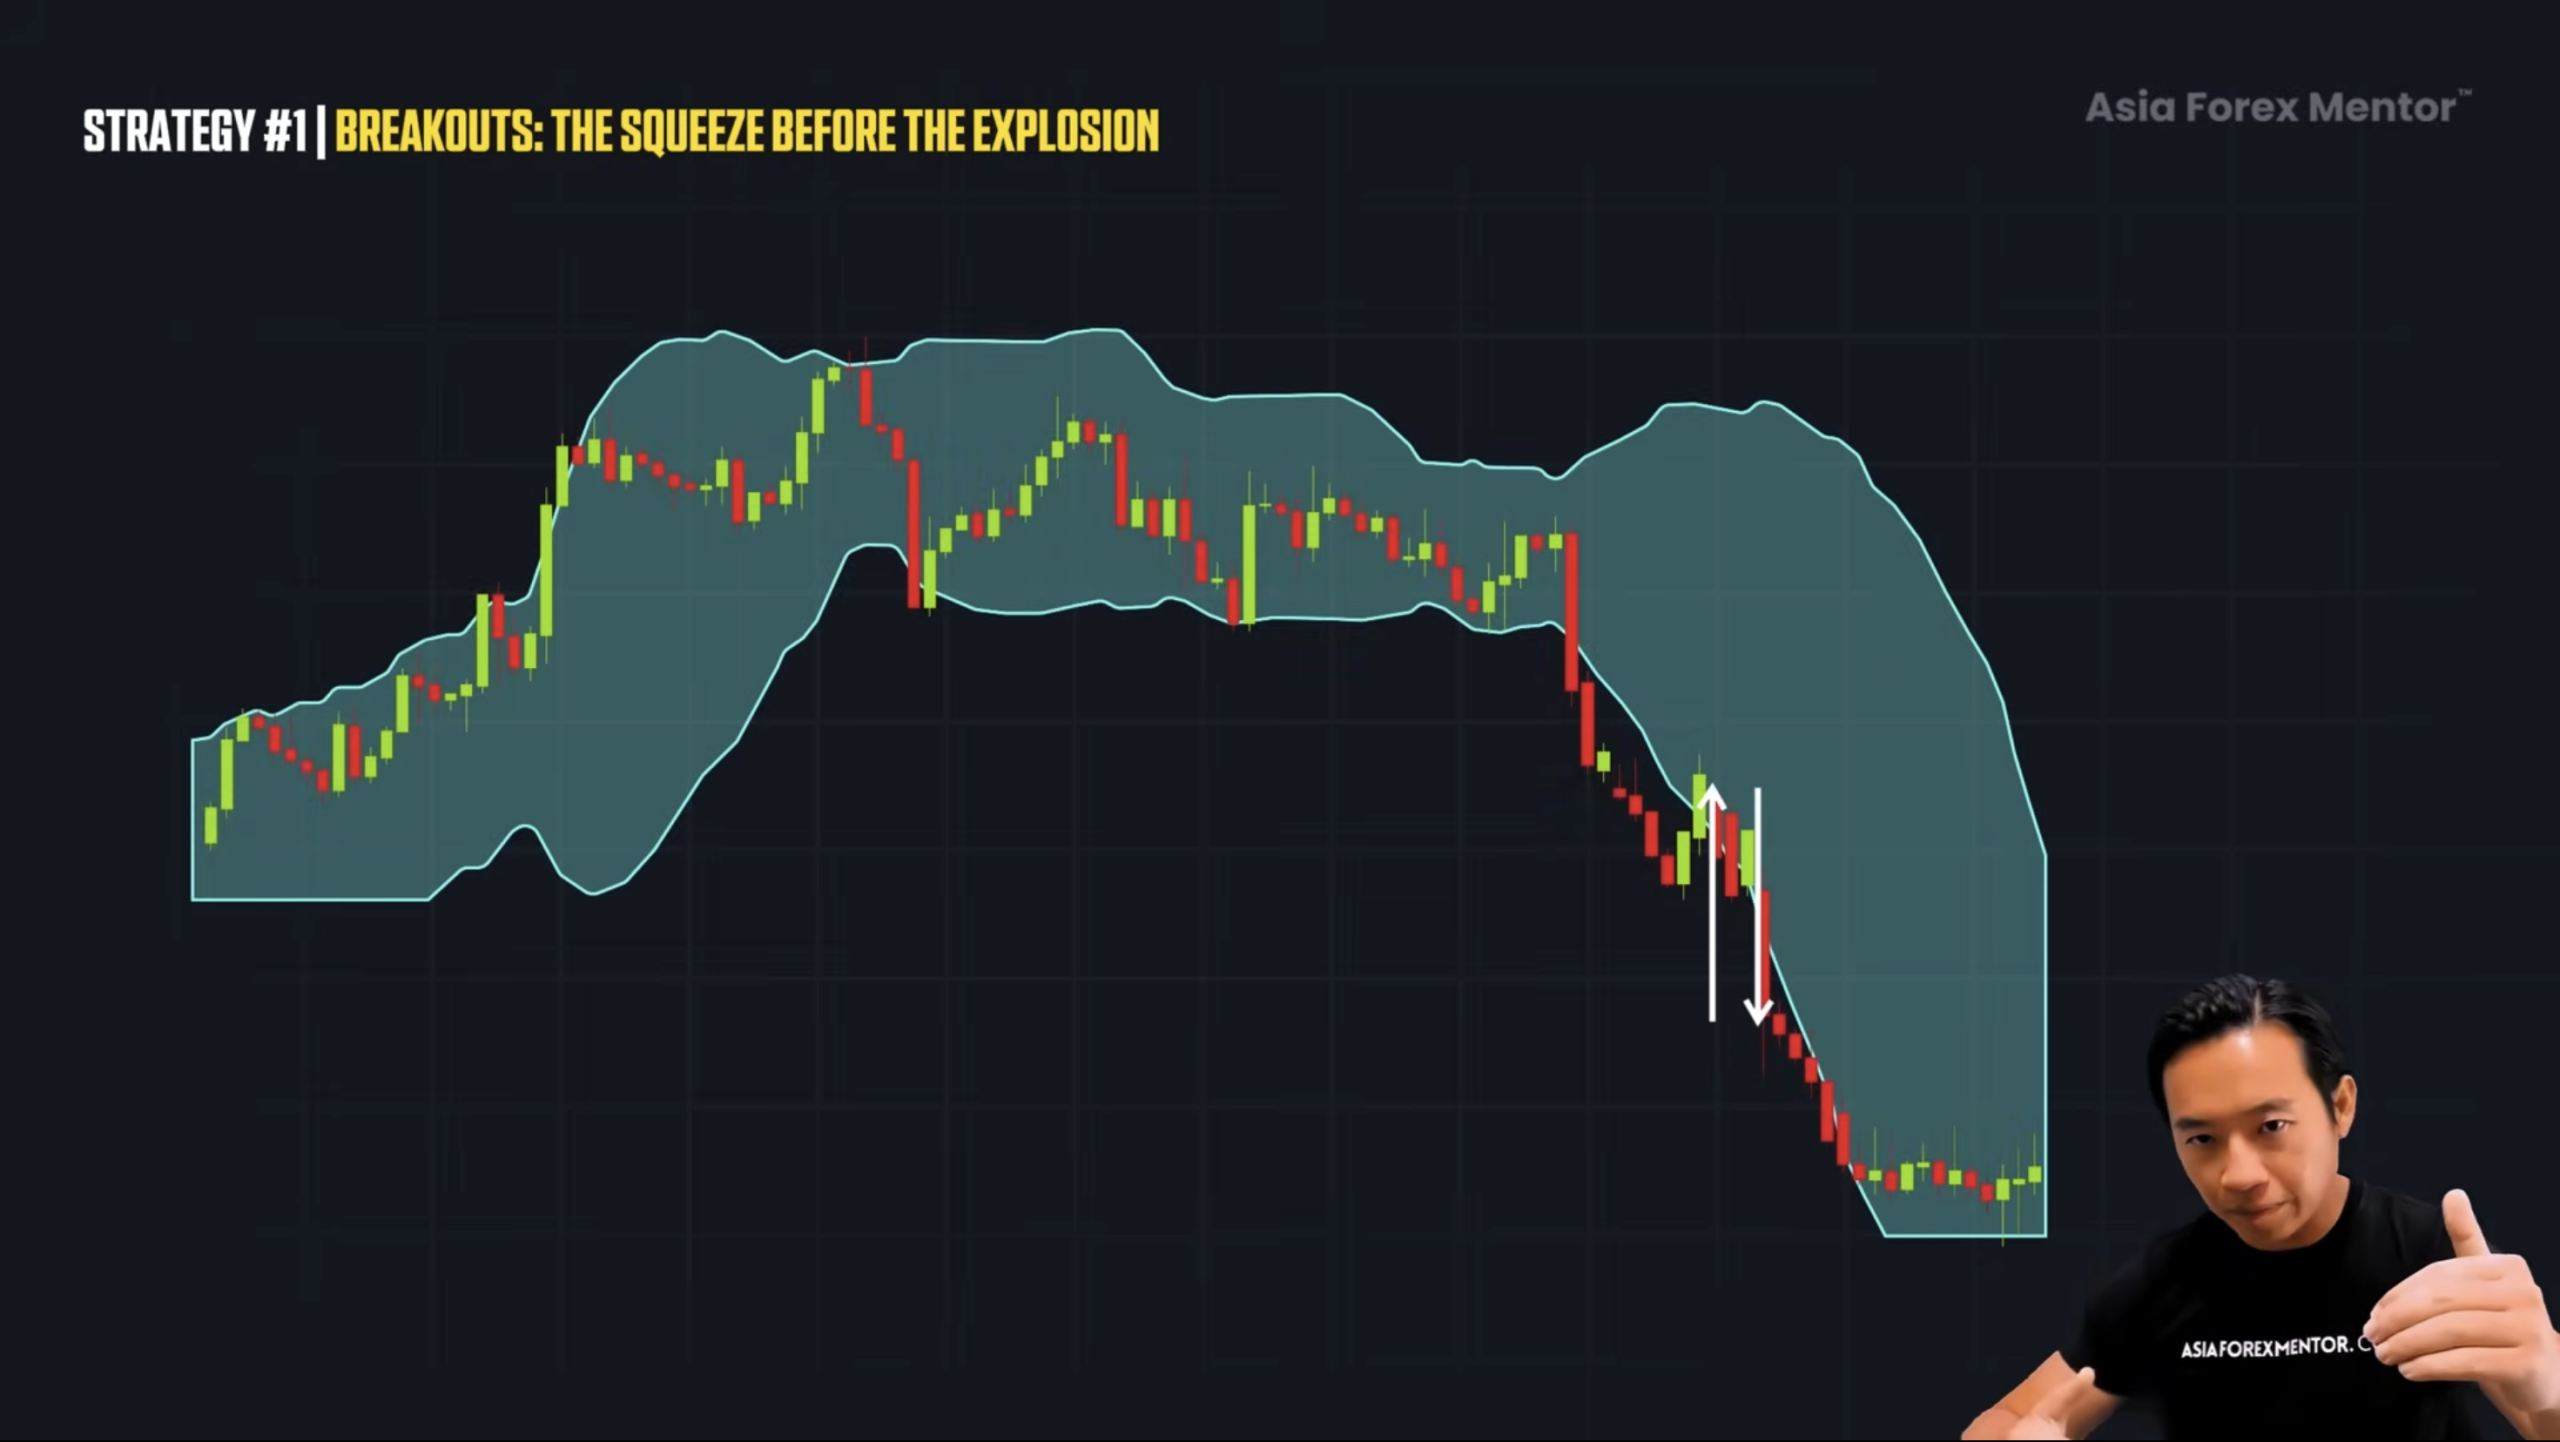
When price finally breaks through with a strong bar, for example a bearish bar, we ask ourselves one question. Is the length of this bar strong enough to take down the previous trend?
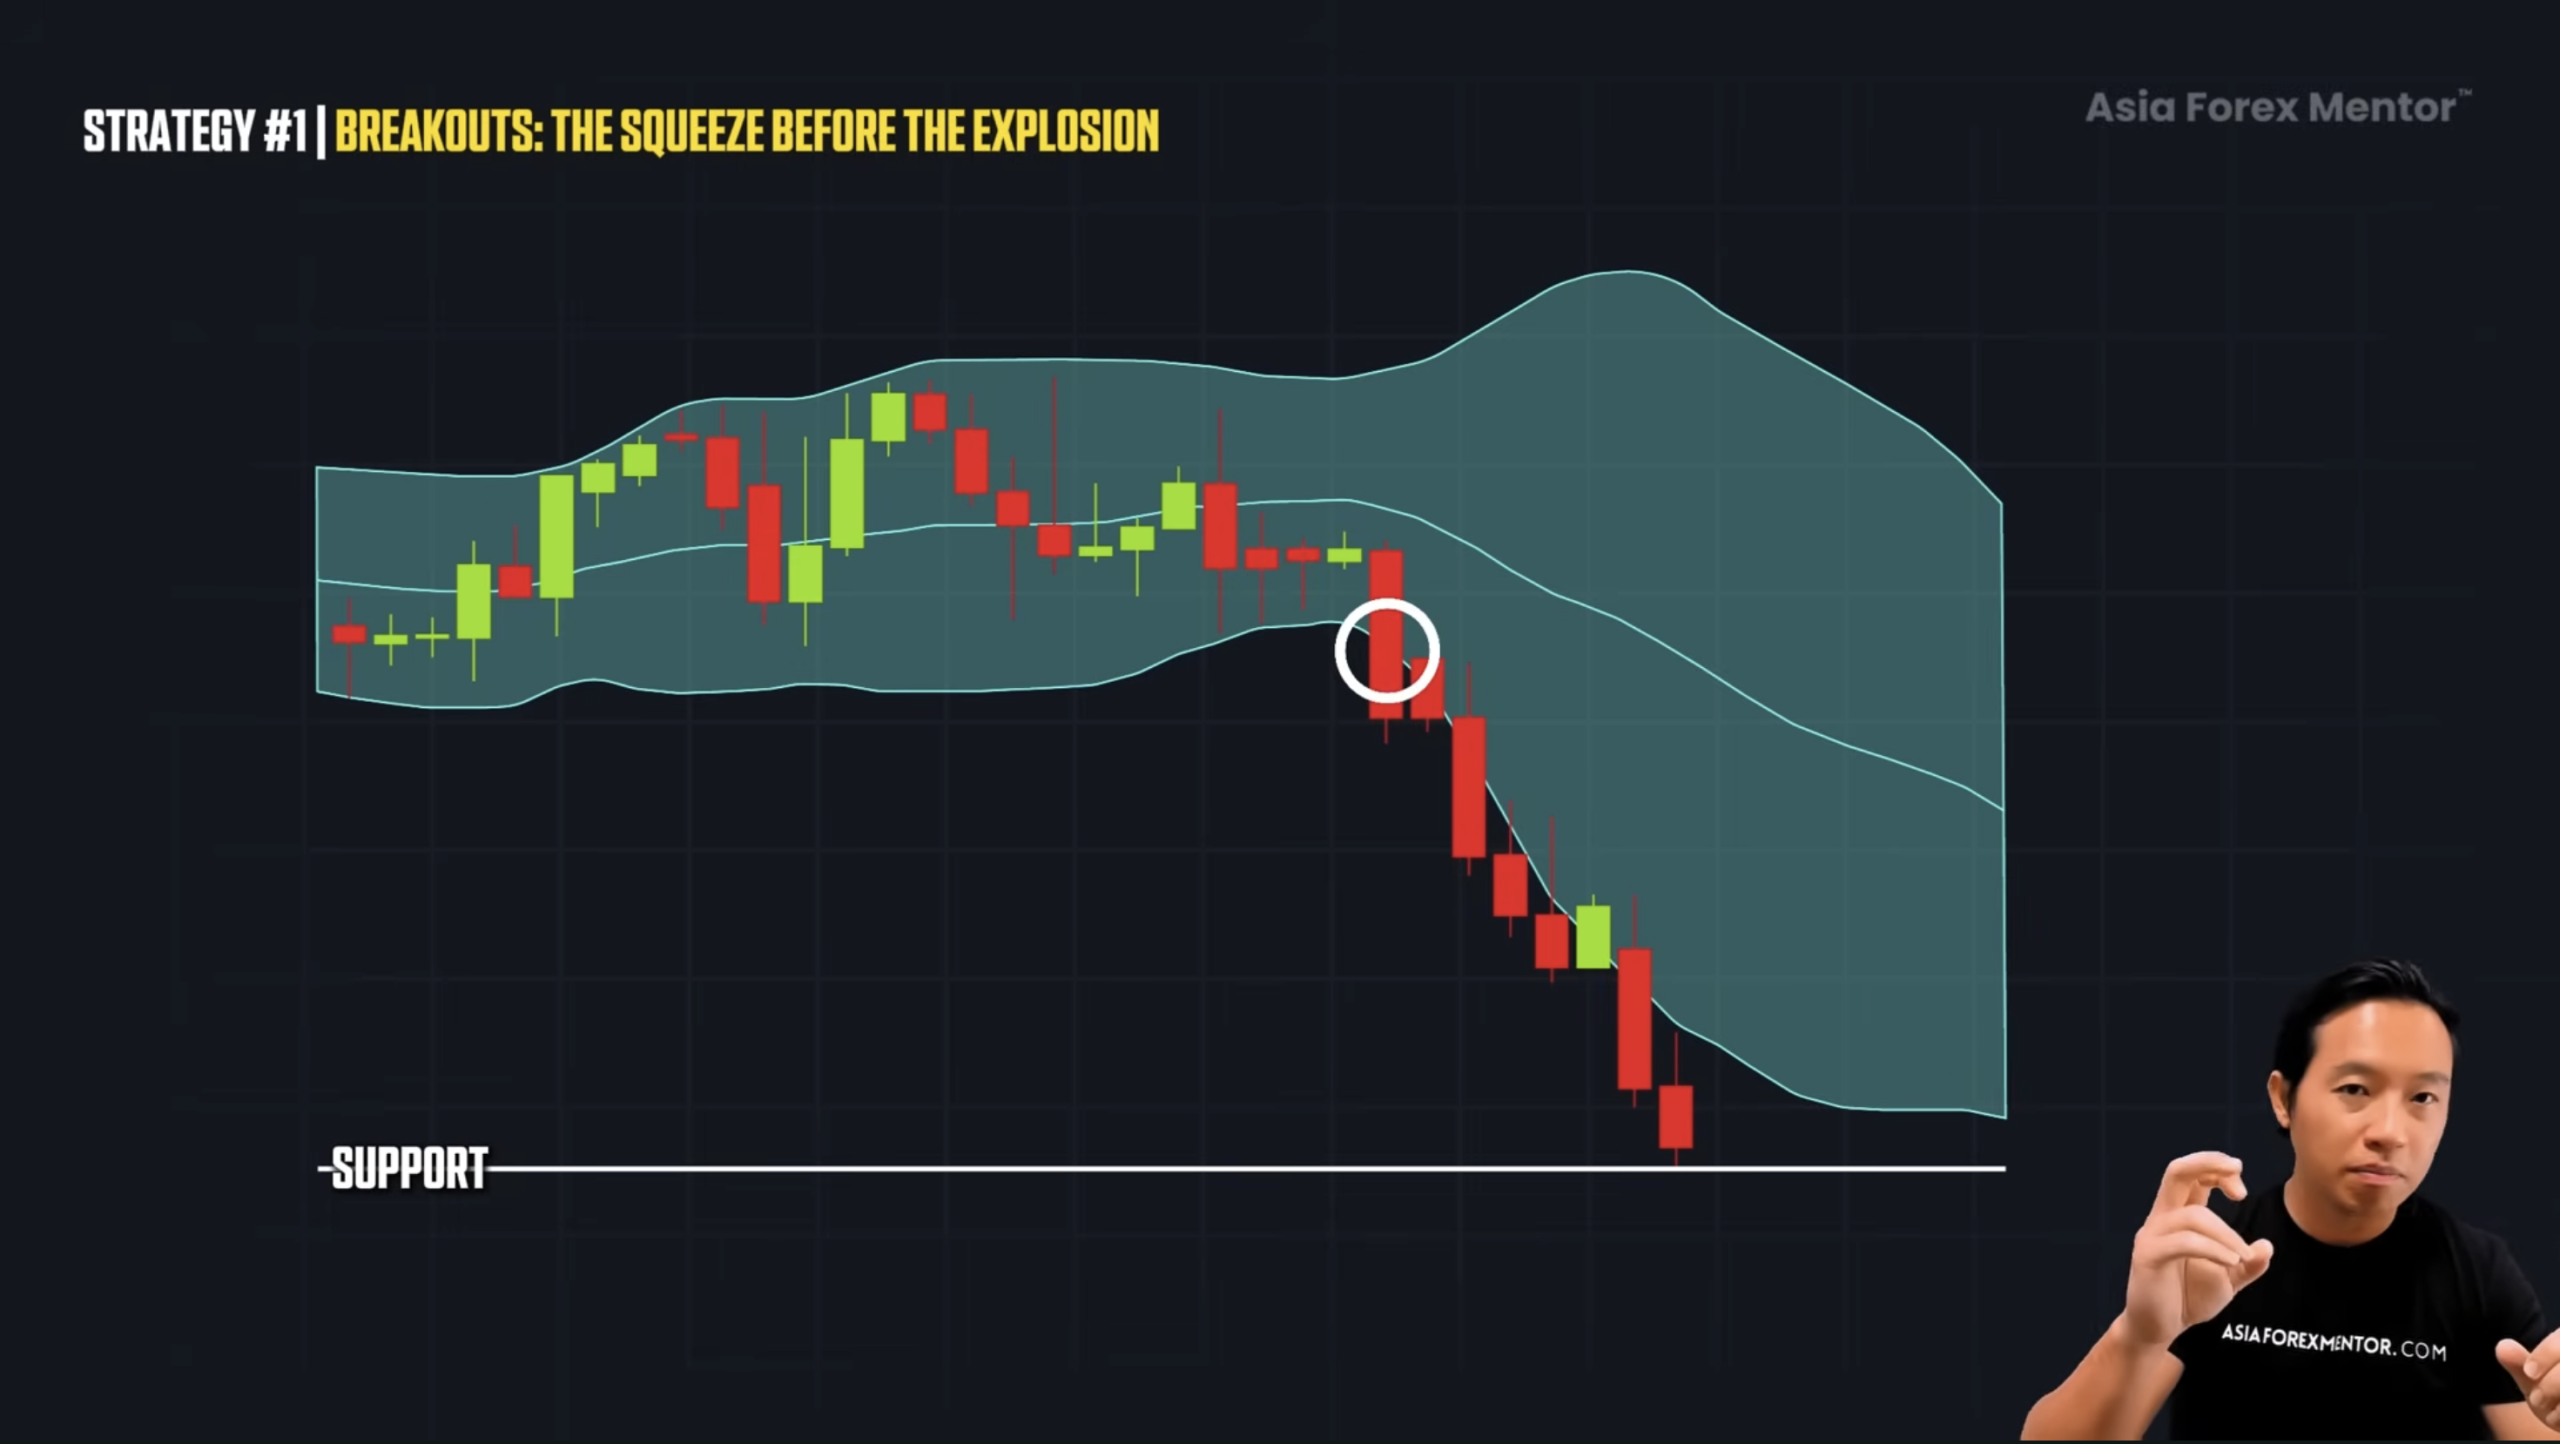
Compare the length of the bar to the previous bar. Is there real momentum?
If the answer is yes, great.
That’s where you can enter at the close of the bar.
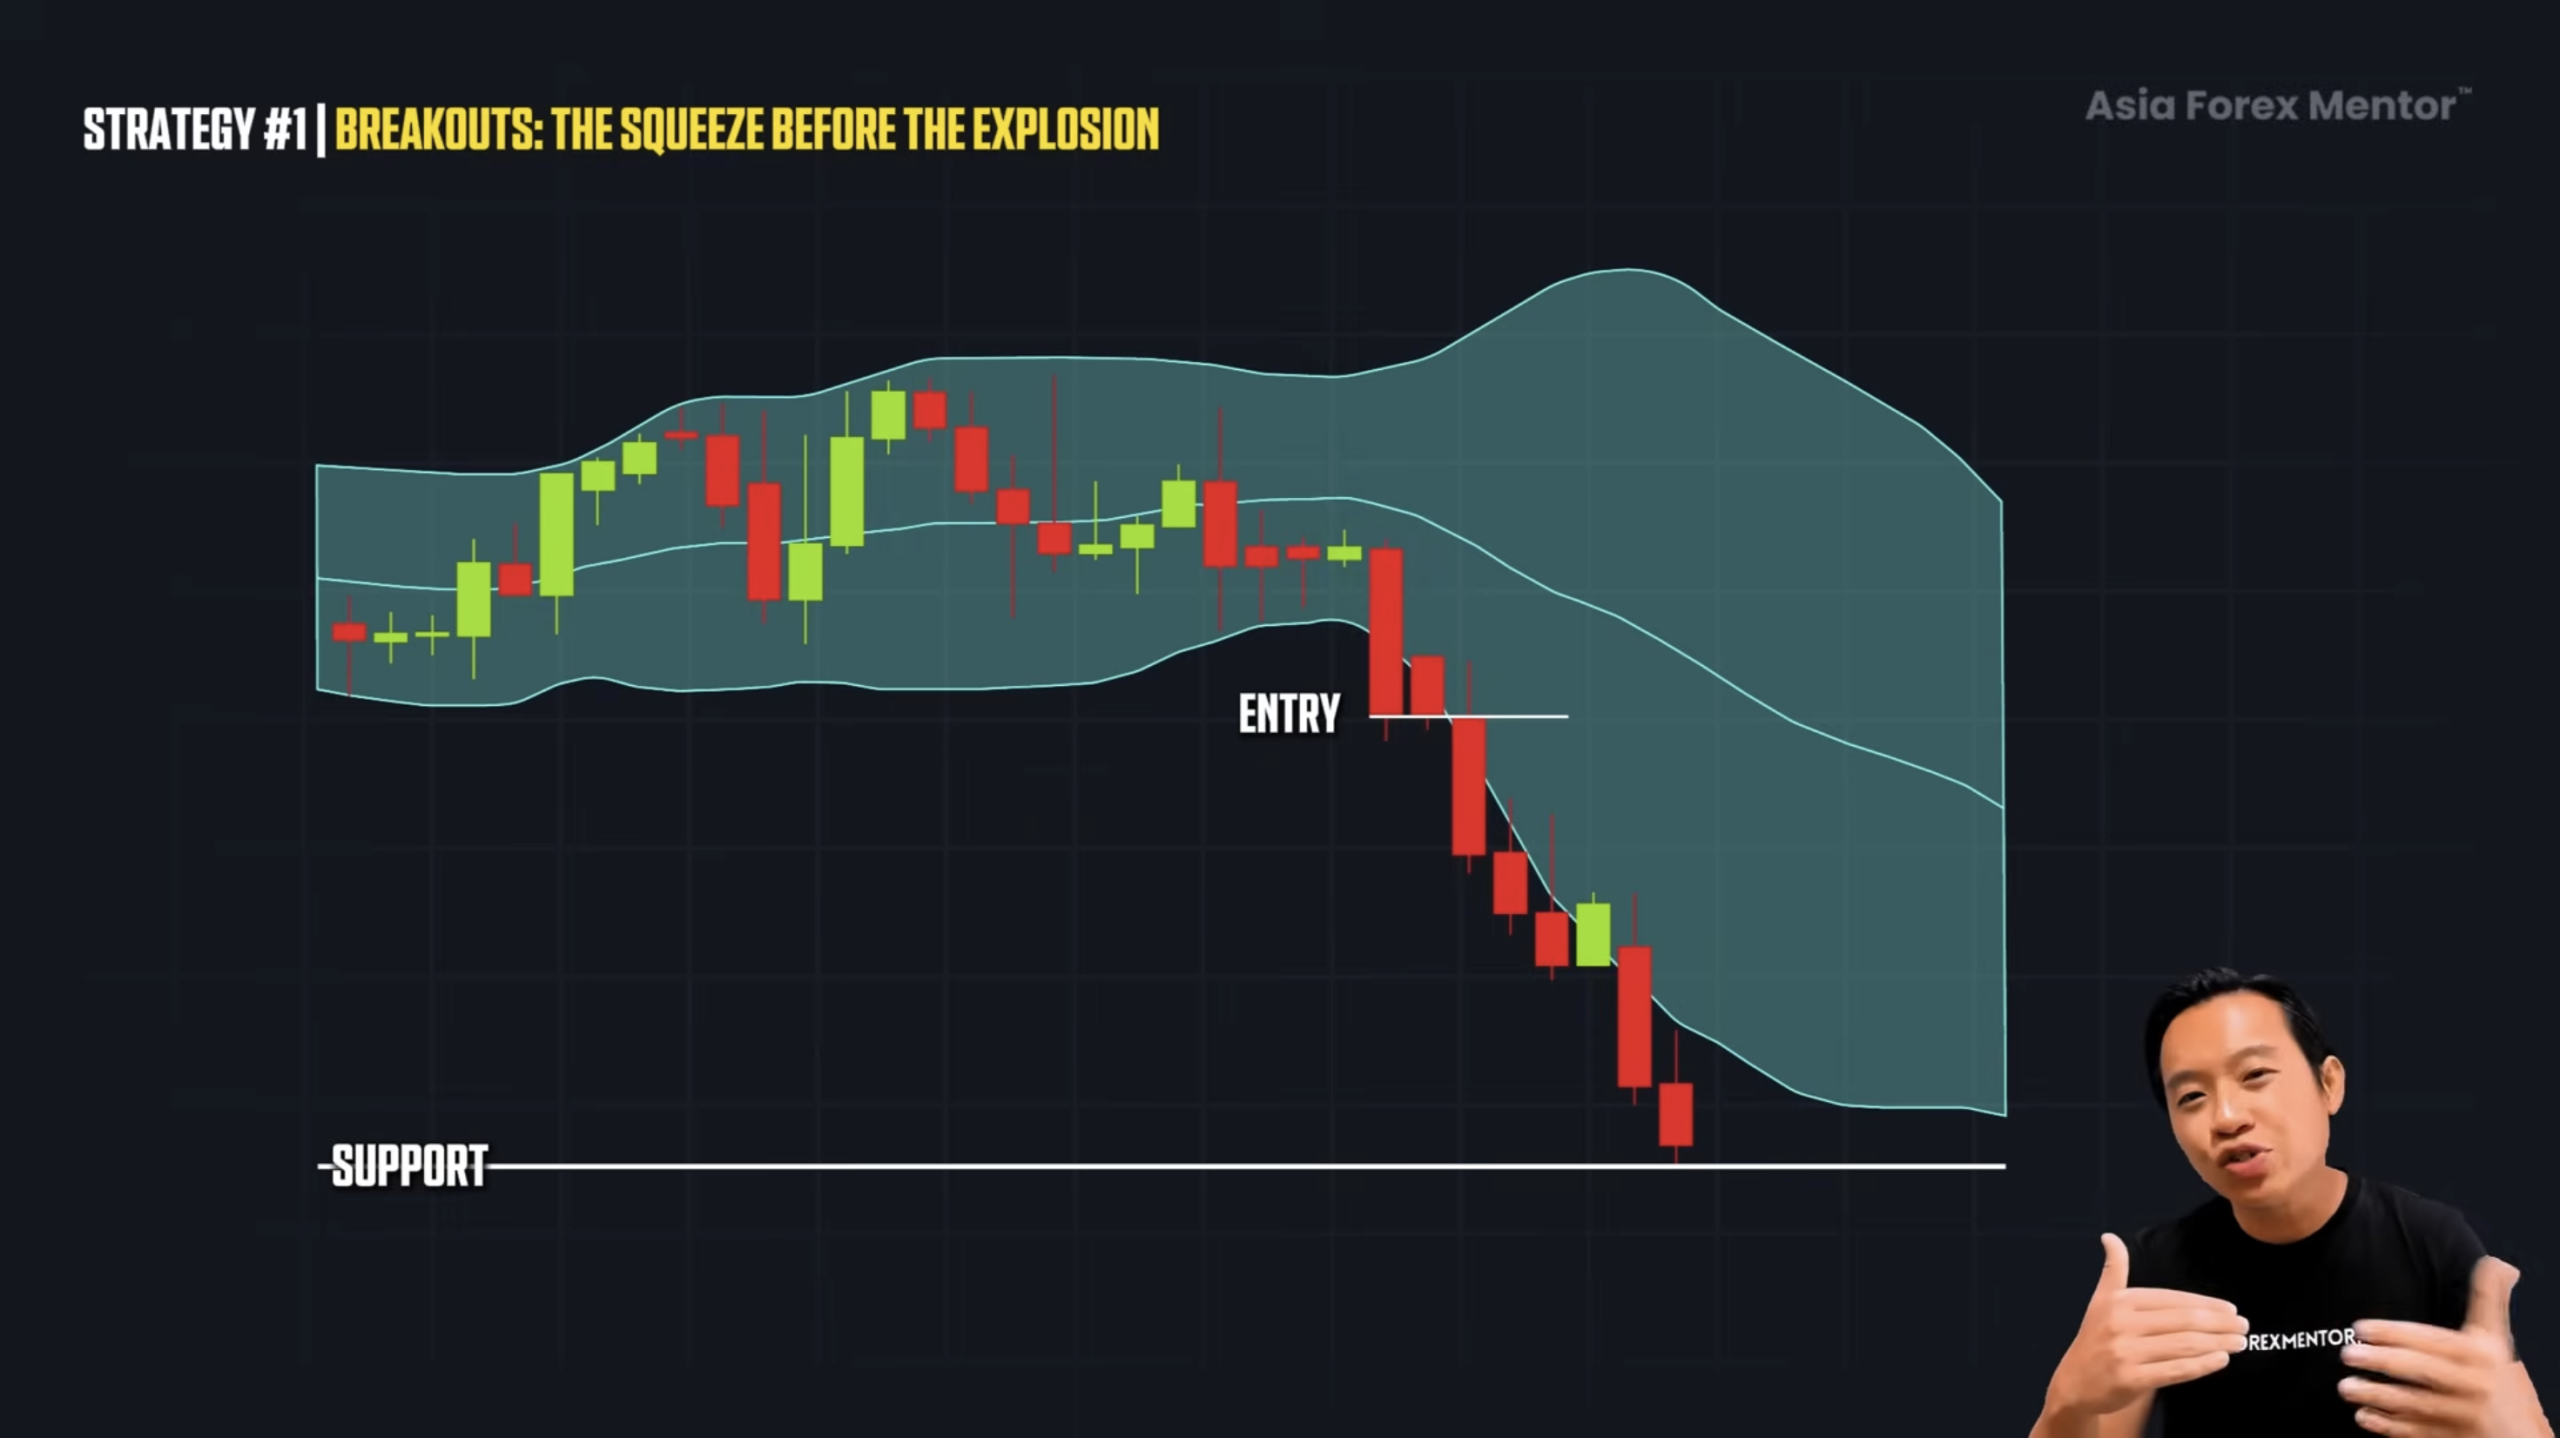
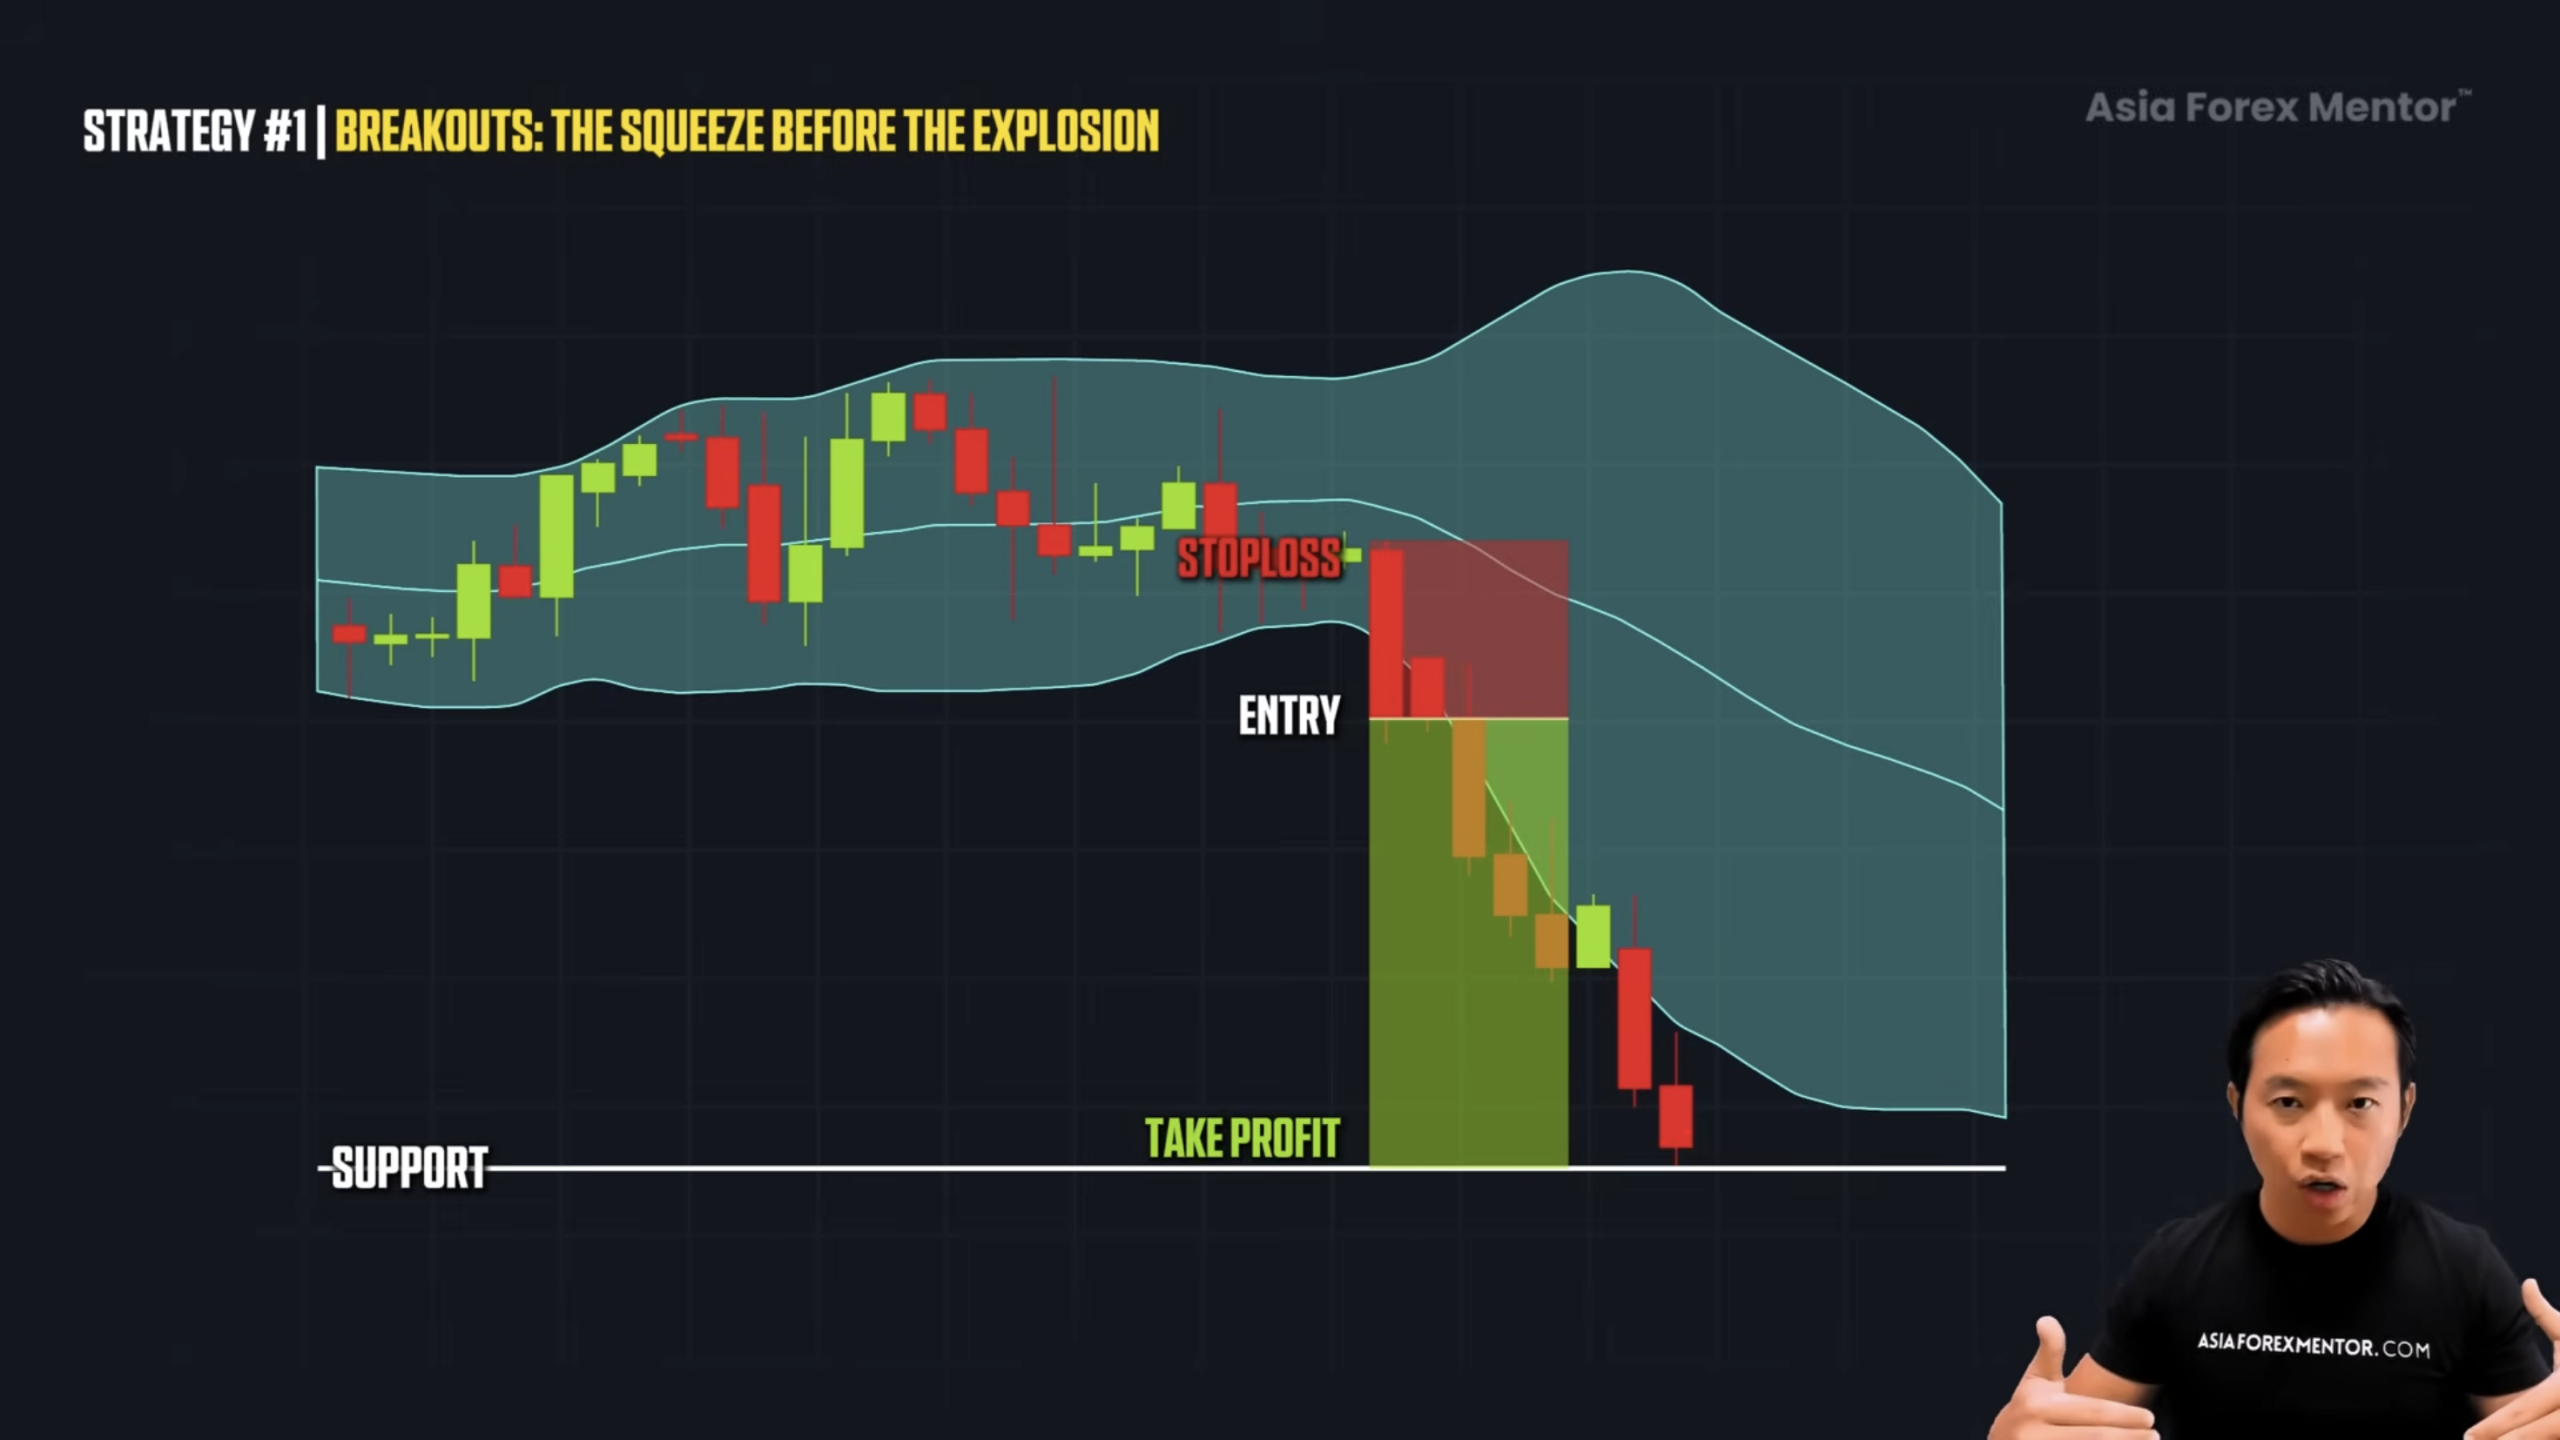
Your stop loss goes above the high of that bar. For take profit, if there is a previous rejection area below, such as a previous low, that’s where you aim for your target. This gives you a solid risk-to-reward ratio.
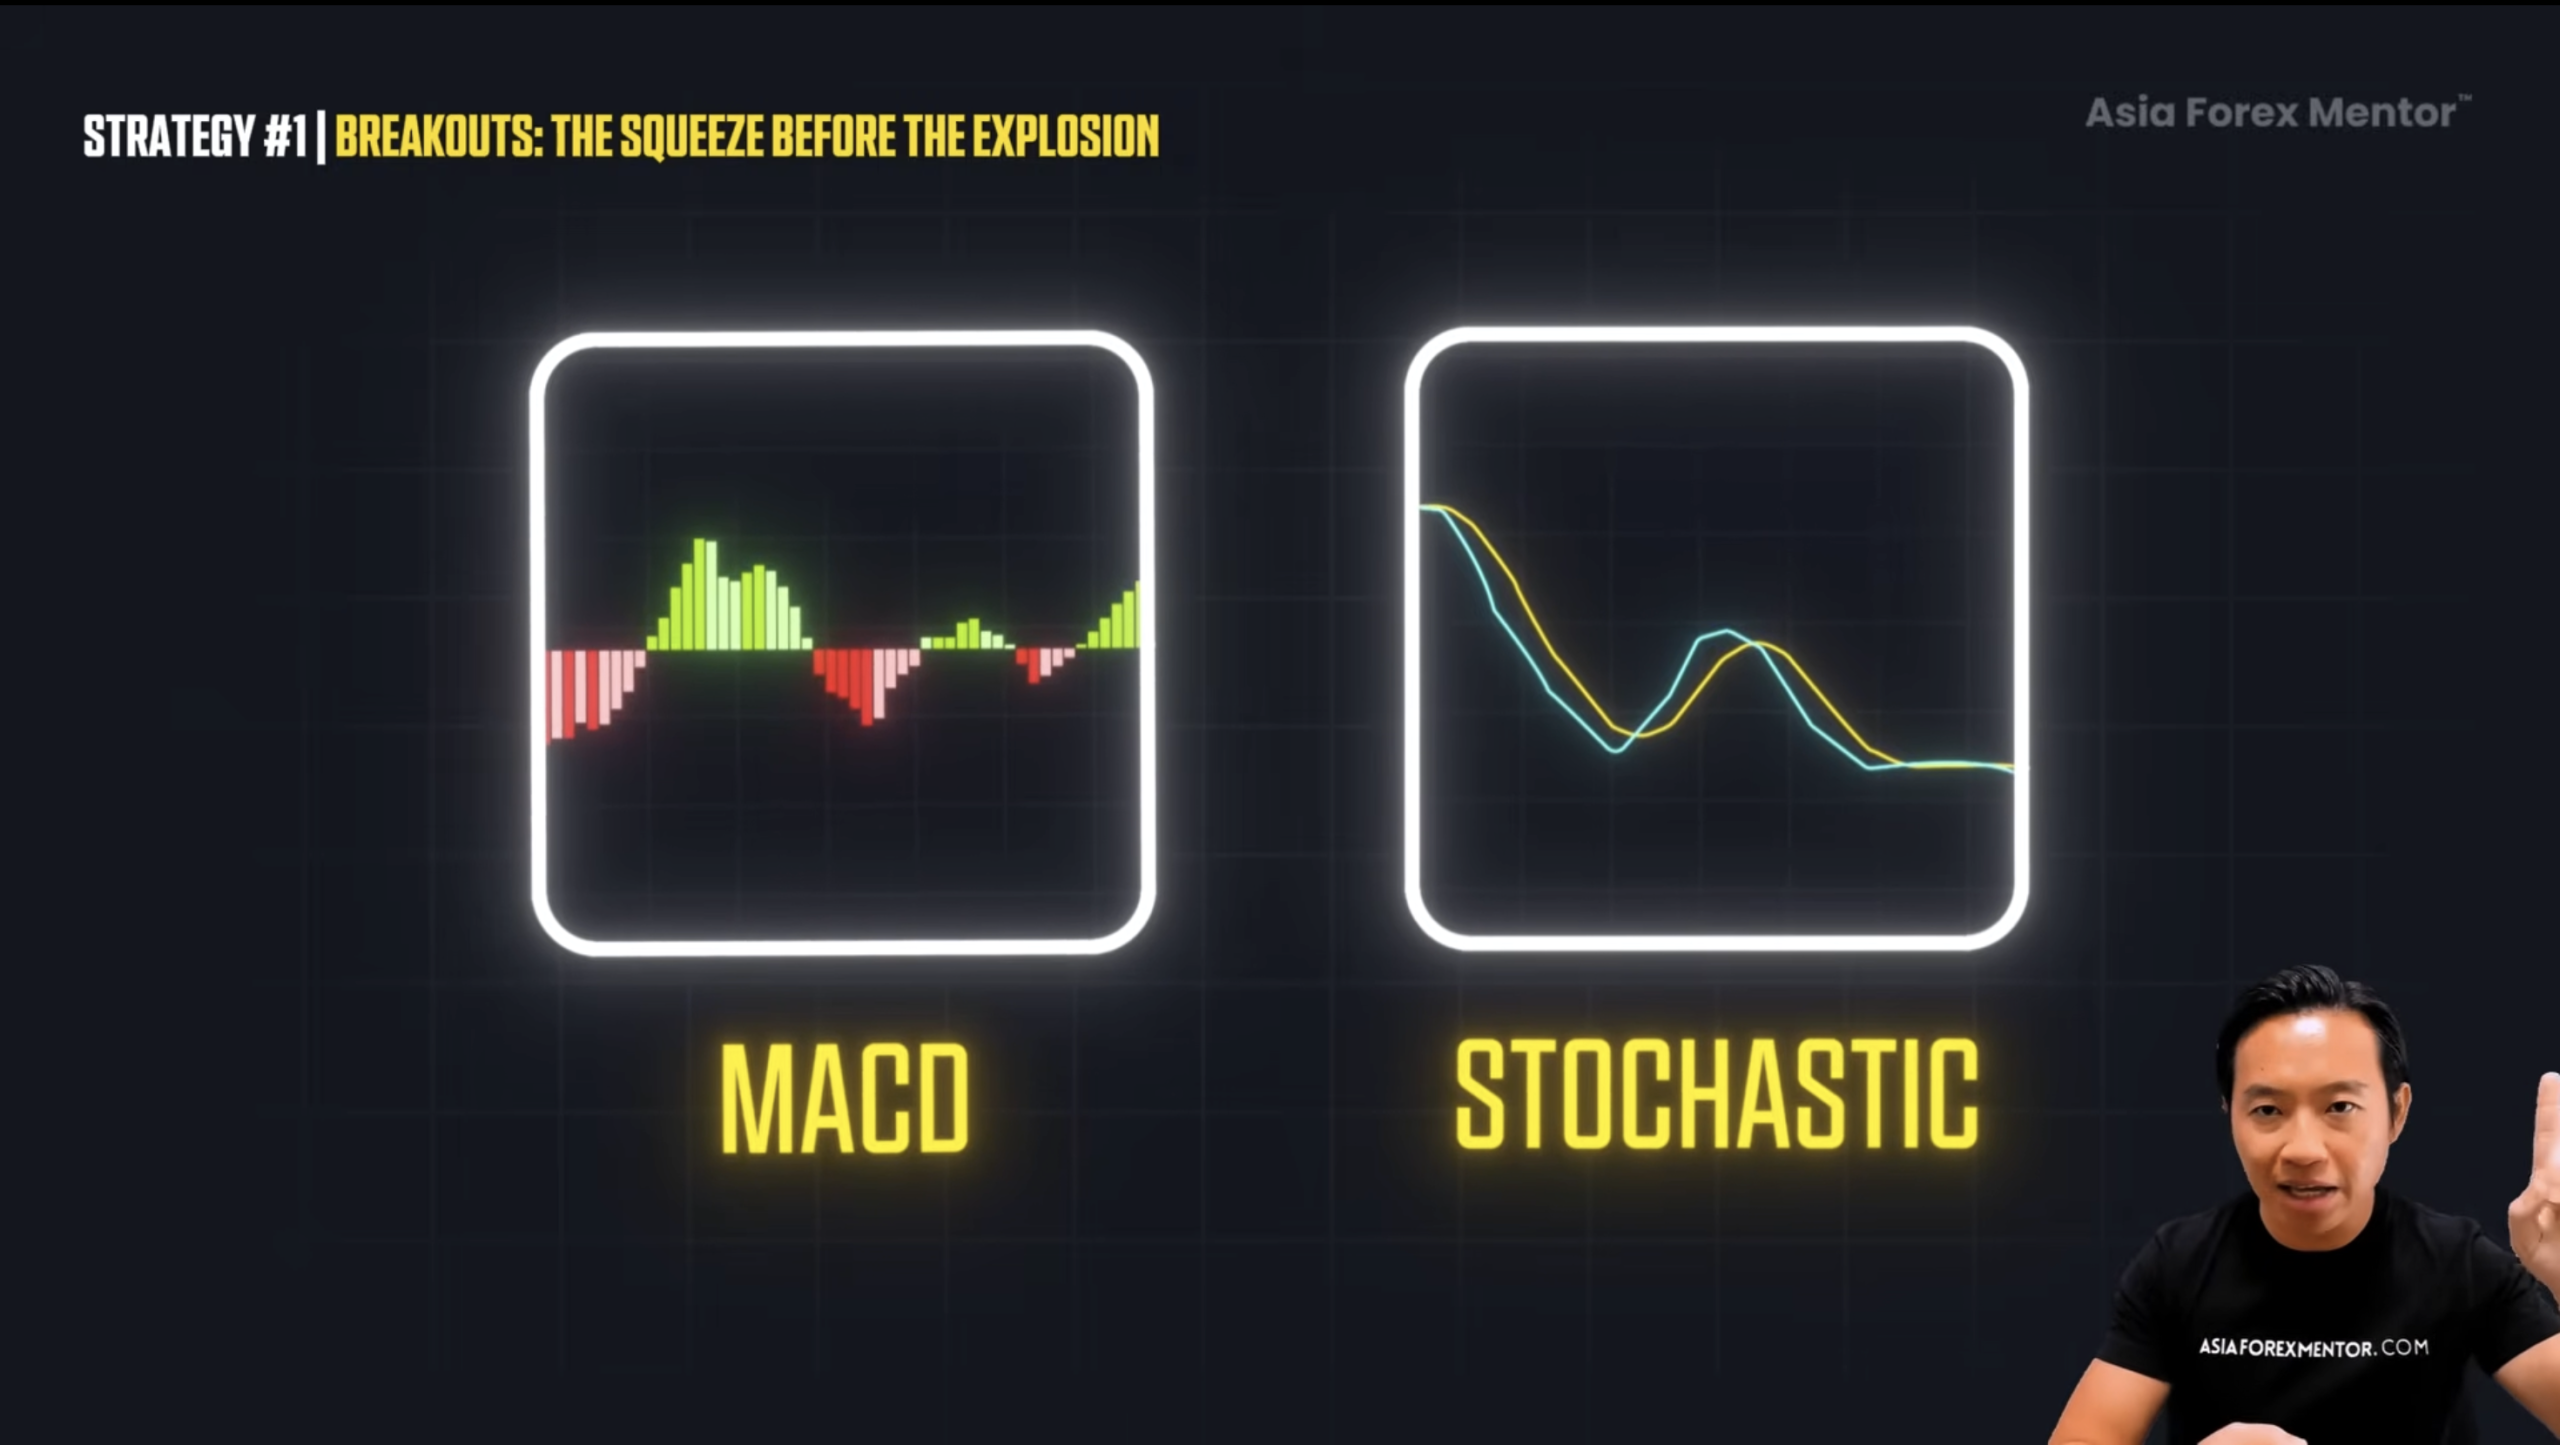
Now obviously, we can stack more things to increase probability.
You can add MACD, stochastic oscillator and learn how to read all of these in my other videos. Now that you understand breakouts, Bollinger Bands are not only used for breakouts.
They are also primarily used for reversals.
Strategy 2: Reversals – Timing the Snap Back
Reversals work best when the market is quiet.
This is the most important thing to understand before trading Bollinger Band reversals.
What we are waiting for is price to actually tap the outer band. When price taps the upper band, we watch for sellers to step in. When price taps the lower band, we watch for buyers to step in.
Think of it like a rubber band. The further it stretches, the stronger it pulls back toward the middle.
Here’s the beauty of it.
The market is about 30 percent trending and 70 percent sideways. If you only trade trends, you’re missing 70 percent of the market. And a lot of those sideways moves happen inside the Bollinger Bands.
That’s where reversals come in.
During sideways markets, the Bollinger Bands act as resistance and support.
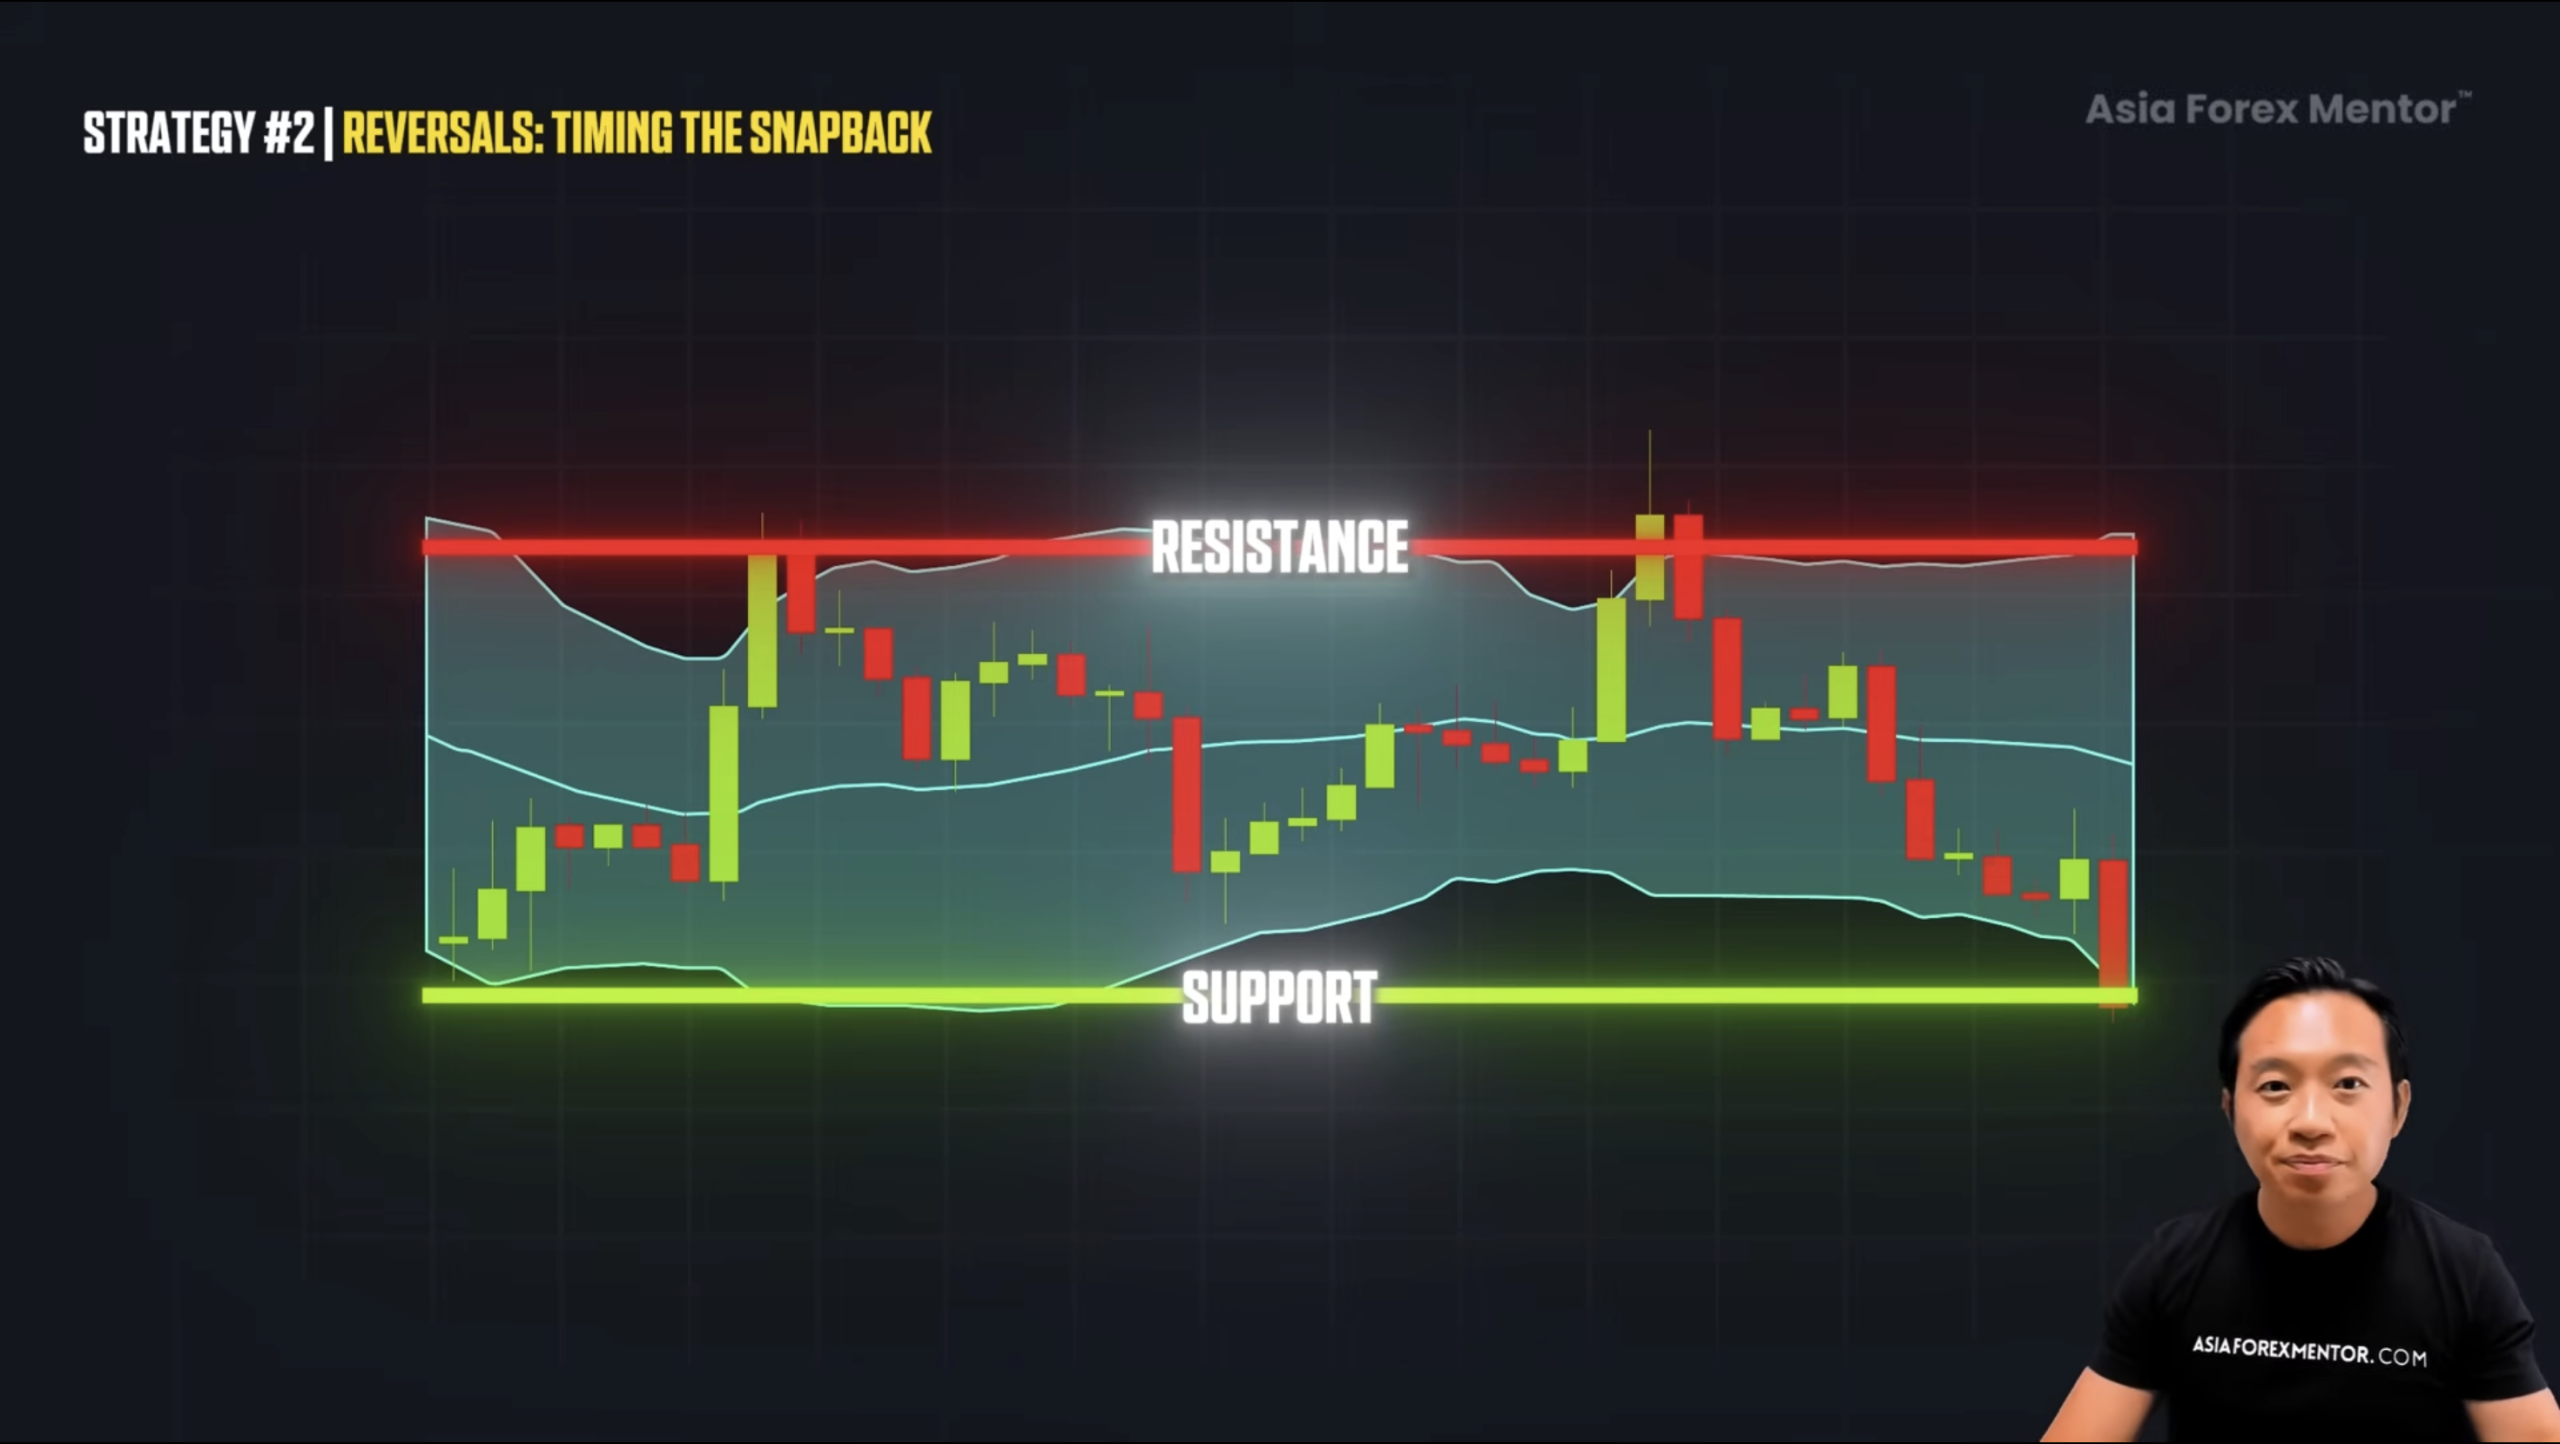 When price taps the upper band and stalls, that’s your clue sellers are waiting. Price rejects, momentum shifts, and before you know it, price moves down.
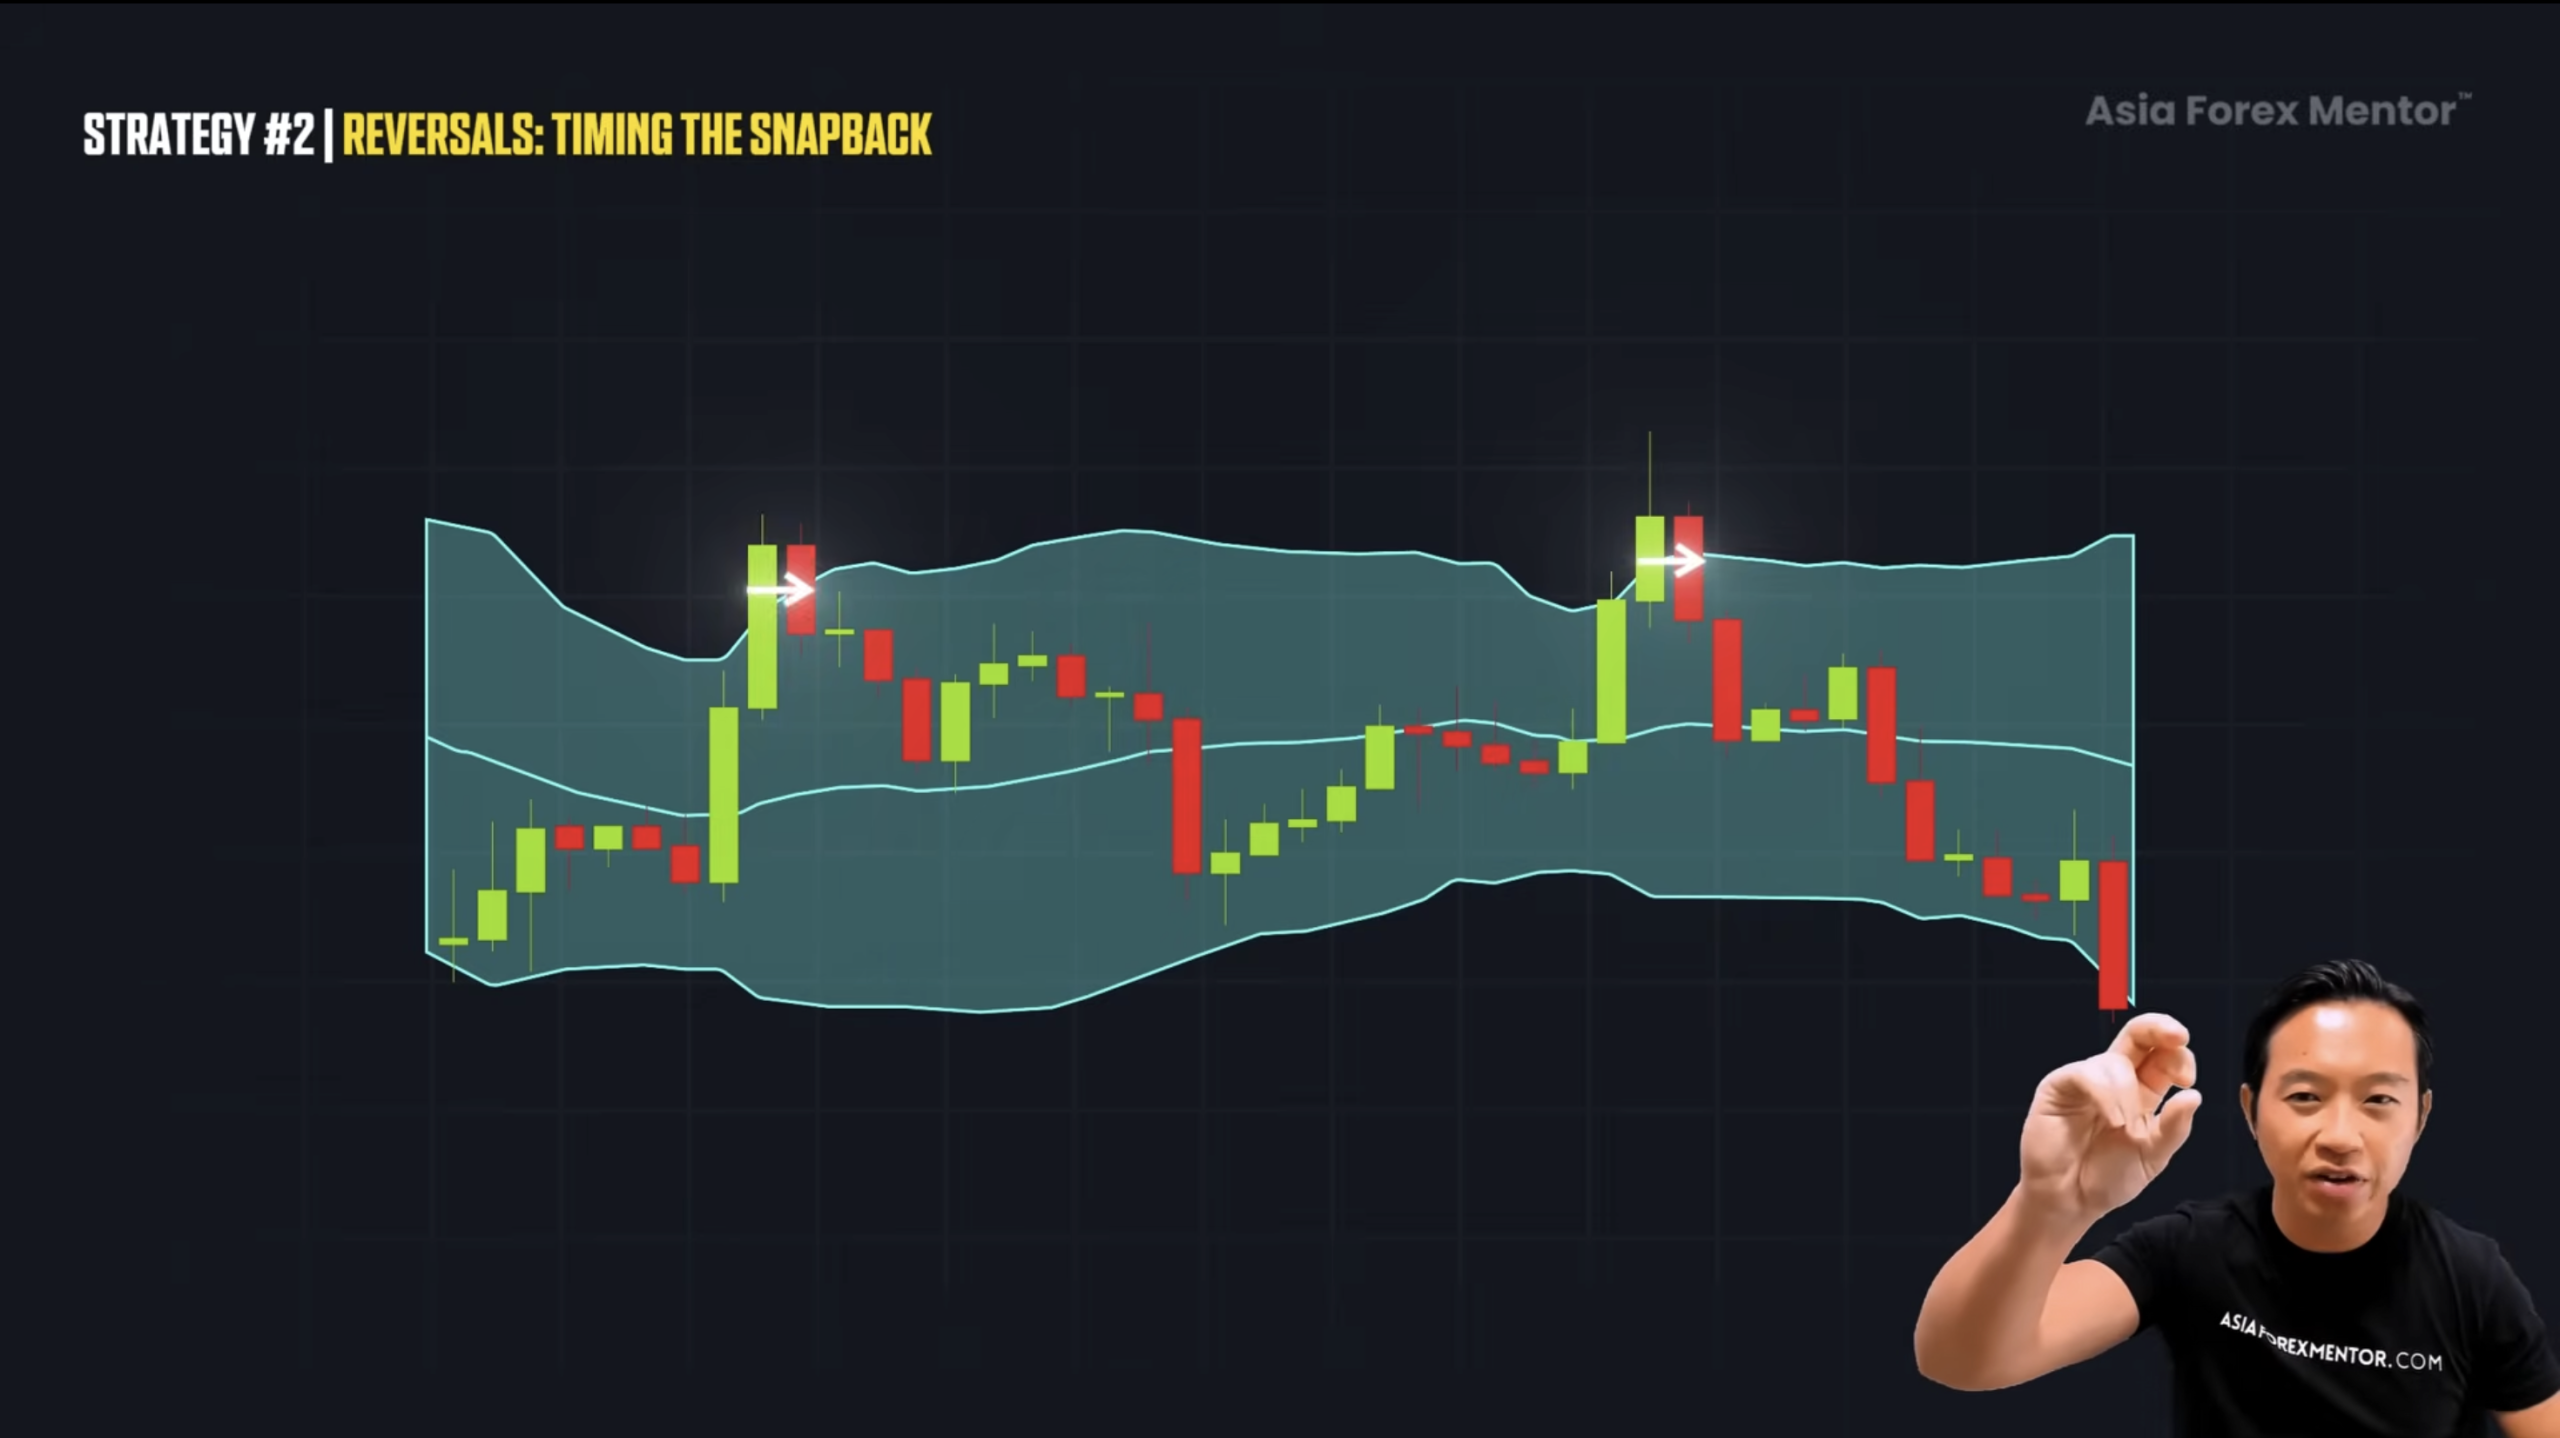
Now here’s the key part.
Sometimes you’ll see a bar close above the band. And this is why we don’t jump in immediately. That move could be a breakout or it could be a fake move setting up a reversal.
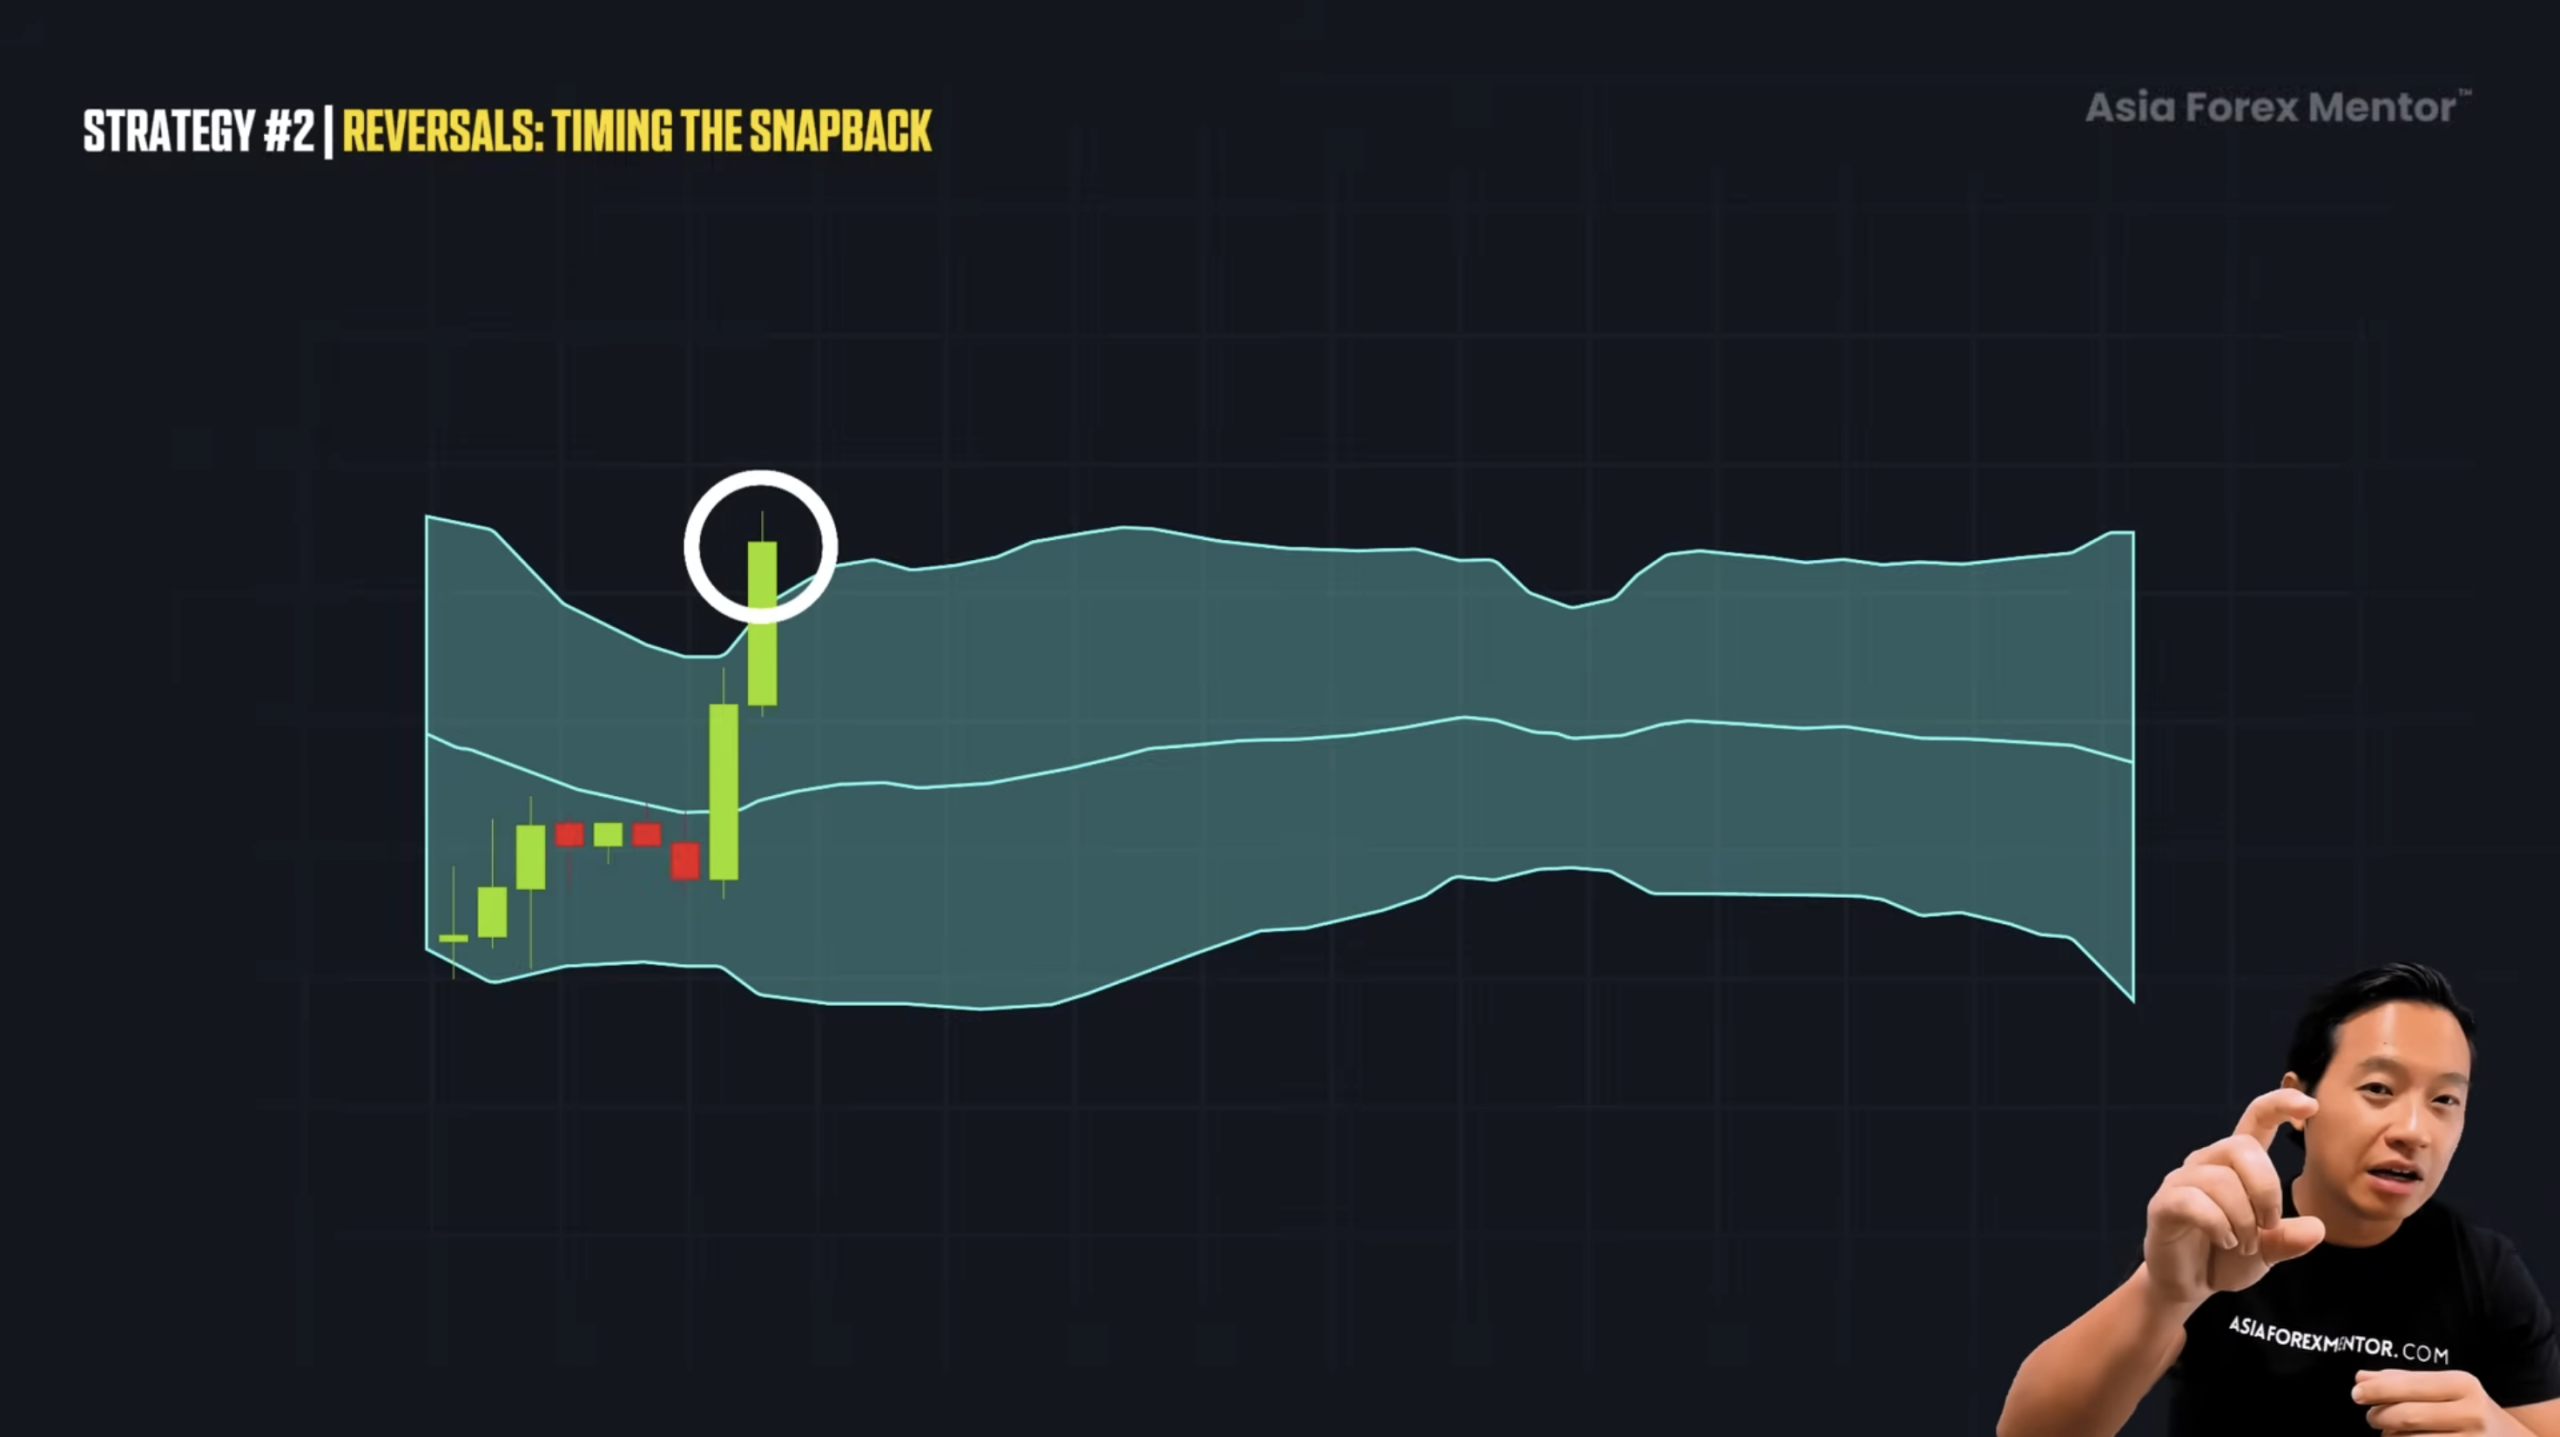
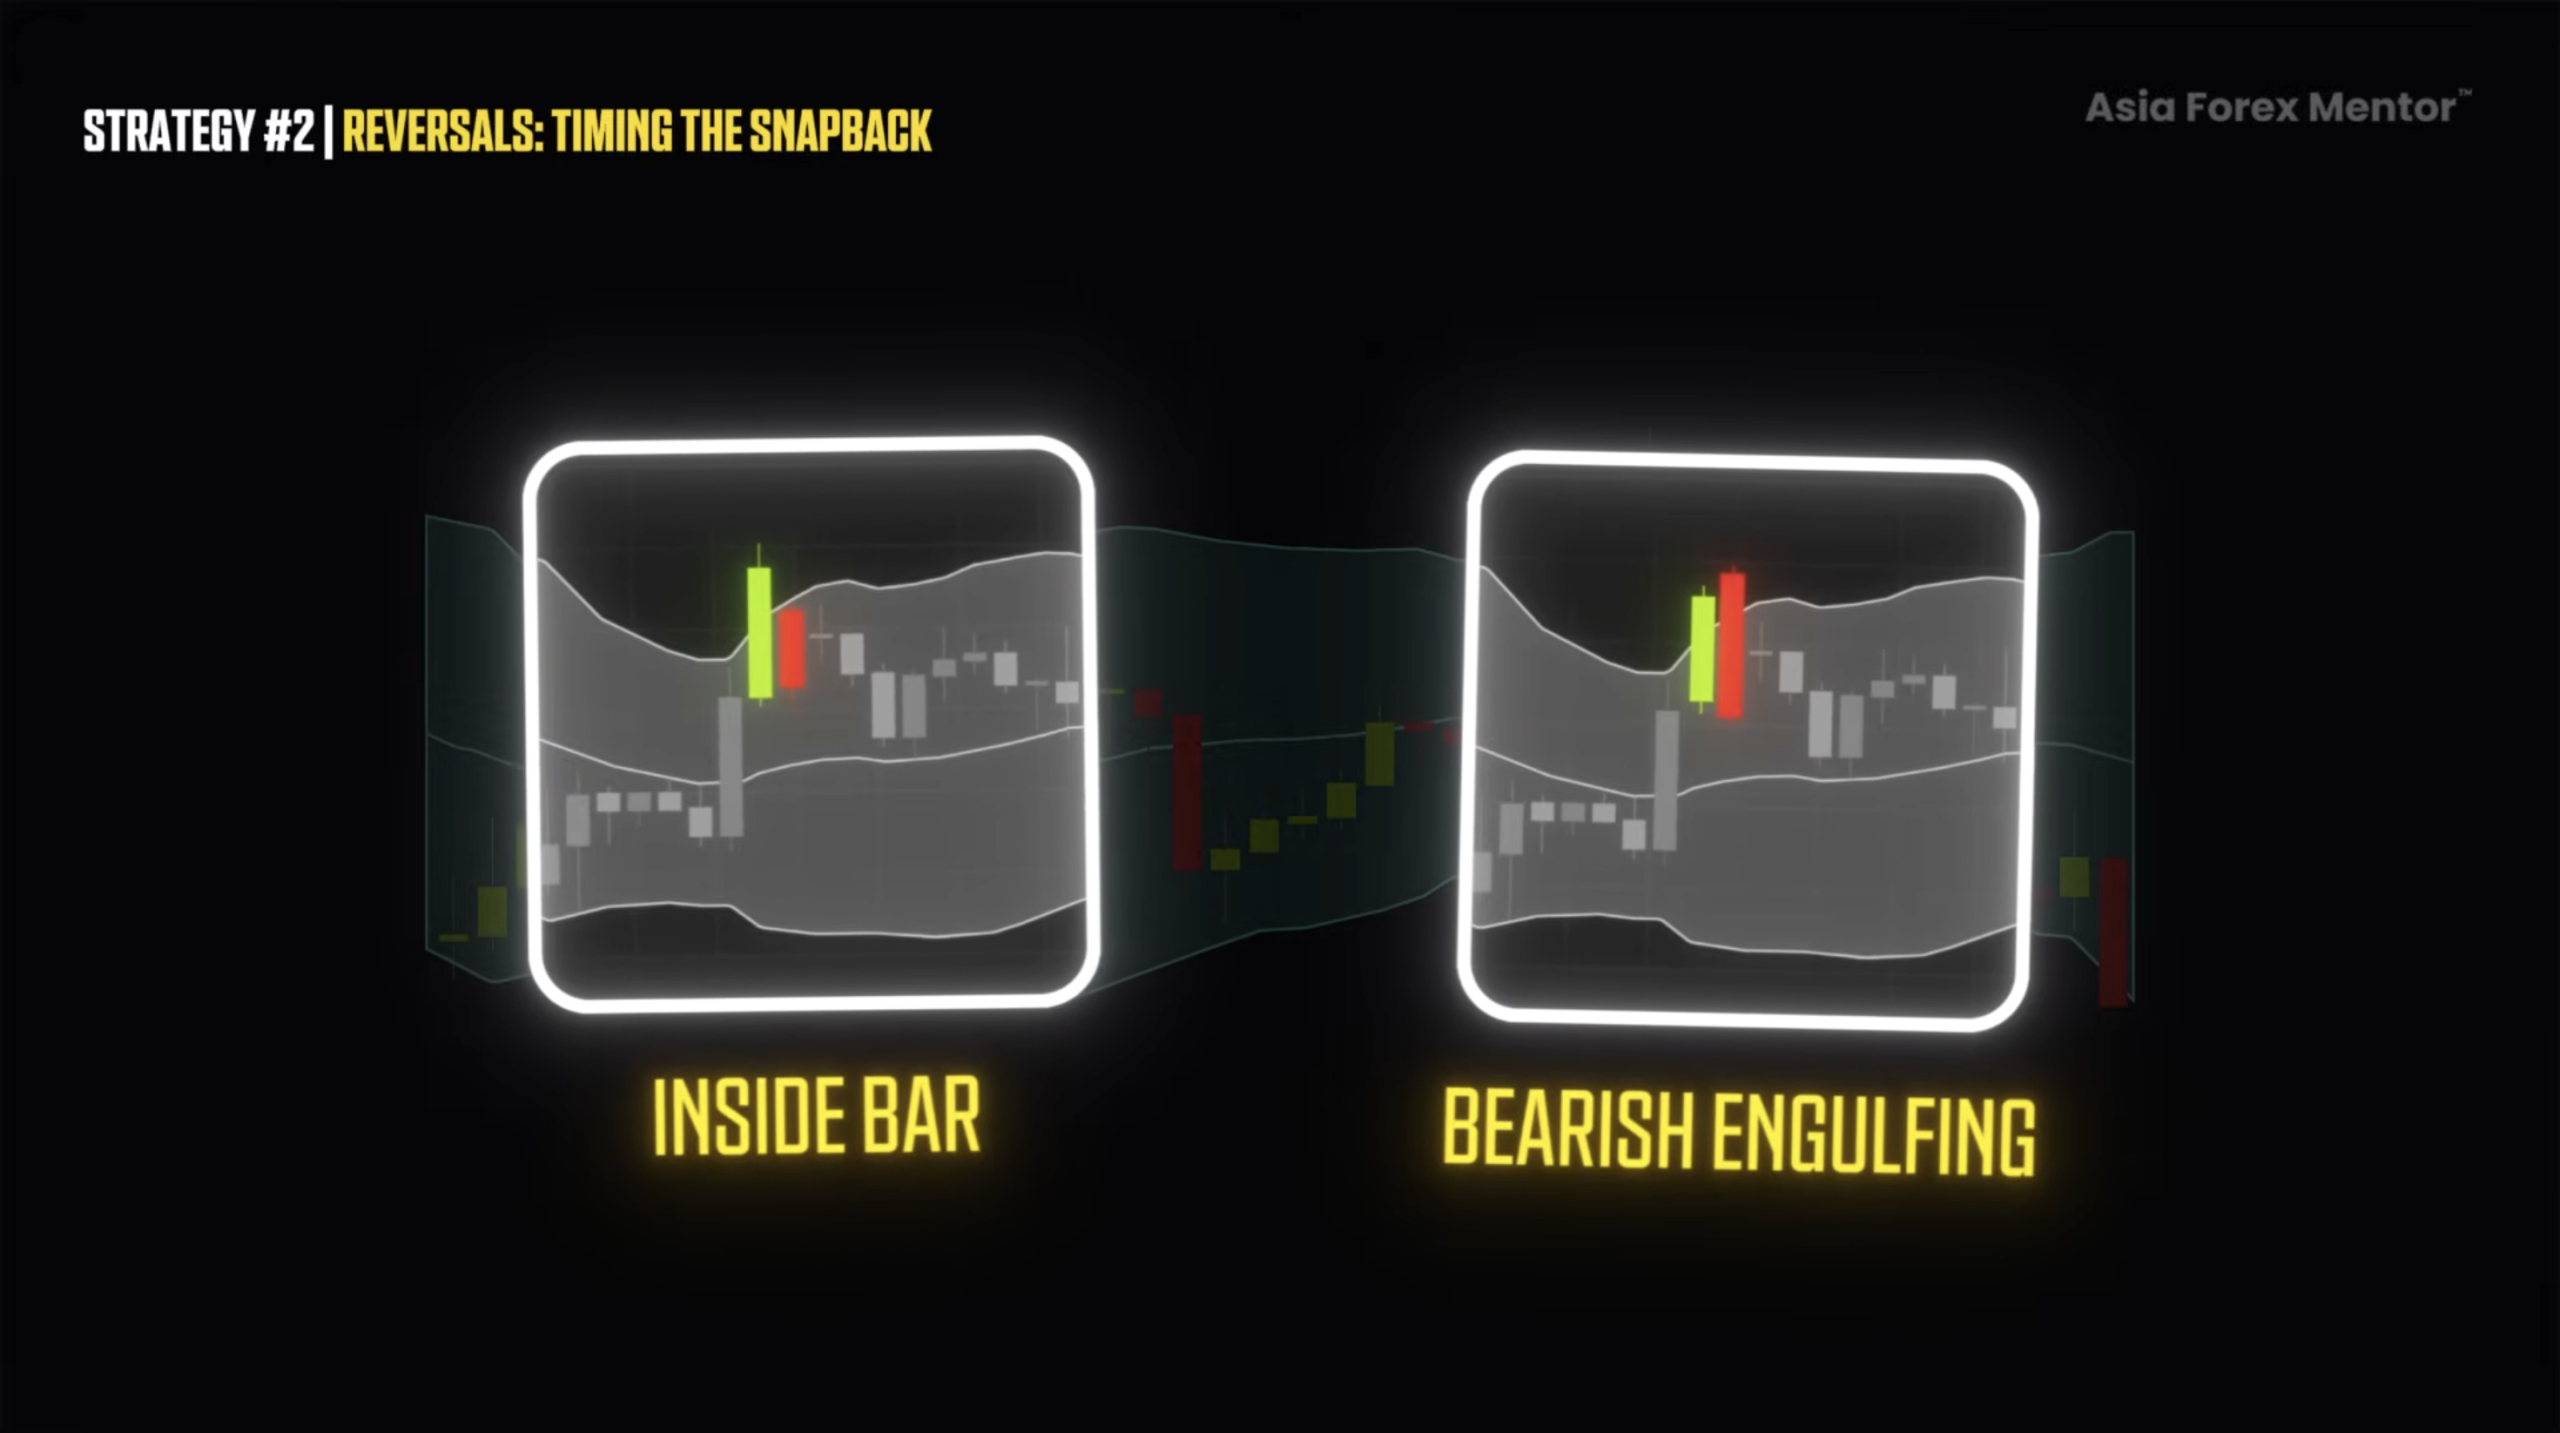
So we wait for confirmation.
That confirmation could be candlestick structure. It could be an inside bar. A bearish outside bar. A bearish engulfing bar. But we don’t stop there.
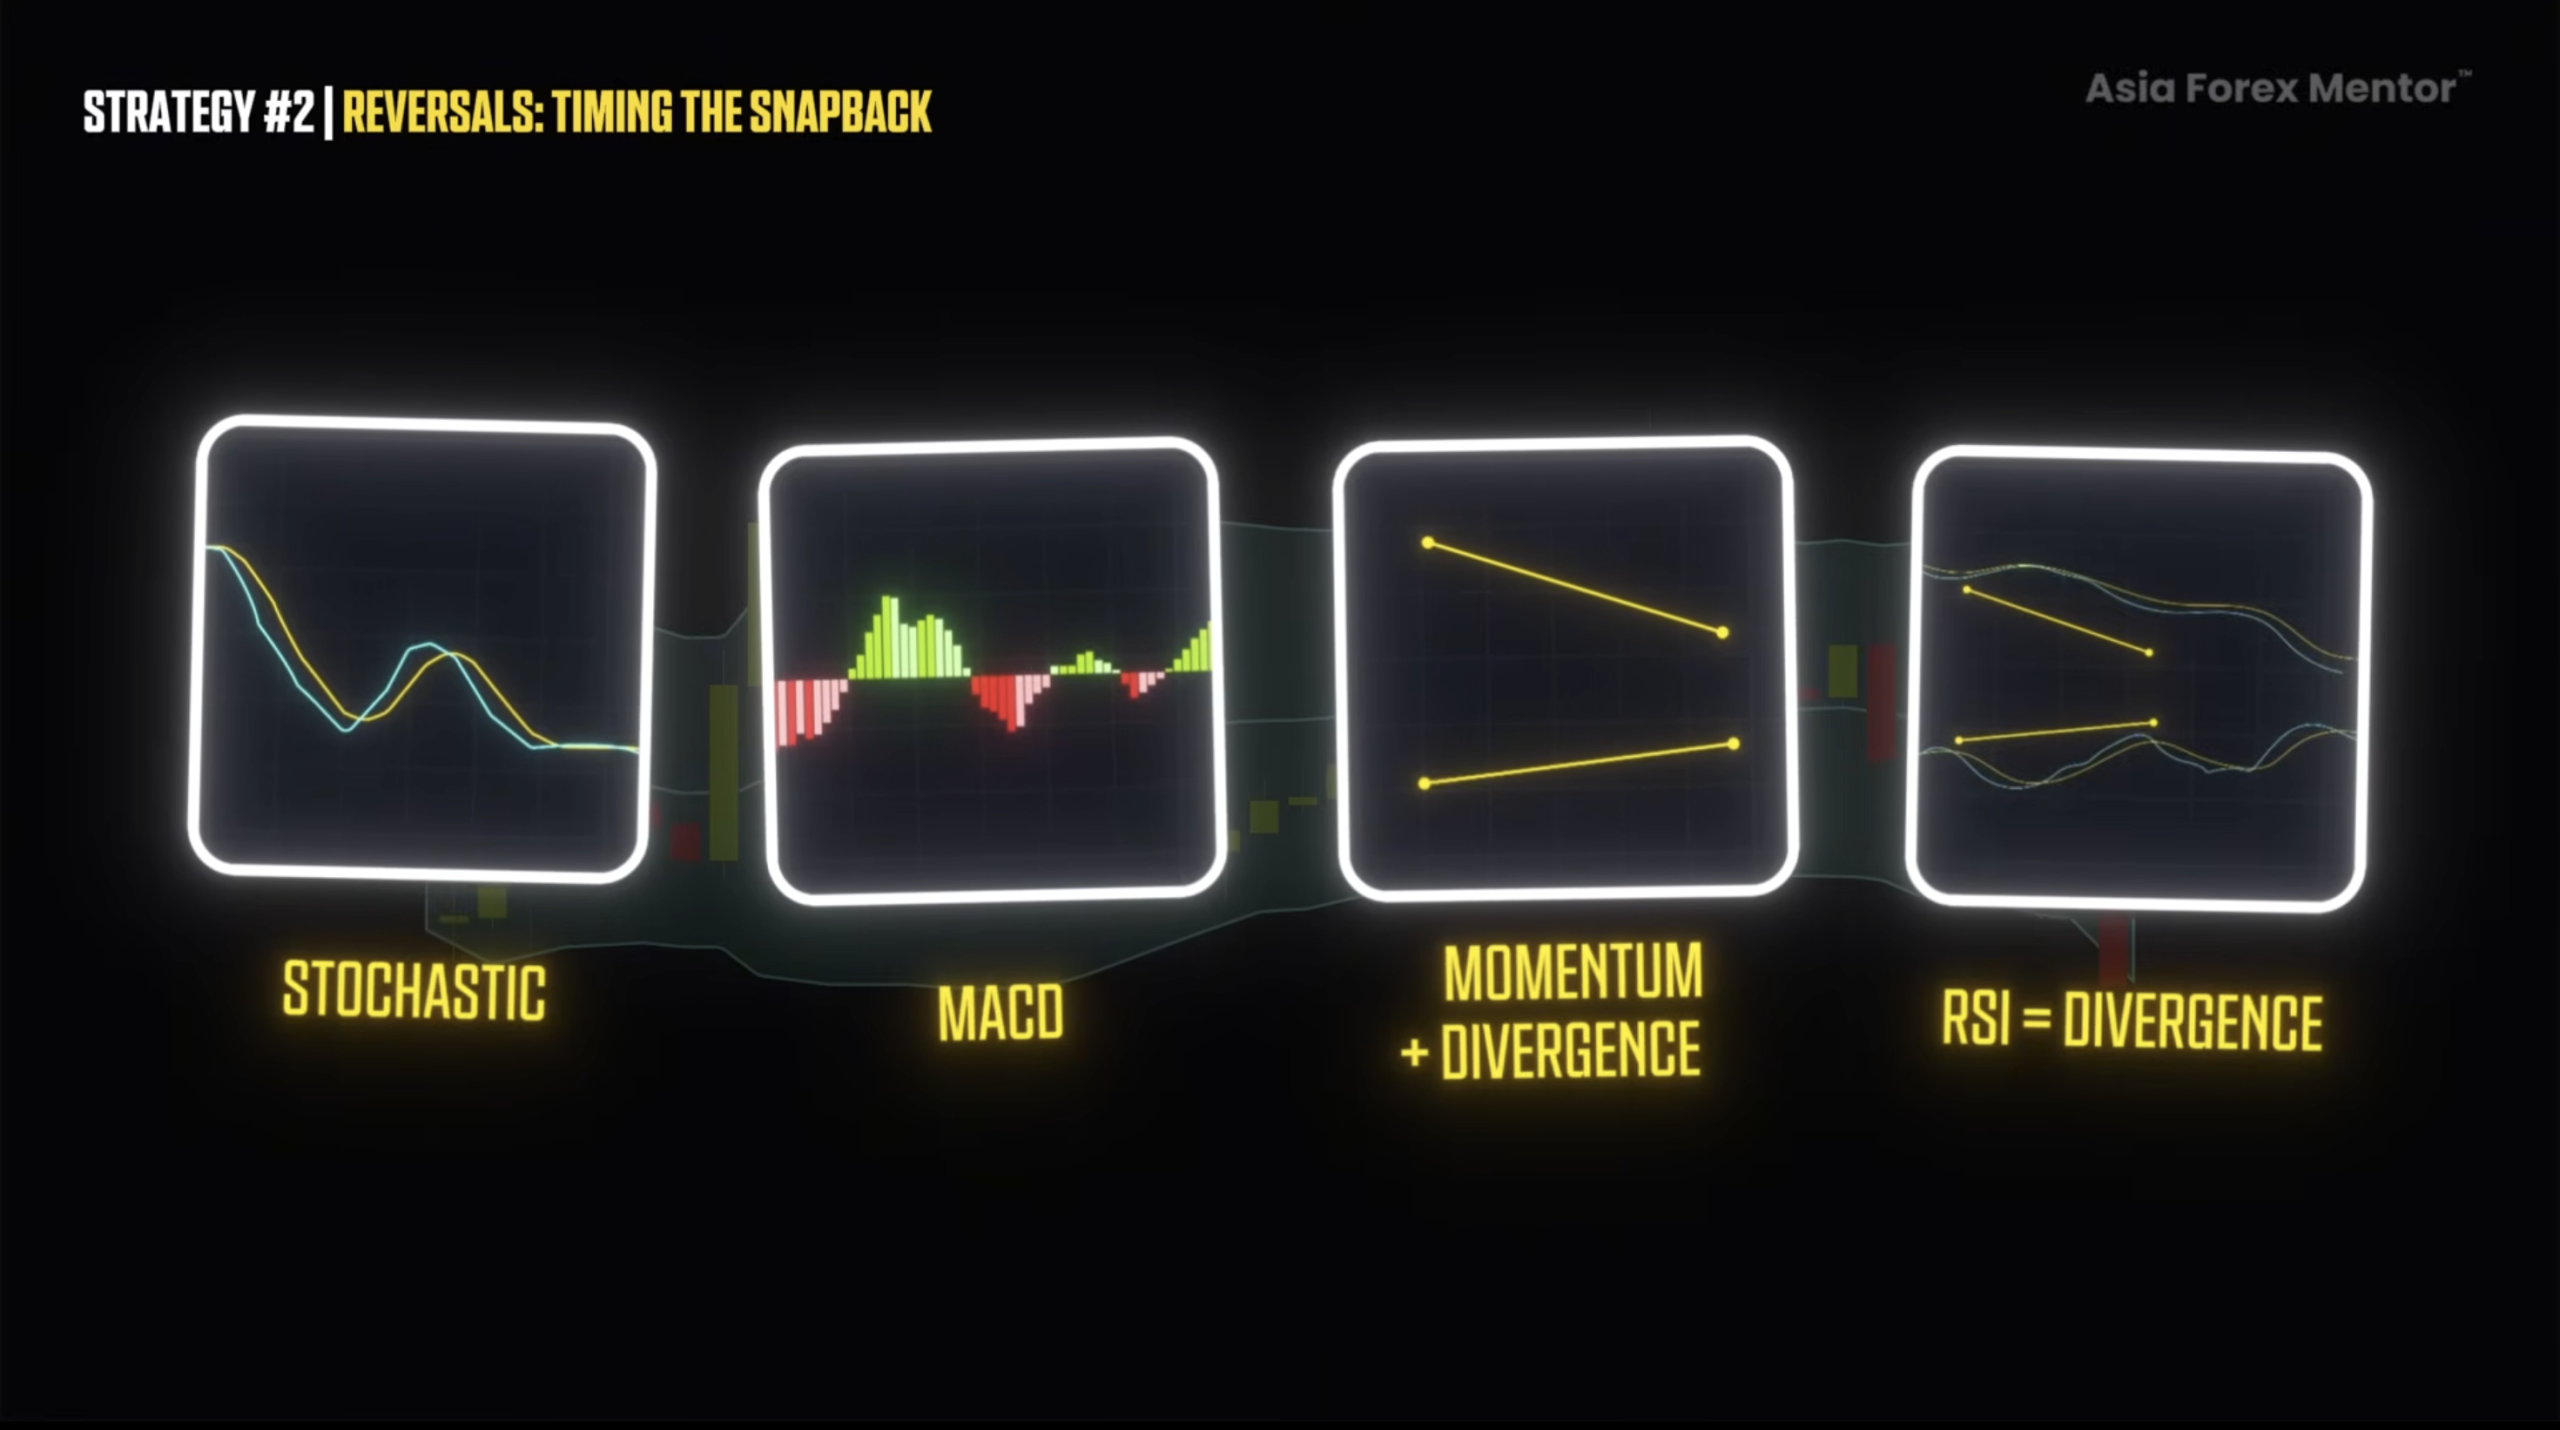
We add momentum confirmation. Stochastic oscillator. MACD. Divergence. RSI divergence if you want.
When you stack these confirmations together and you see the market is quiet, meaning price is moving sideways and the Bollinger Bands are flat and not expanded, the probability increases significantly.
This is the zone where the market ranges the most.
Once confirmation lines up, execution becomes simple.
You enter at the close of the bearish bar when selling. Stop loss goes above the bar. Take profit goes at the opposite Bollinger Band, especially if price has been touching it repeatedly.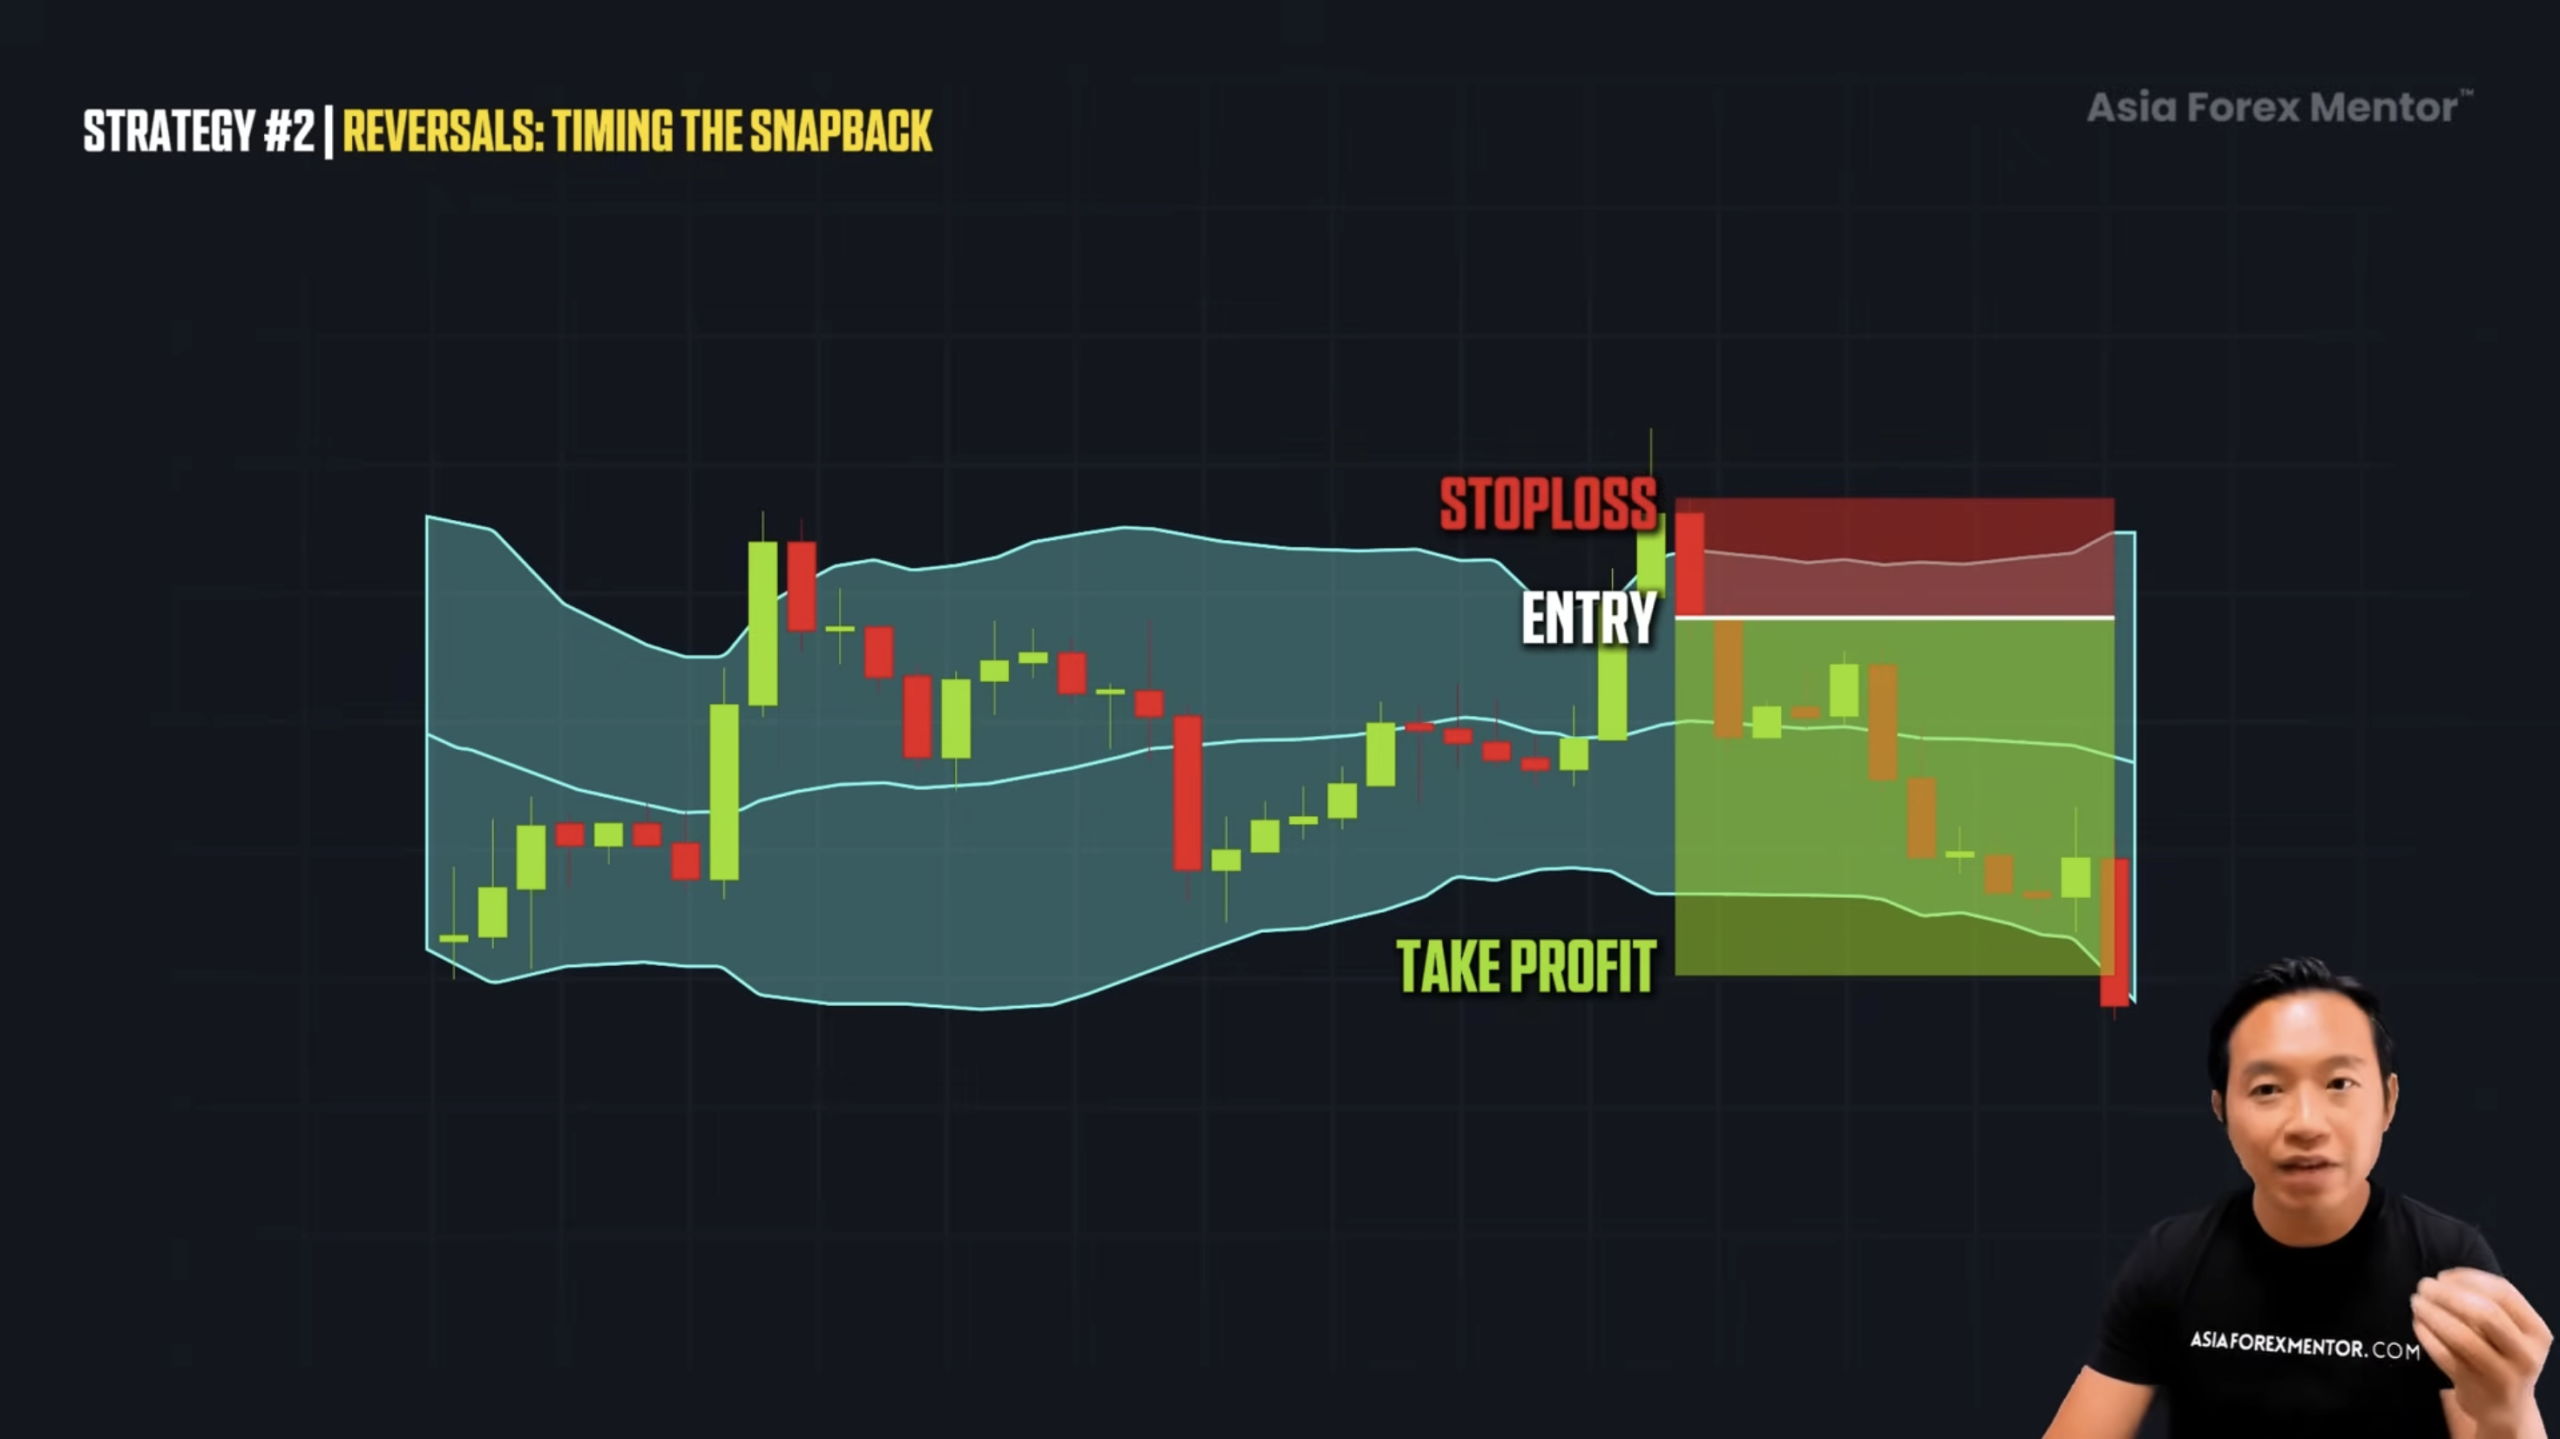
This allows you to sell near the top and buy near the bottom.
In quiet zones that happen most of the time, you can take multiple back-and-forth trades. Not all of them will be winners. That’s why risk-to-reward is important. Ideally, you want one to two or better.
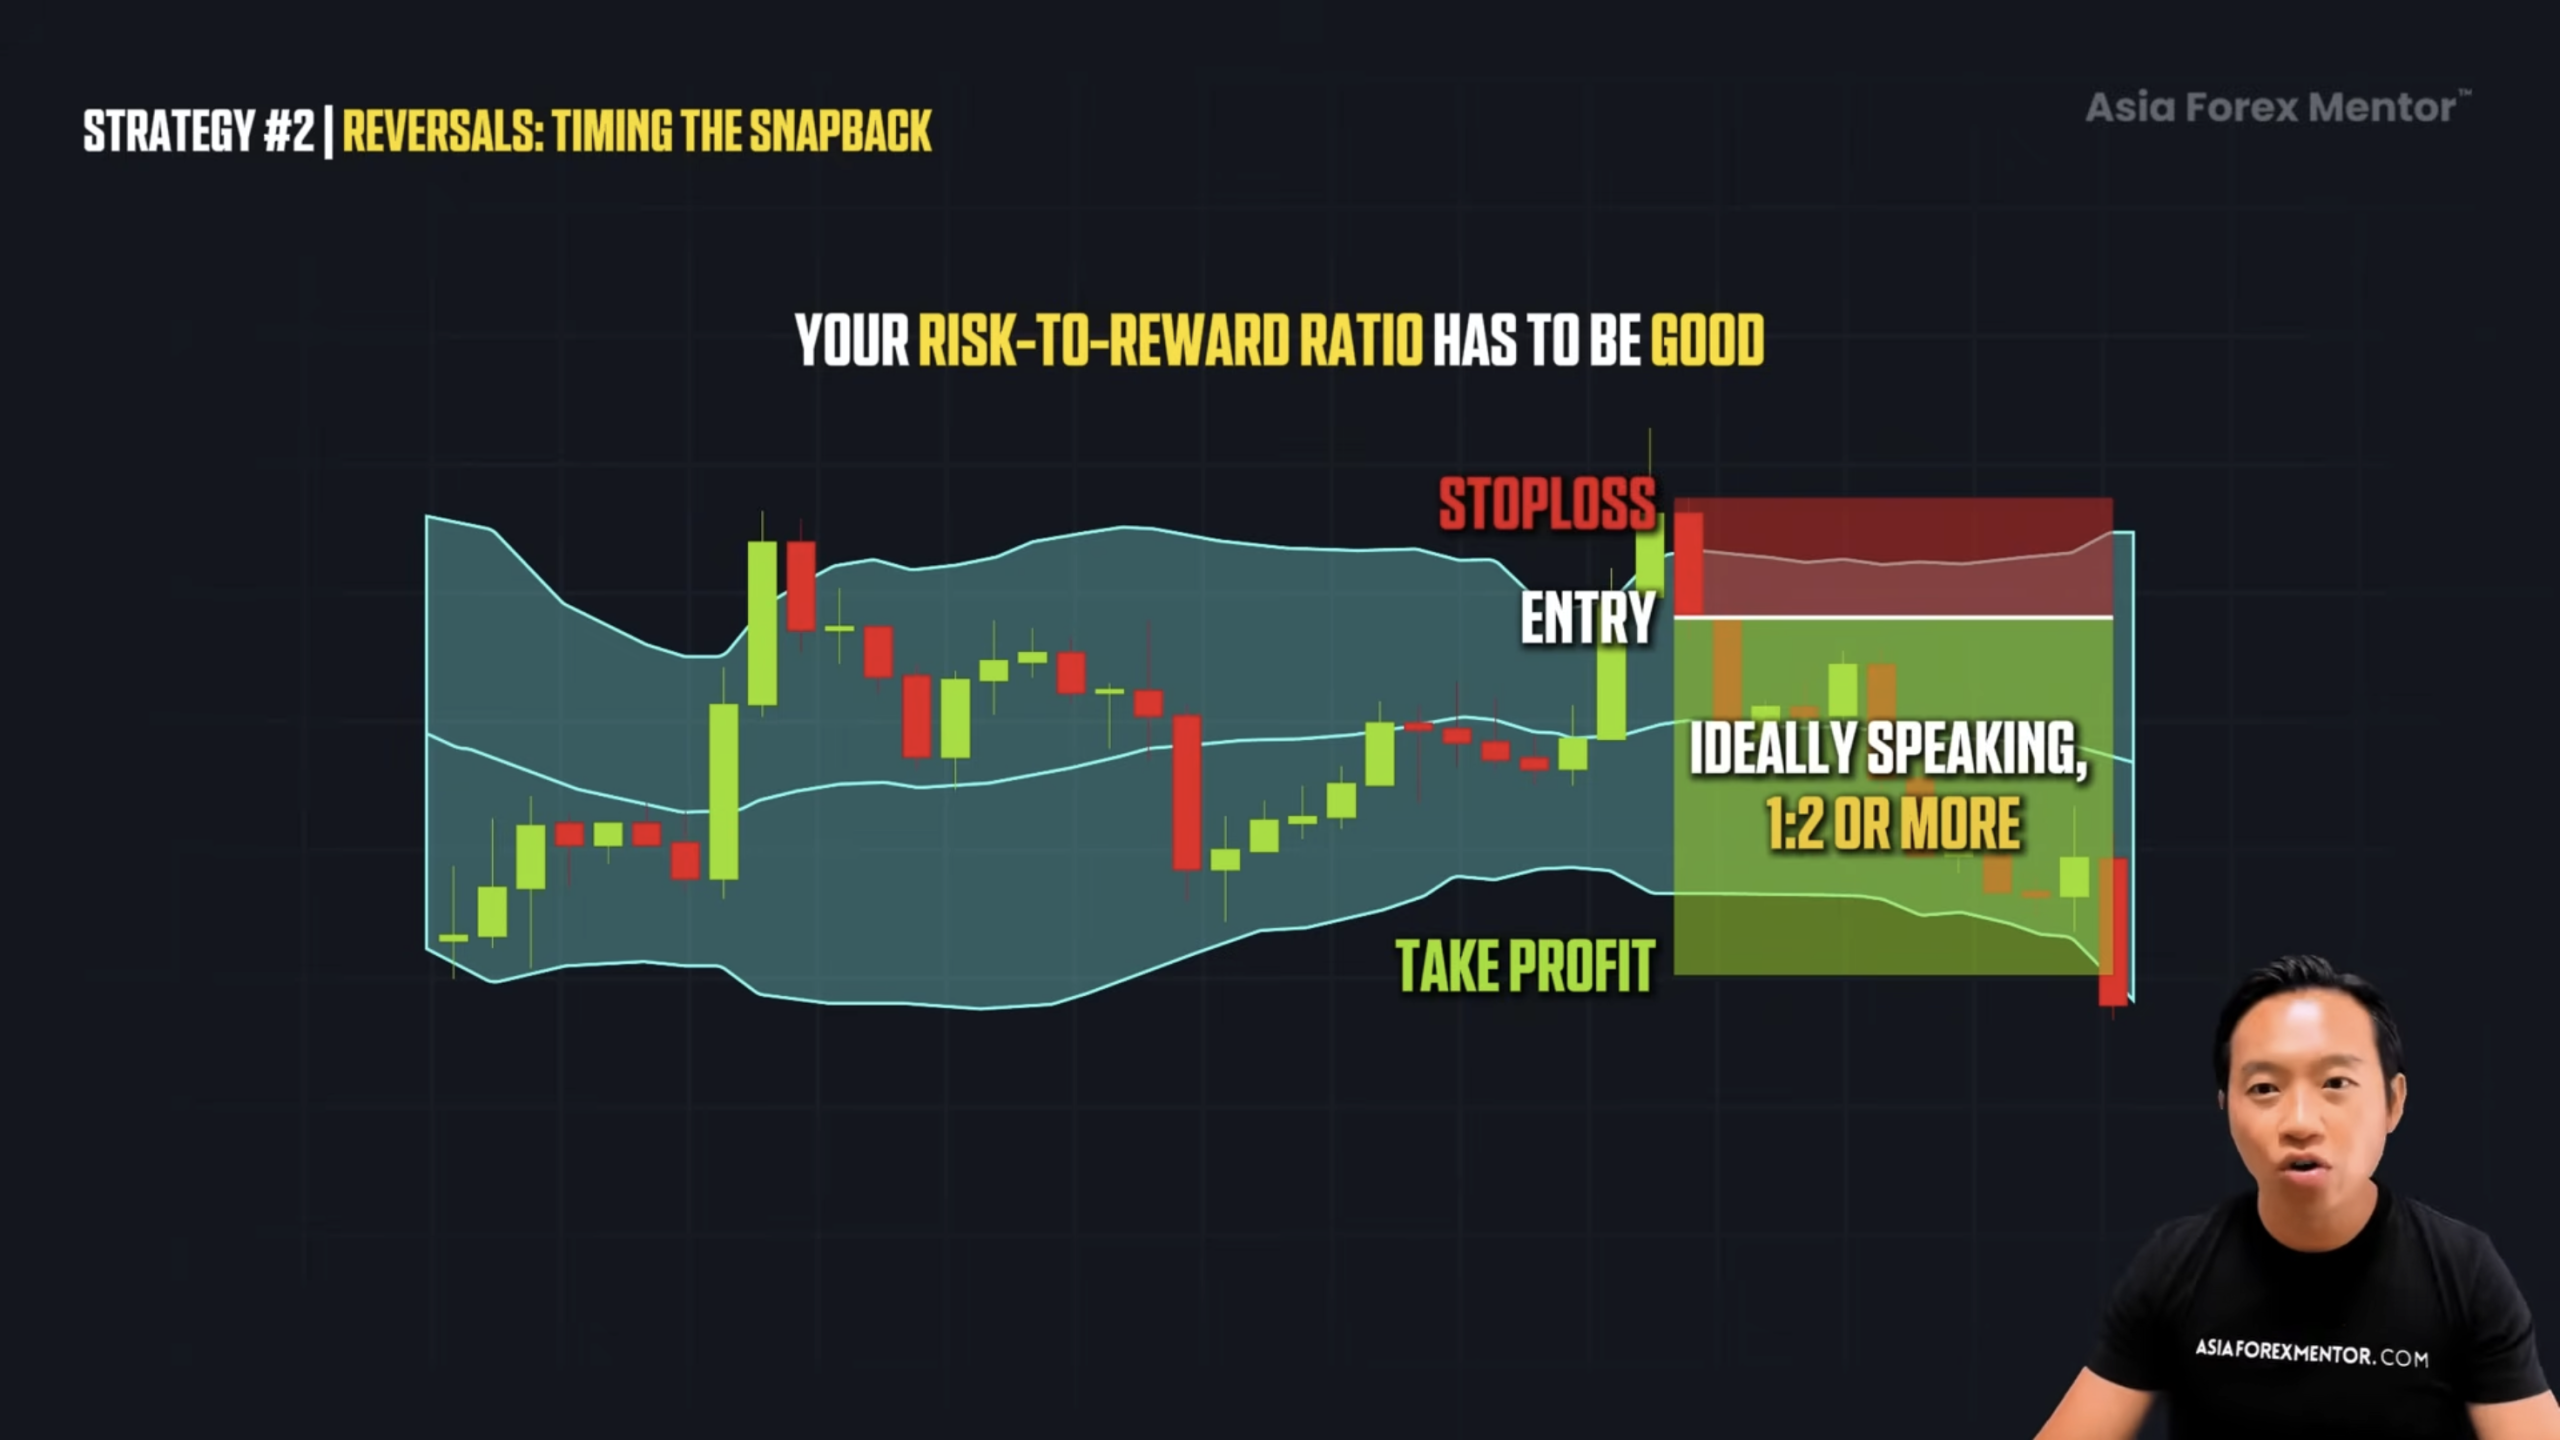
Even if you win only 50 percent of the time, you still come out ahead.
Strategy 3: Pullbacks – The Sniper Entry
Trading is not just about reversals and breakouts. We can also enter when the market pulls back.
Instead of running after candles that are already halfway gone, Bollinger Bands give you patience.
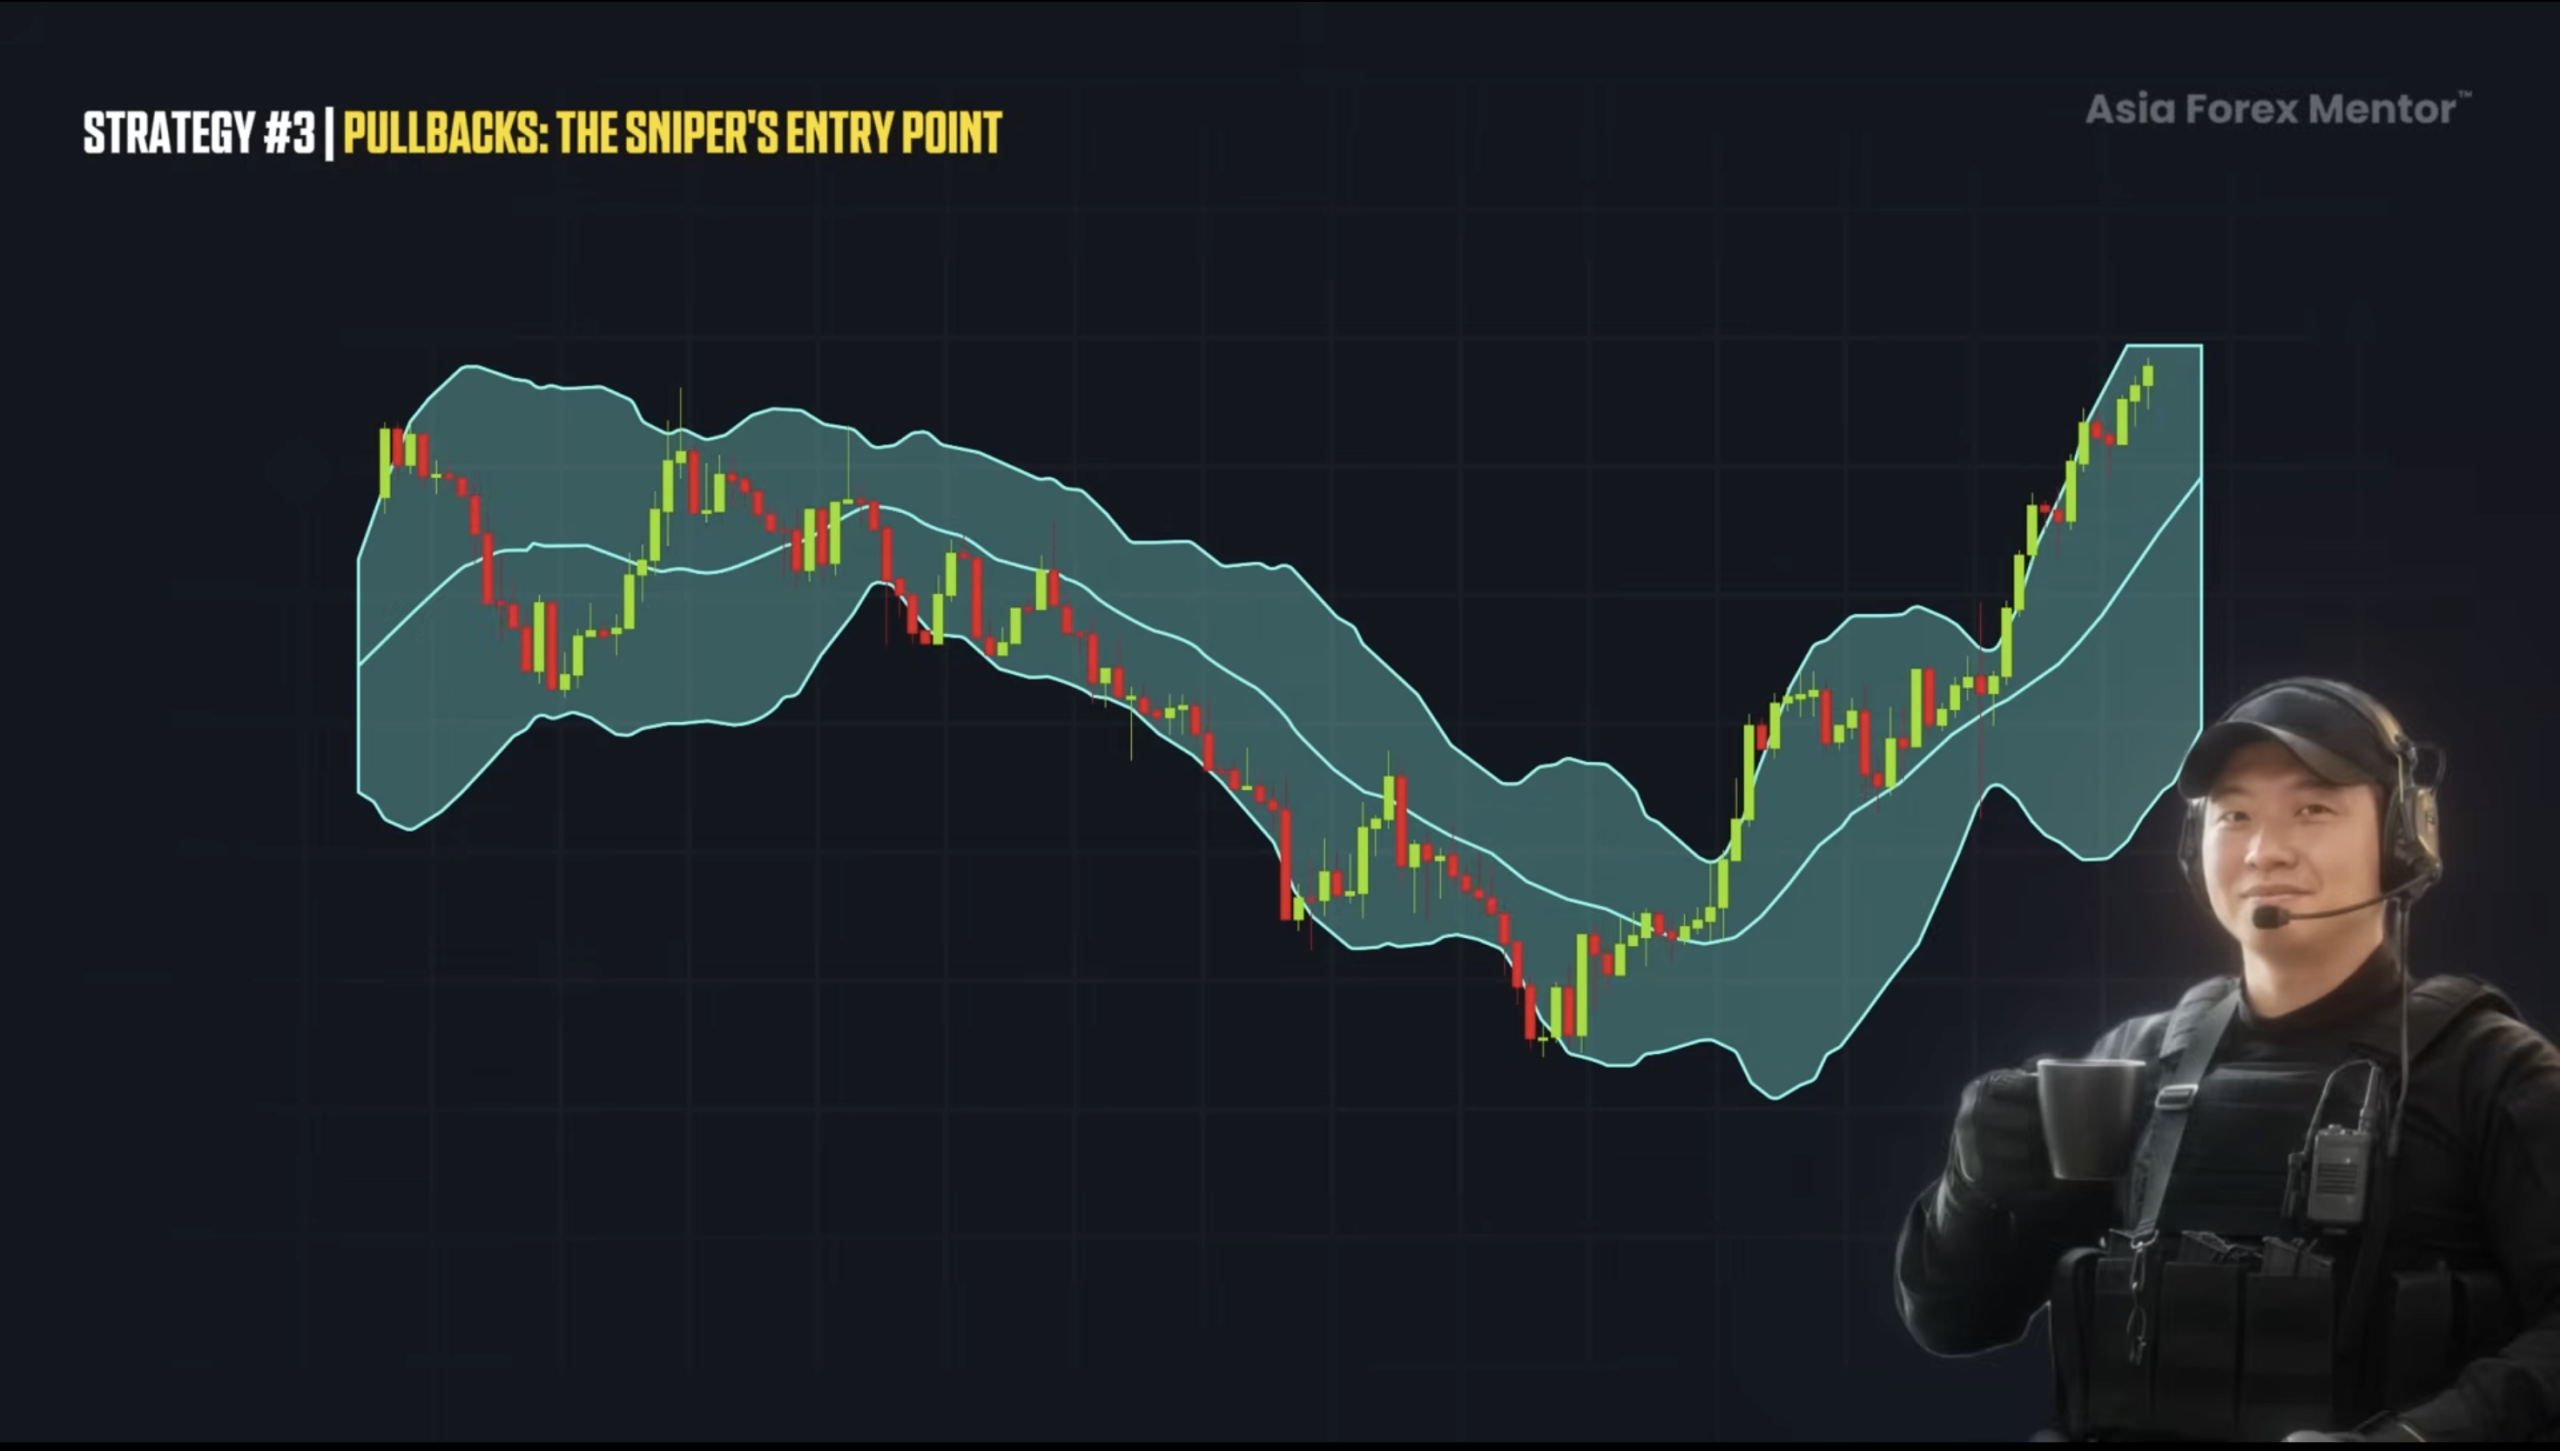
You wait for price to pull back to you before pulling the trigger.
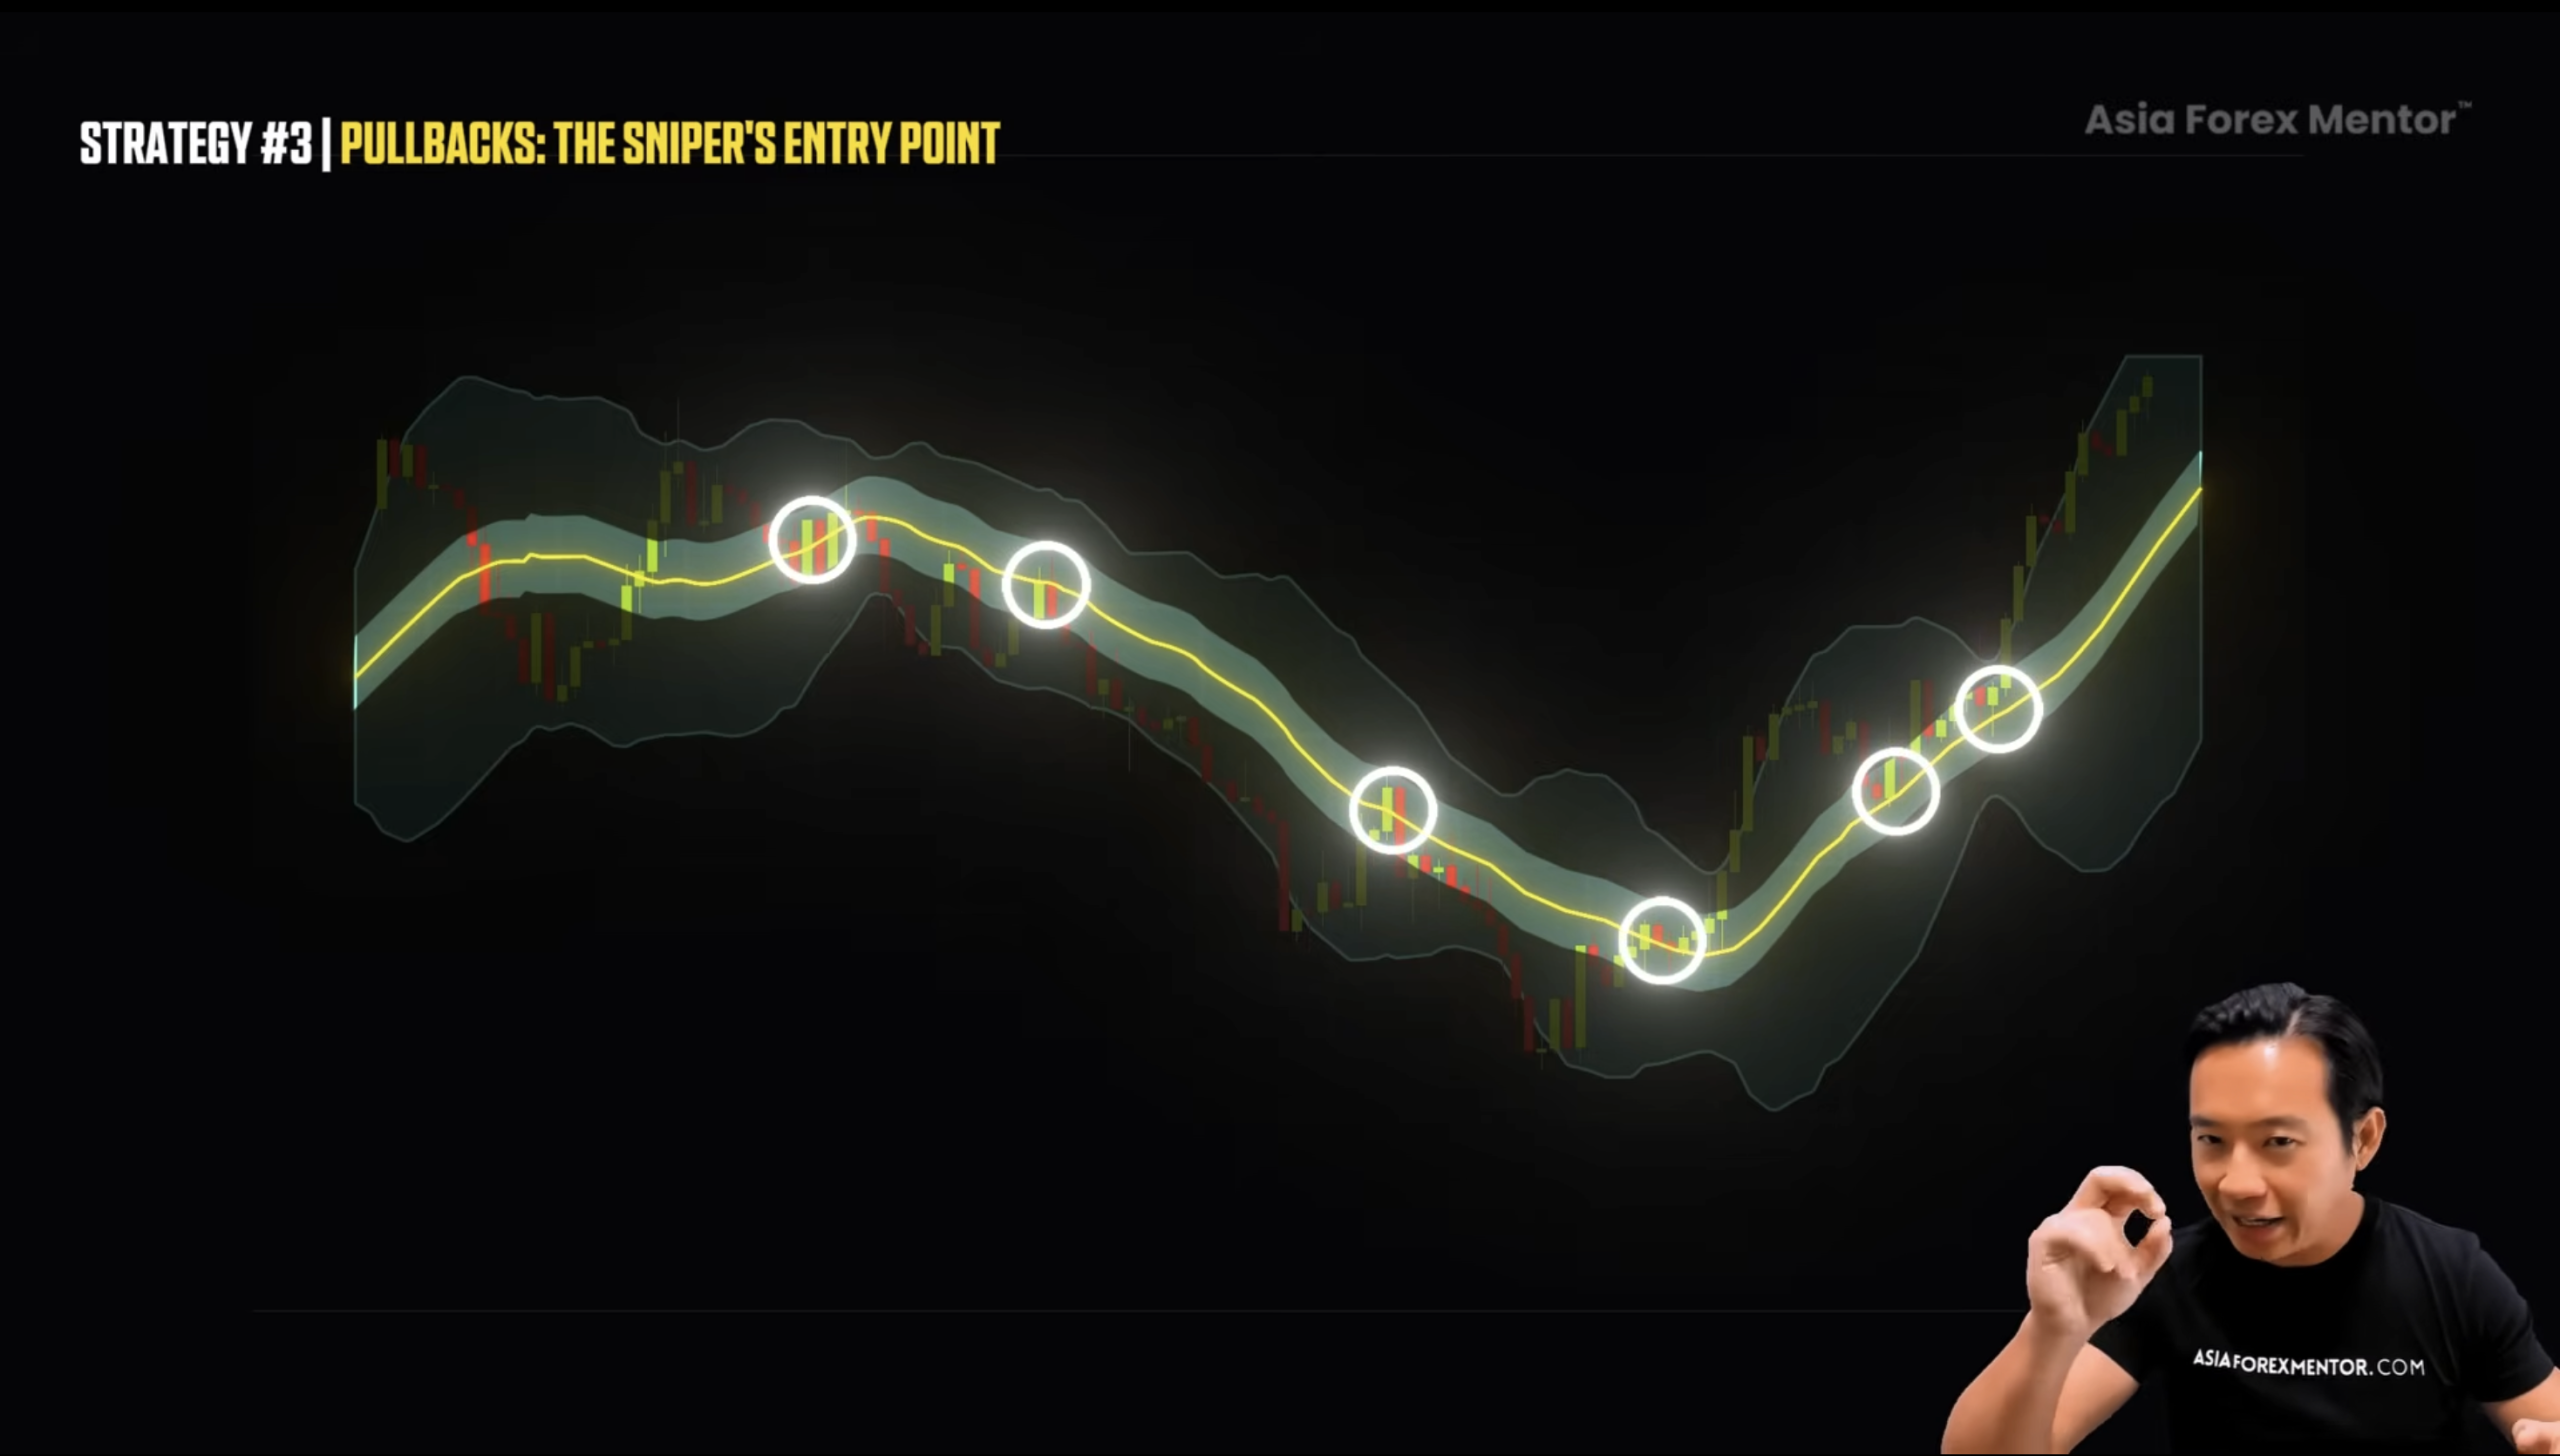
This is exactly what the middle Bollinger Band does.
The middle line acts like a magnet. Price pulls back toward that zone, and that’s where the next move is born.
When price is above the middle Bollinger Band and riding between the upper band and the middle band, that’s an uptrend.
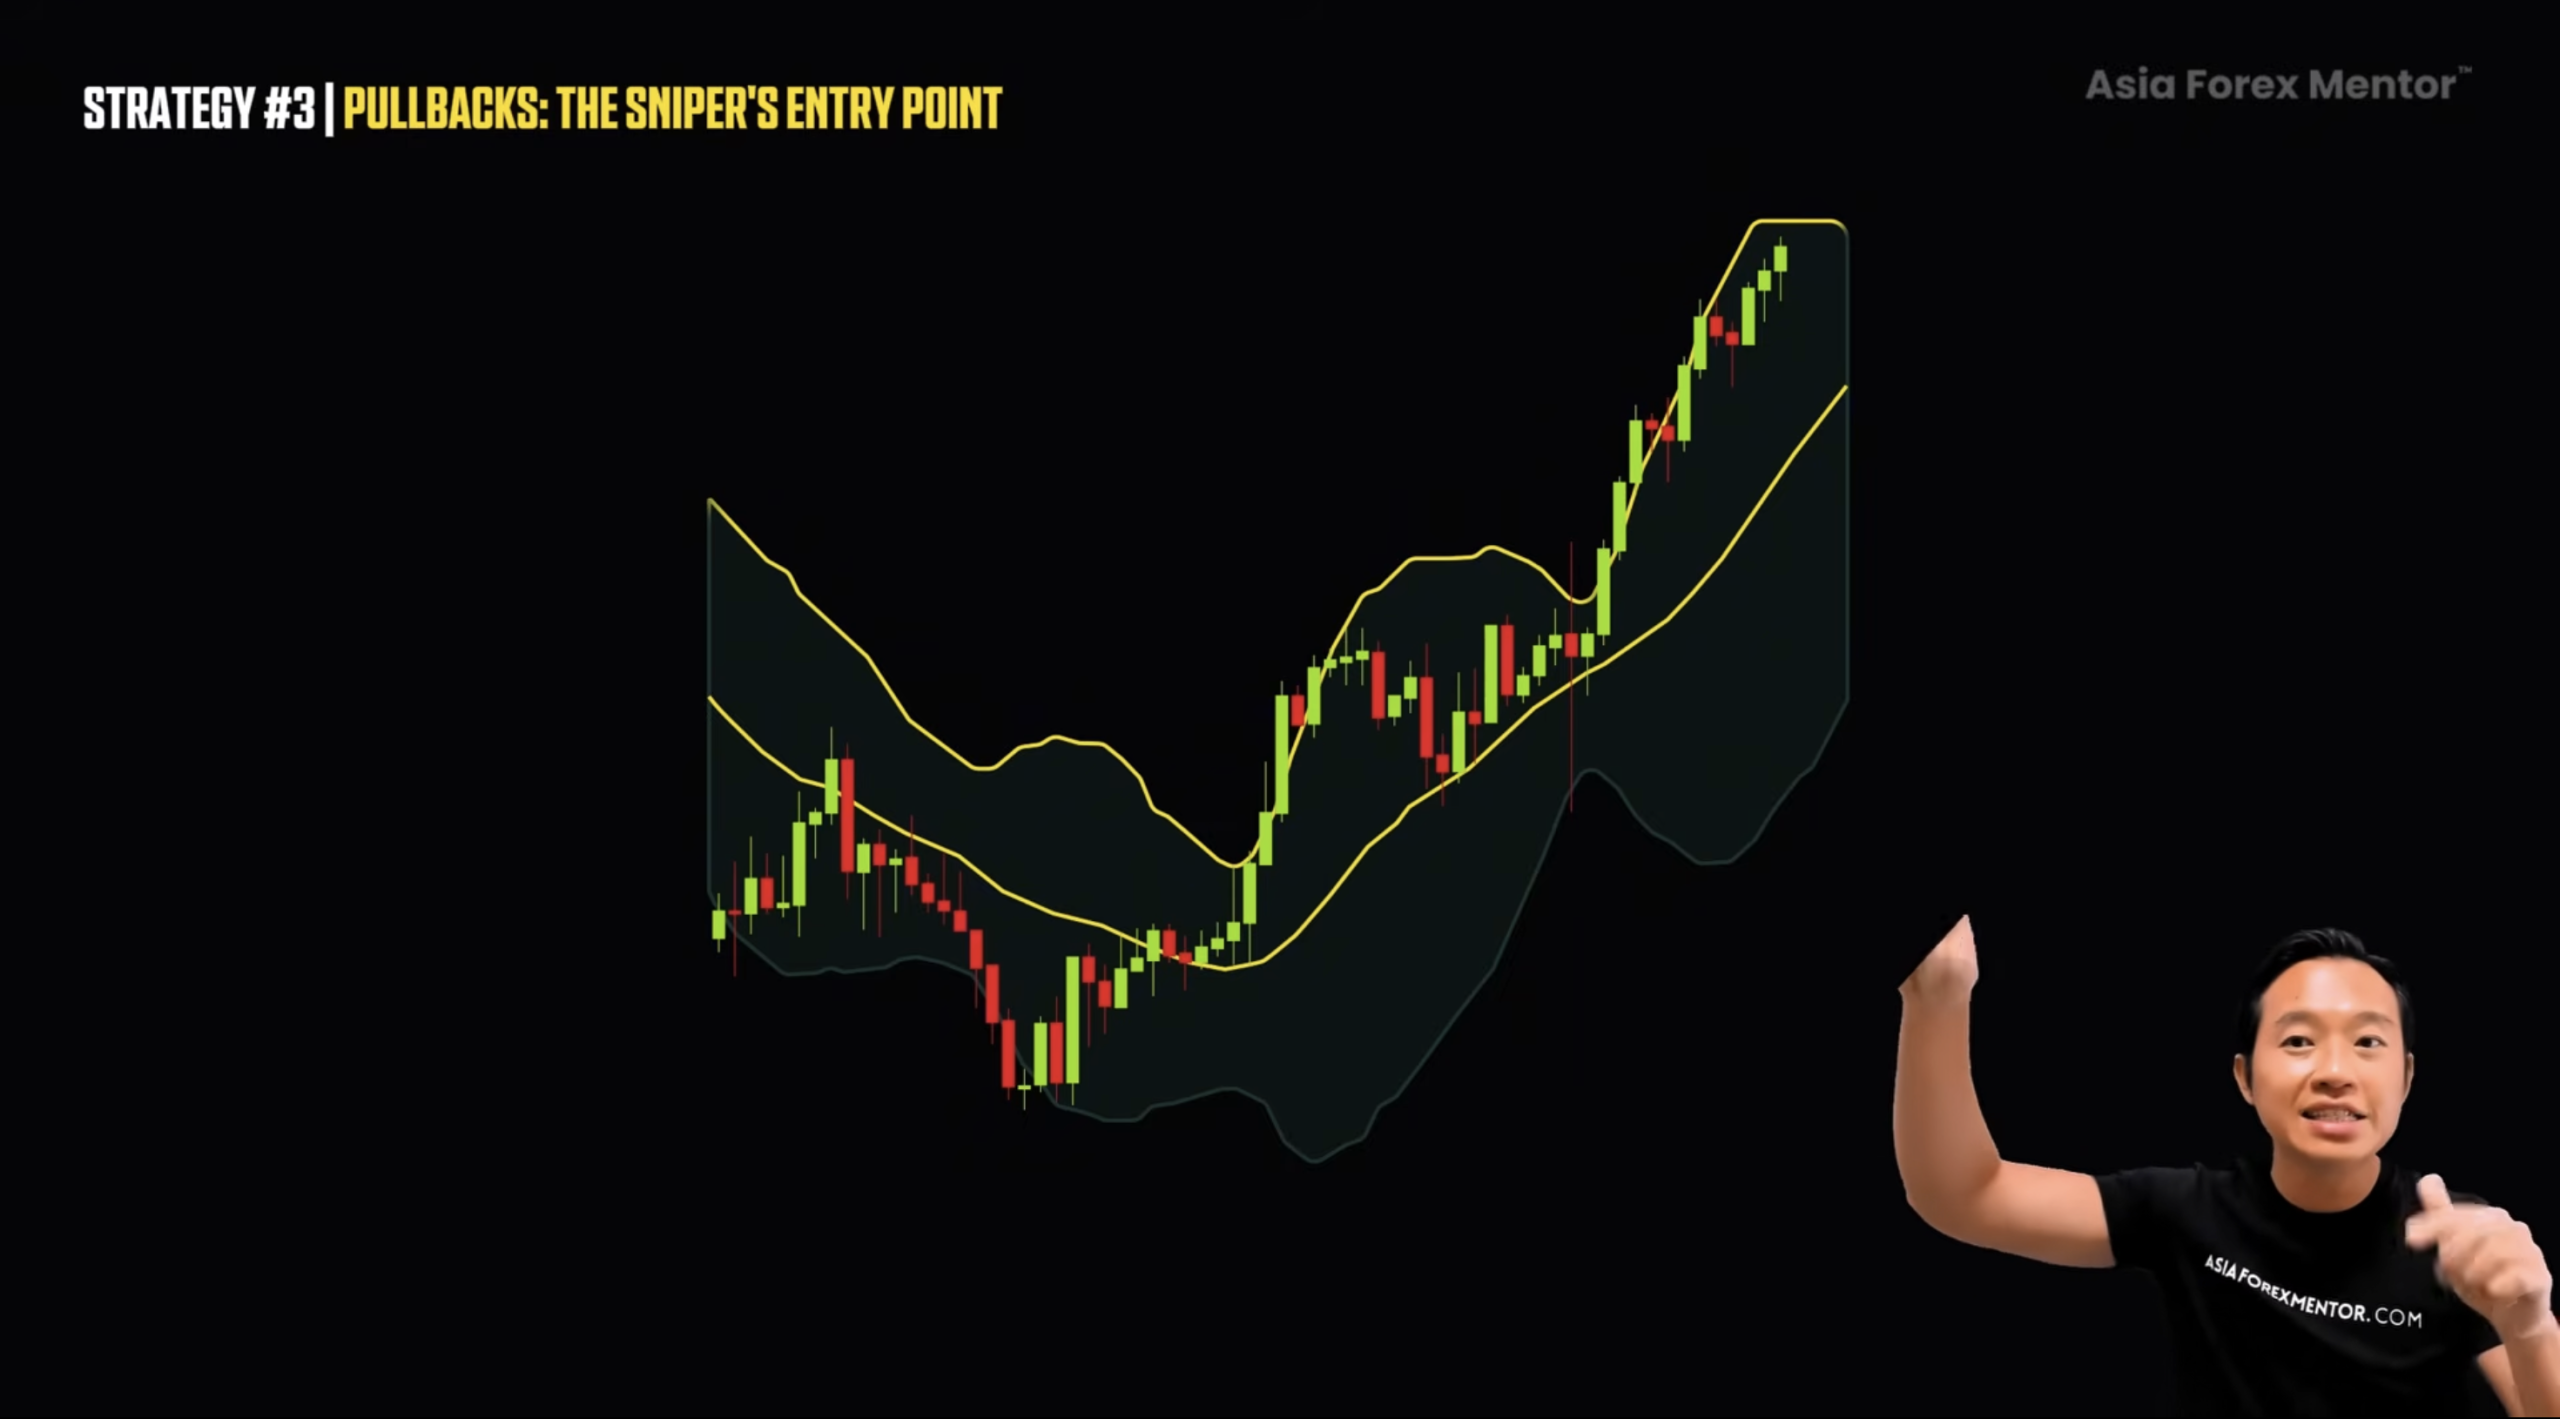
In that situation, we don’t want to sell.
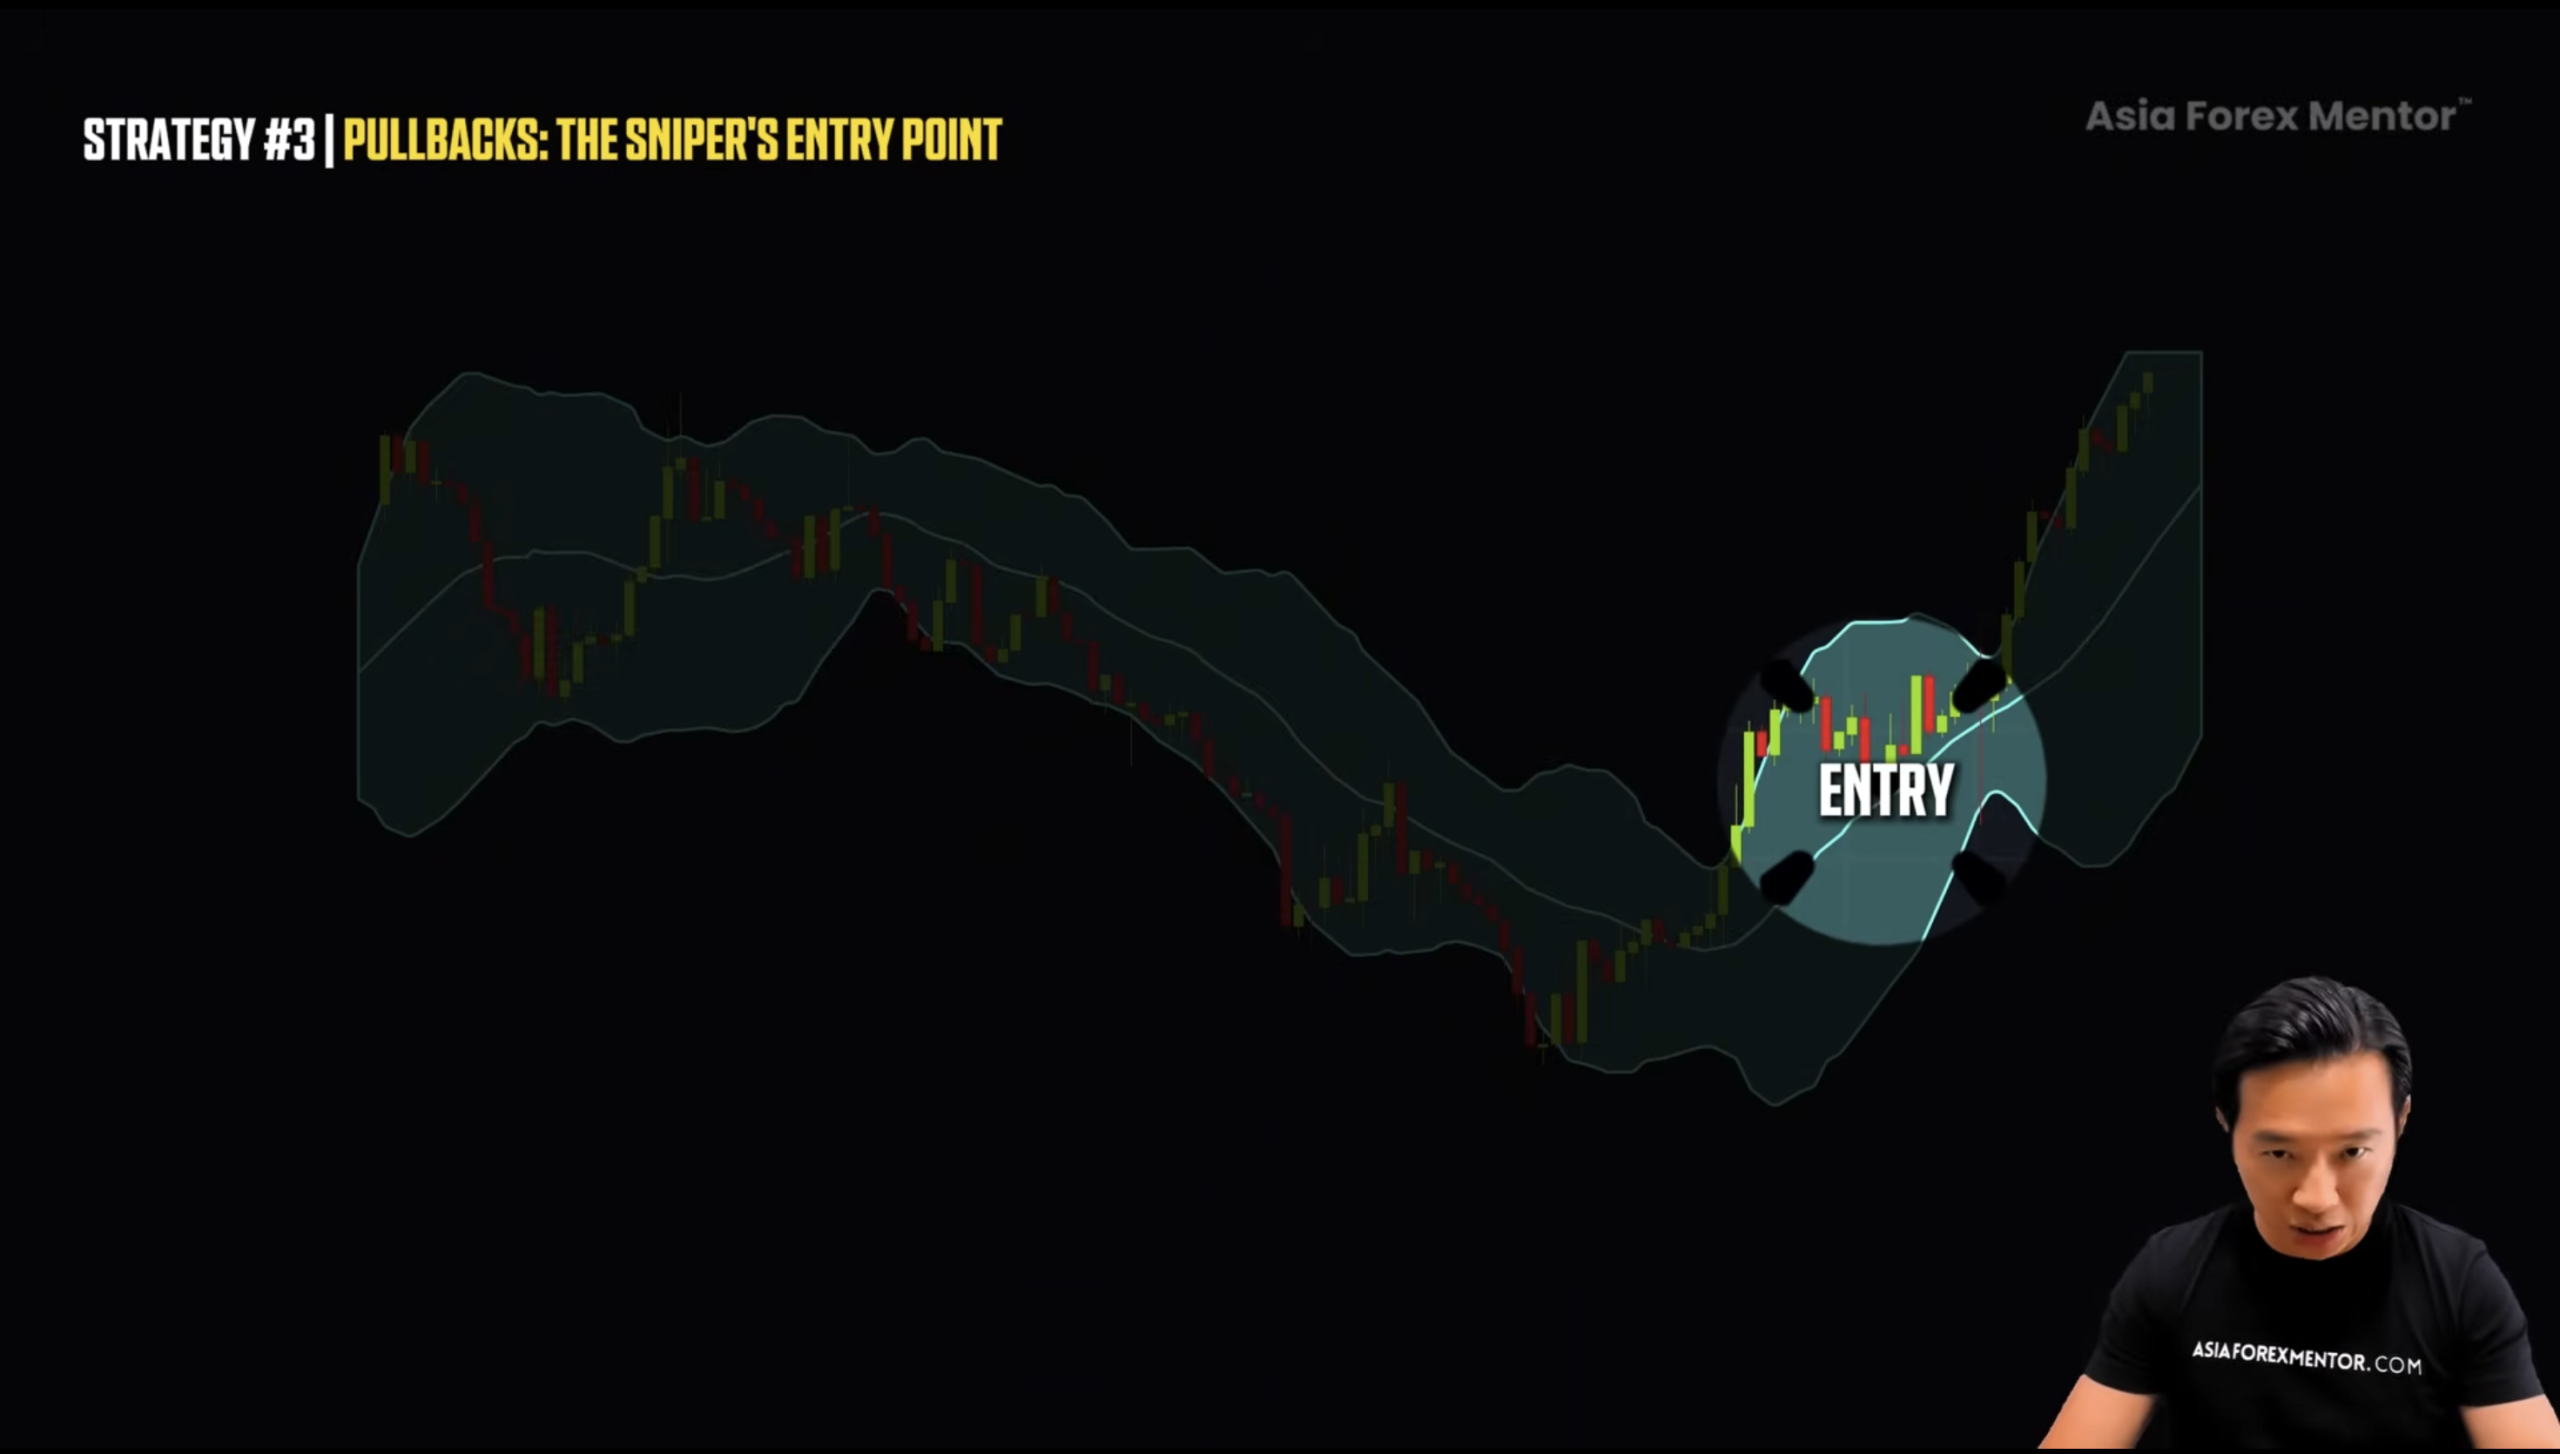
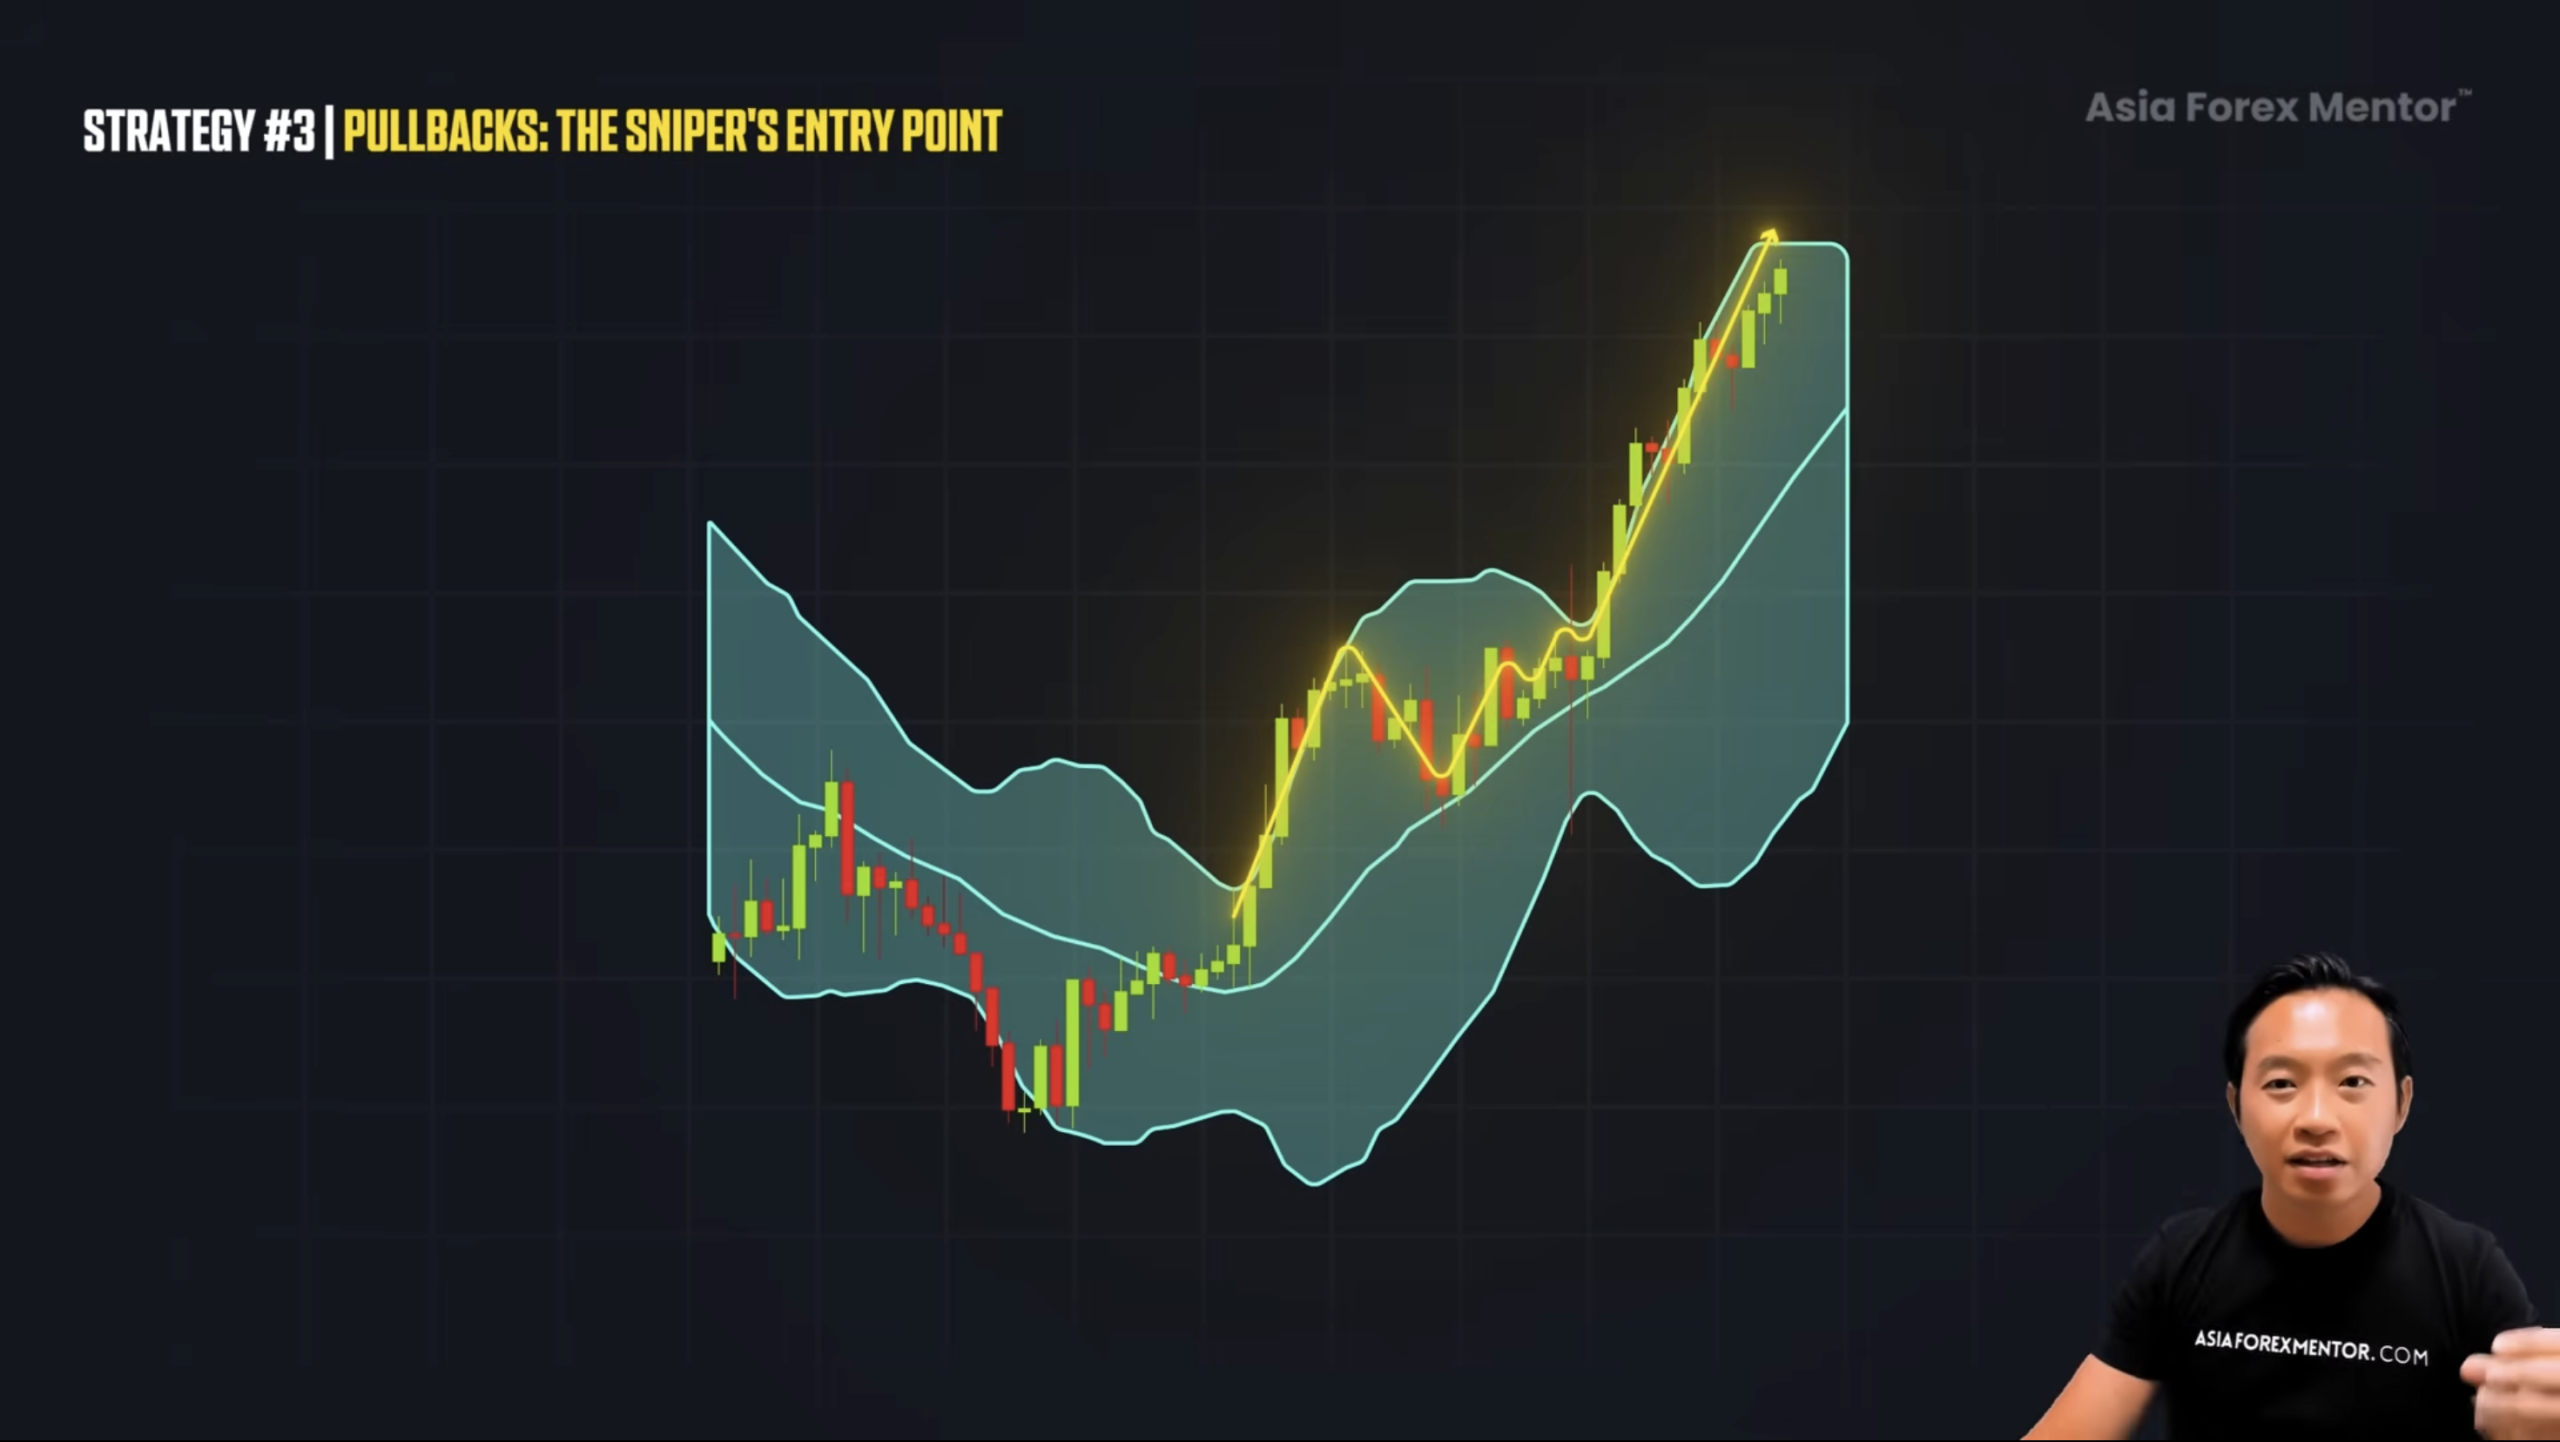
After a breakout, price can stay within the bands or even above them. But if you miss the breakout, that doesn’t mean the opportunity is gone.
You can enter when price pulls back to the middle Bollinger Band. That becomes your precise entry.
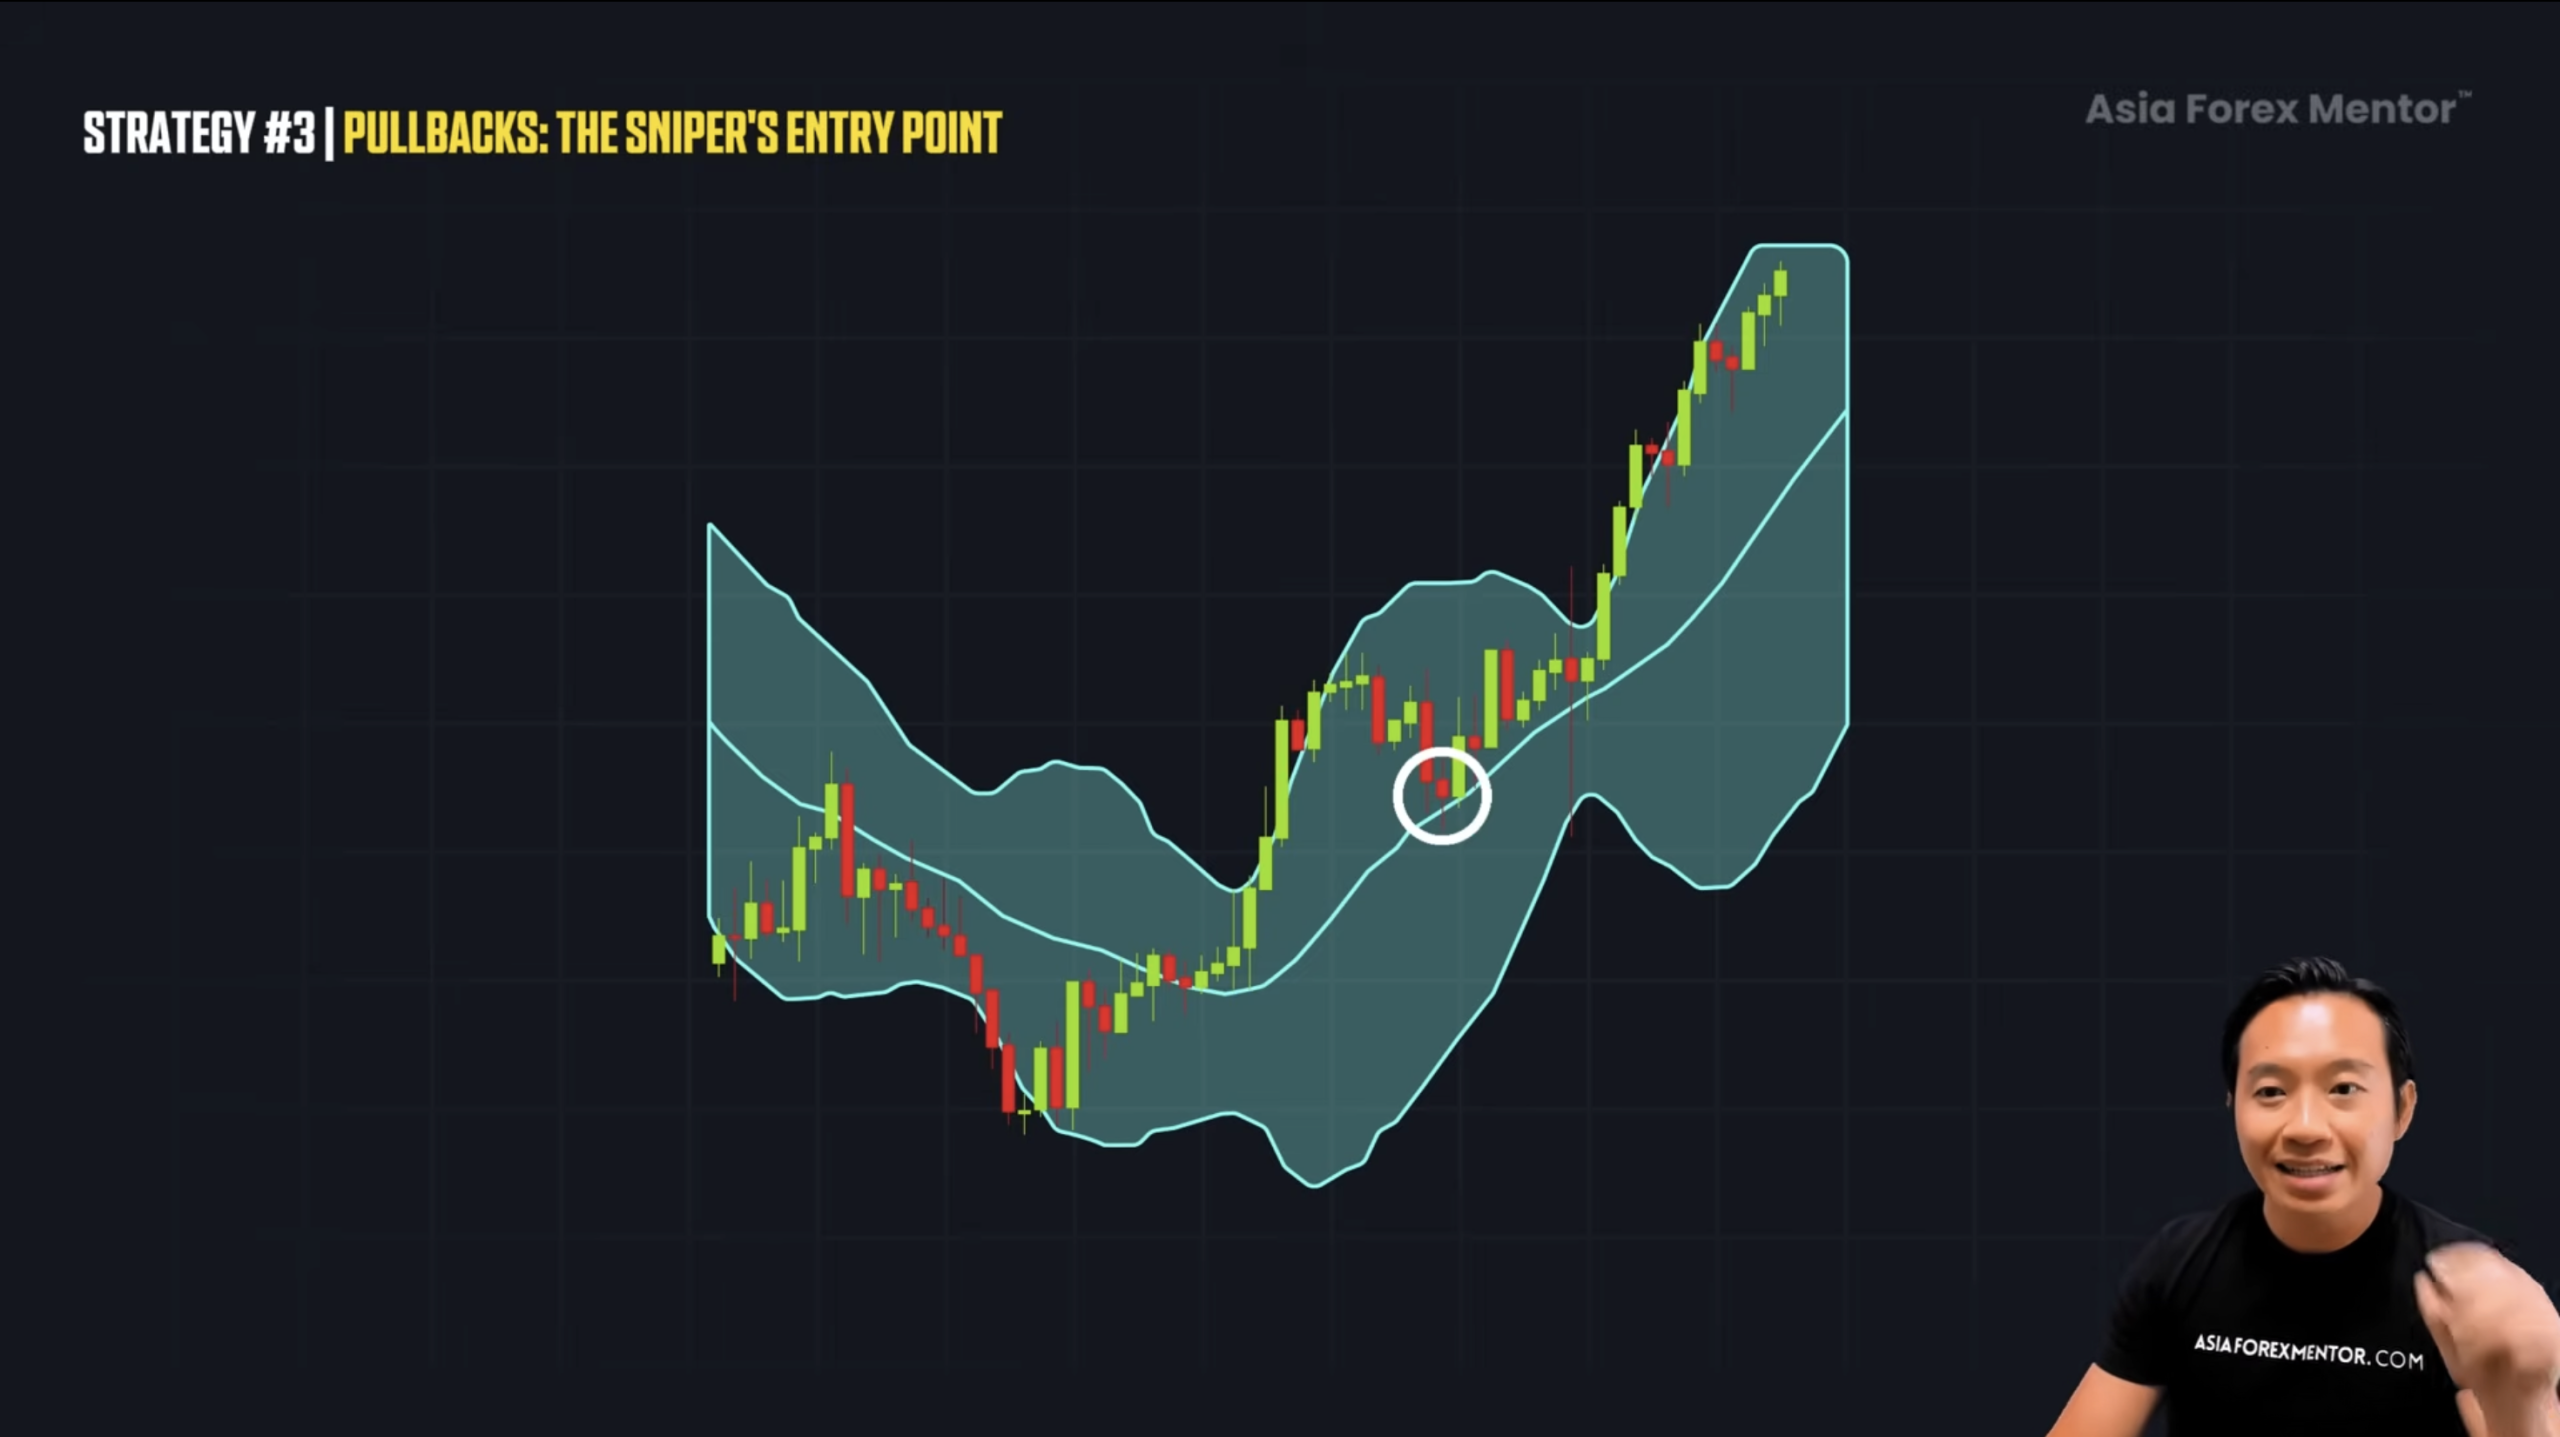
Think of it like the market taking a breath. Price cannot go up forever. It needs to pause, retrace, and reset before moving again.
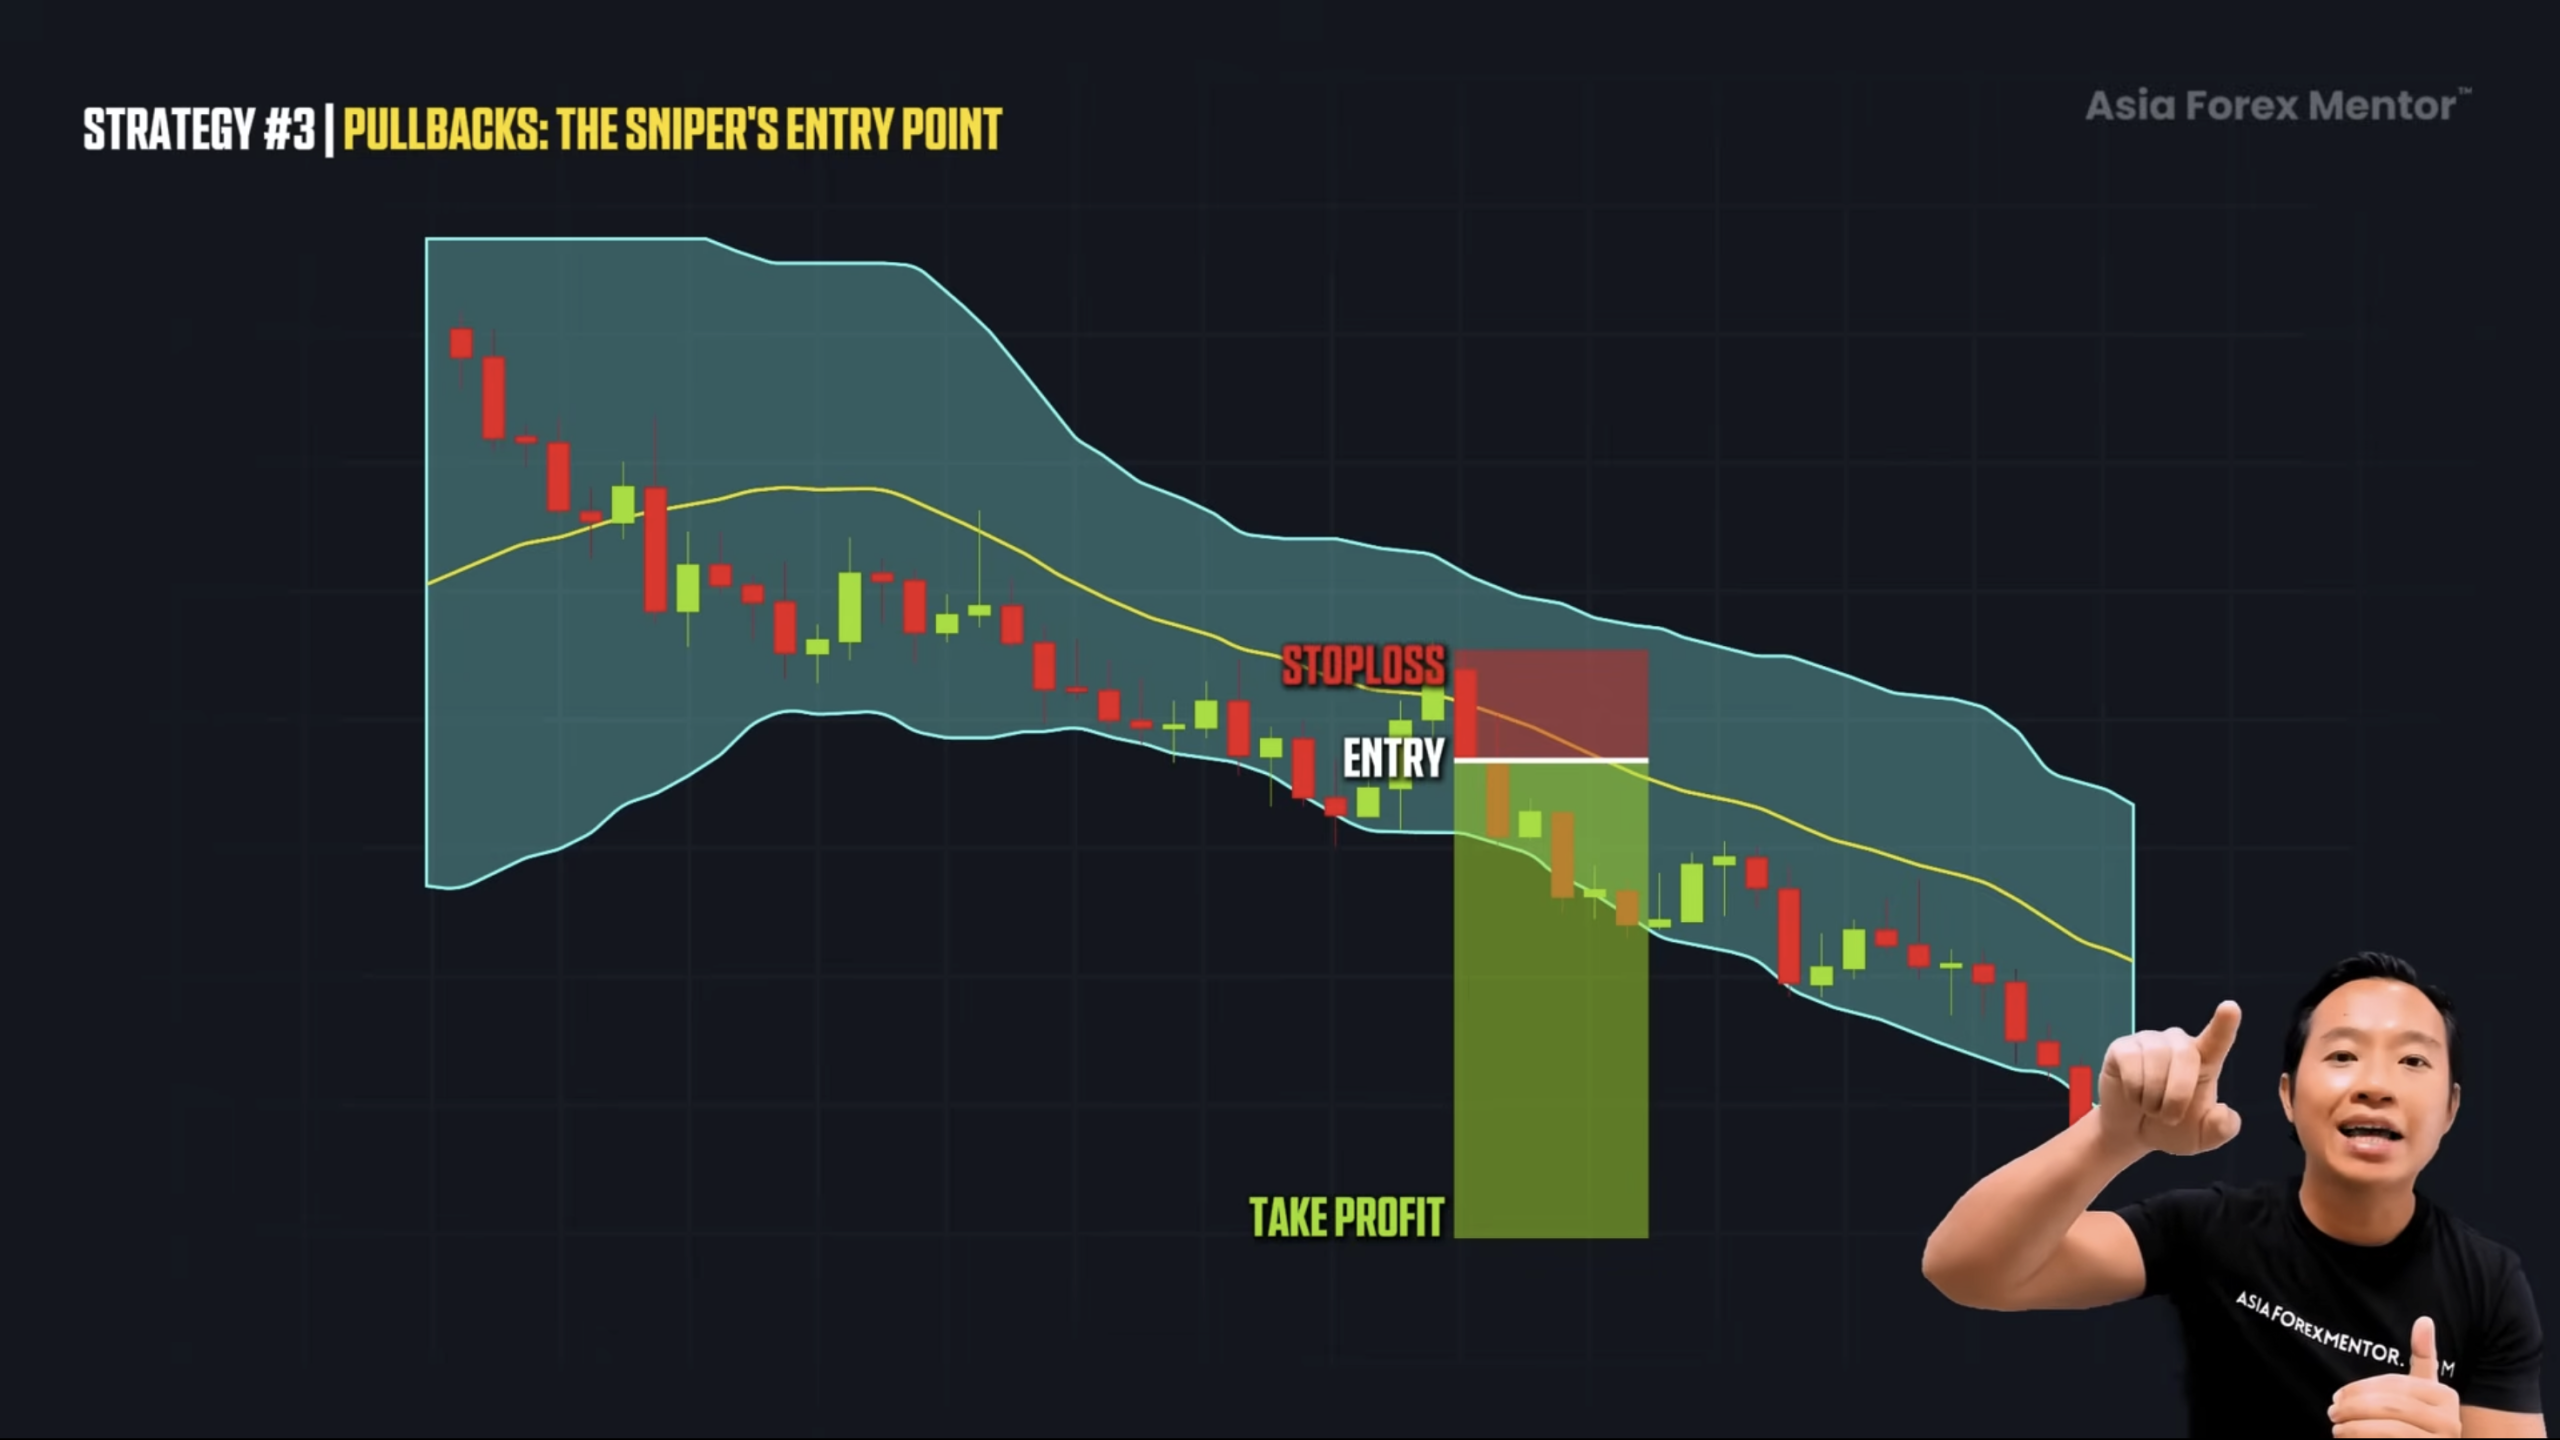
In a downtrend, it’s the same idea flipped.
When price pulls back to the middle band, we wait for confirmation. A bearish engulfing bar. A pin bar. A doji. Then we can add MACD divergence, even hidden divergence.
This pullback trade using the middle Bollinger Band becomes a precise area of value.
Because the market is already moving, you get an excellent risk-to-reward ratio. You’re entering near the pullback instead of chasing the move.
Putting It All Together
Let’s put everything together.
There are three primary ways to use Bollinger Bands, and it reflects how the entire market moves.
When the market starts expanding, we trade breakouts but when the market is consolidating and quiet, we trade reversals.
On the other hand, when the market starts trending, it doesn’t move in a straight line. It pulls back before continuing. That’s where we trade pullbacks.
Bollinger Bands are a powerful tool, and I have them on my chart all the time.
To increase probability, we add candlestick confirmation and momentum indicators like stochastic, MACD, or RSI.
When you combine all of this, what you have is no longer just strategies.
You have a complete trading system.
Here’s what to do next.
I’ve put together a free training that walks you through the exact three-step system I use to find high-probability trades with sniper-level entries, real risk control, and zero guesswork.
This is the same system I use myself. It’s the same system that has helped thousands of traders go from frustration to consistency.
I’m giving it to you for free.
No fluff. No filler. Just pure strategy.
If you want to trade with clarity and real conviction, click the link in the description below and I’ll see you inside the training.
FAQ's
What are Bollinger Bands used for?
Bollinger Bands help show when the market is quiet or active. They highlight potential breakouts, reversals, and pullback areas so trades are not taken randomly.
Do Bollinger Bands work in sideways and trending markets?
Yes. They work in both. In quiet, sideways markets, they help spot reversals. In trending markets, they help identify breakouts and pullback entries.
Can Bollinger Bands be used alone?
They can be used on their own, but they work best when combined with confirmation like candlestick patterns and momentum indicators to avoid guessing.