
Learn To Trade Forex • Best Forex Trading Course • AsiaForexMentor

Reversal Trading Strategy: How Market Reversals Really Happen

Written by

Ezekiel Chew

Updated on

January 9, 2026

i
Its a default text

Reversal Trading Strategy: How Market Reversals Really Happen

Written by:

Last updated on:

January 9, 2026

Hey, what’s up guys, traders. It’s Ezekiel Chew here.

Let me hit you with this.
Most traders think they are catching reversals, but in reality, they are catching traps.

The market does not reverse randomly. It reverses when smart money sweeps liquidity, traps traders, and flips the move while retail gets destroyed.

But here is the truth.
A real reversal actually leaves clues. And if you know how to read them, you can spot the turn before it happens.

In this guide, I’m breaking down the three reversal strategies I use, and inside each one, the exact patterns, triggers, and conditions that make them work.

📺 Watch the full breakdown in this video:

Alright, so first things first.

A reversal simply means a change in the market’s direction. It is the market’s way of showing exhaustion in real time. Price moves in one trend, then shifts to the opposite side.
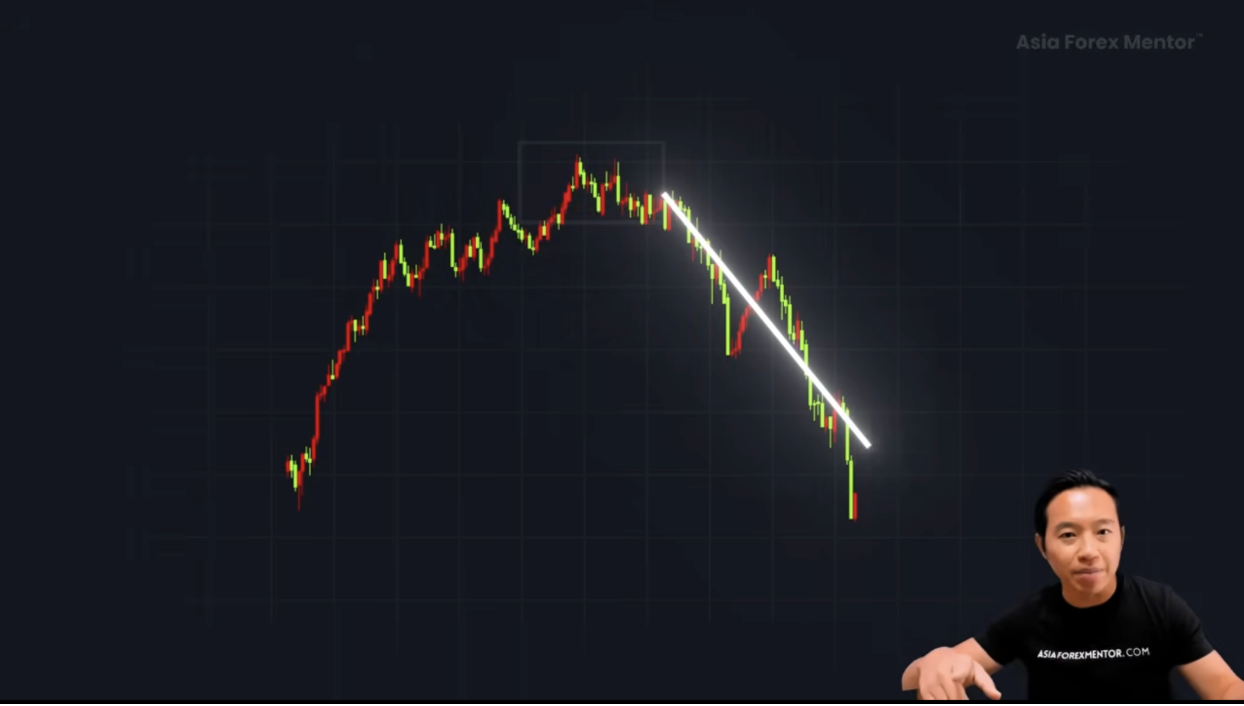
That shift is what traders call a reversal. It can happen in an uptrend turning down, or a downtrend turning up.

Simple as that.

But here is where many traders get it wrong.They assume that just because the price has gone too high or too low, it is bound to turn around. That is not how the market works. A market can keep going higher even when everyone thinks it is overbought.

And it can keep falling even when it already looks cheap.

So instead of guessing where it might flip, we focus on what actually signals a turn. The structure, the behavior, and the energy within the move.

Once you understand that, reversals stop feeling random. That is where the real work begins, identifying where the shift starts to form.

Strategy 1: Identifying Liquidity-Based Reversals

Why does price break through a level, look like it is running, and then instantly flip the other way?

That is not a random move. That is structure telling us something important.

A reversal starts when price breaks a clear level, support or resistance, but fails to continue. That failure creates what we call a liquidity grab.
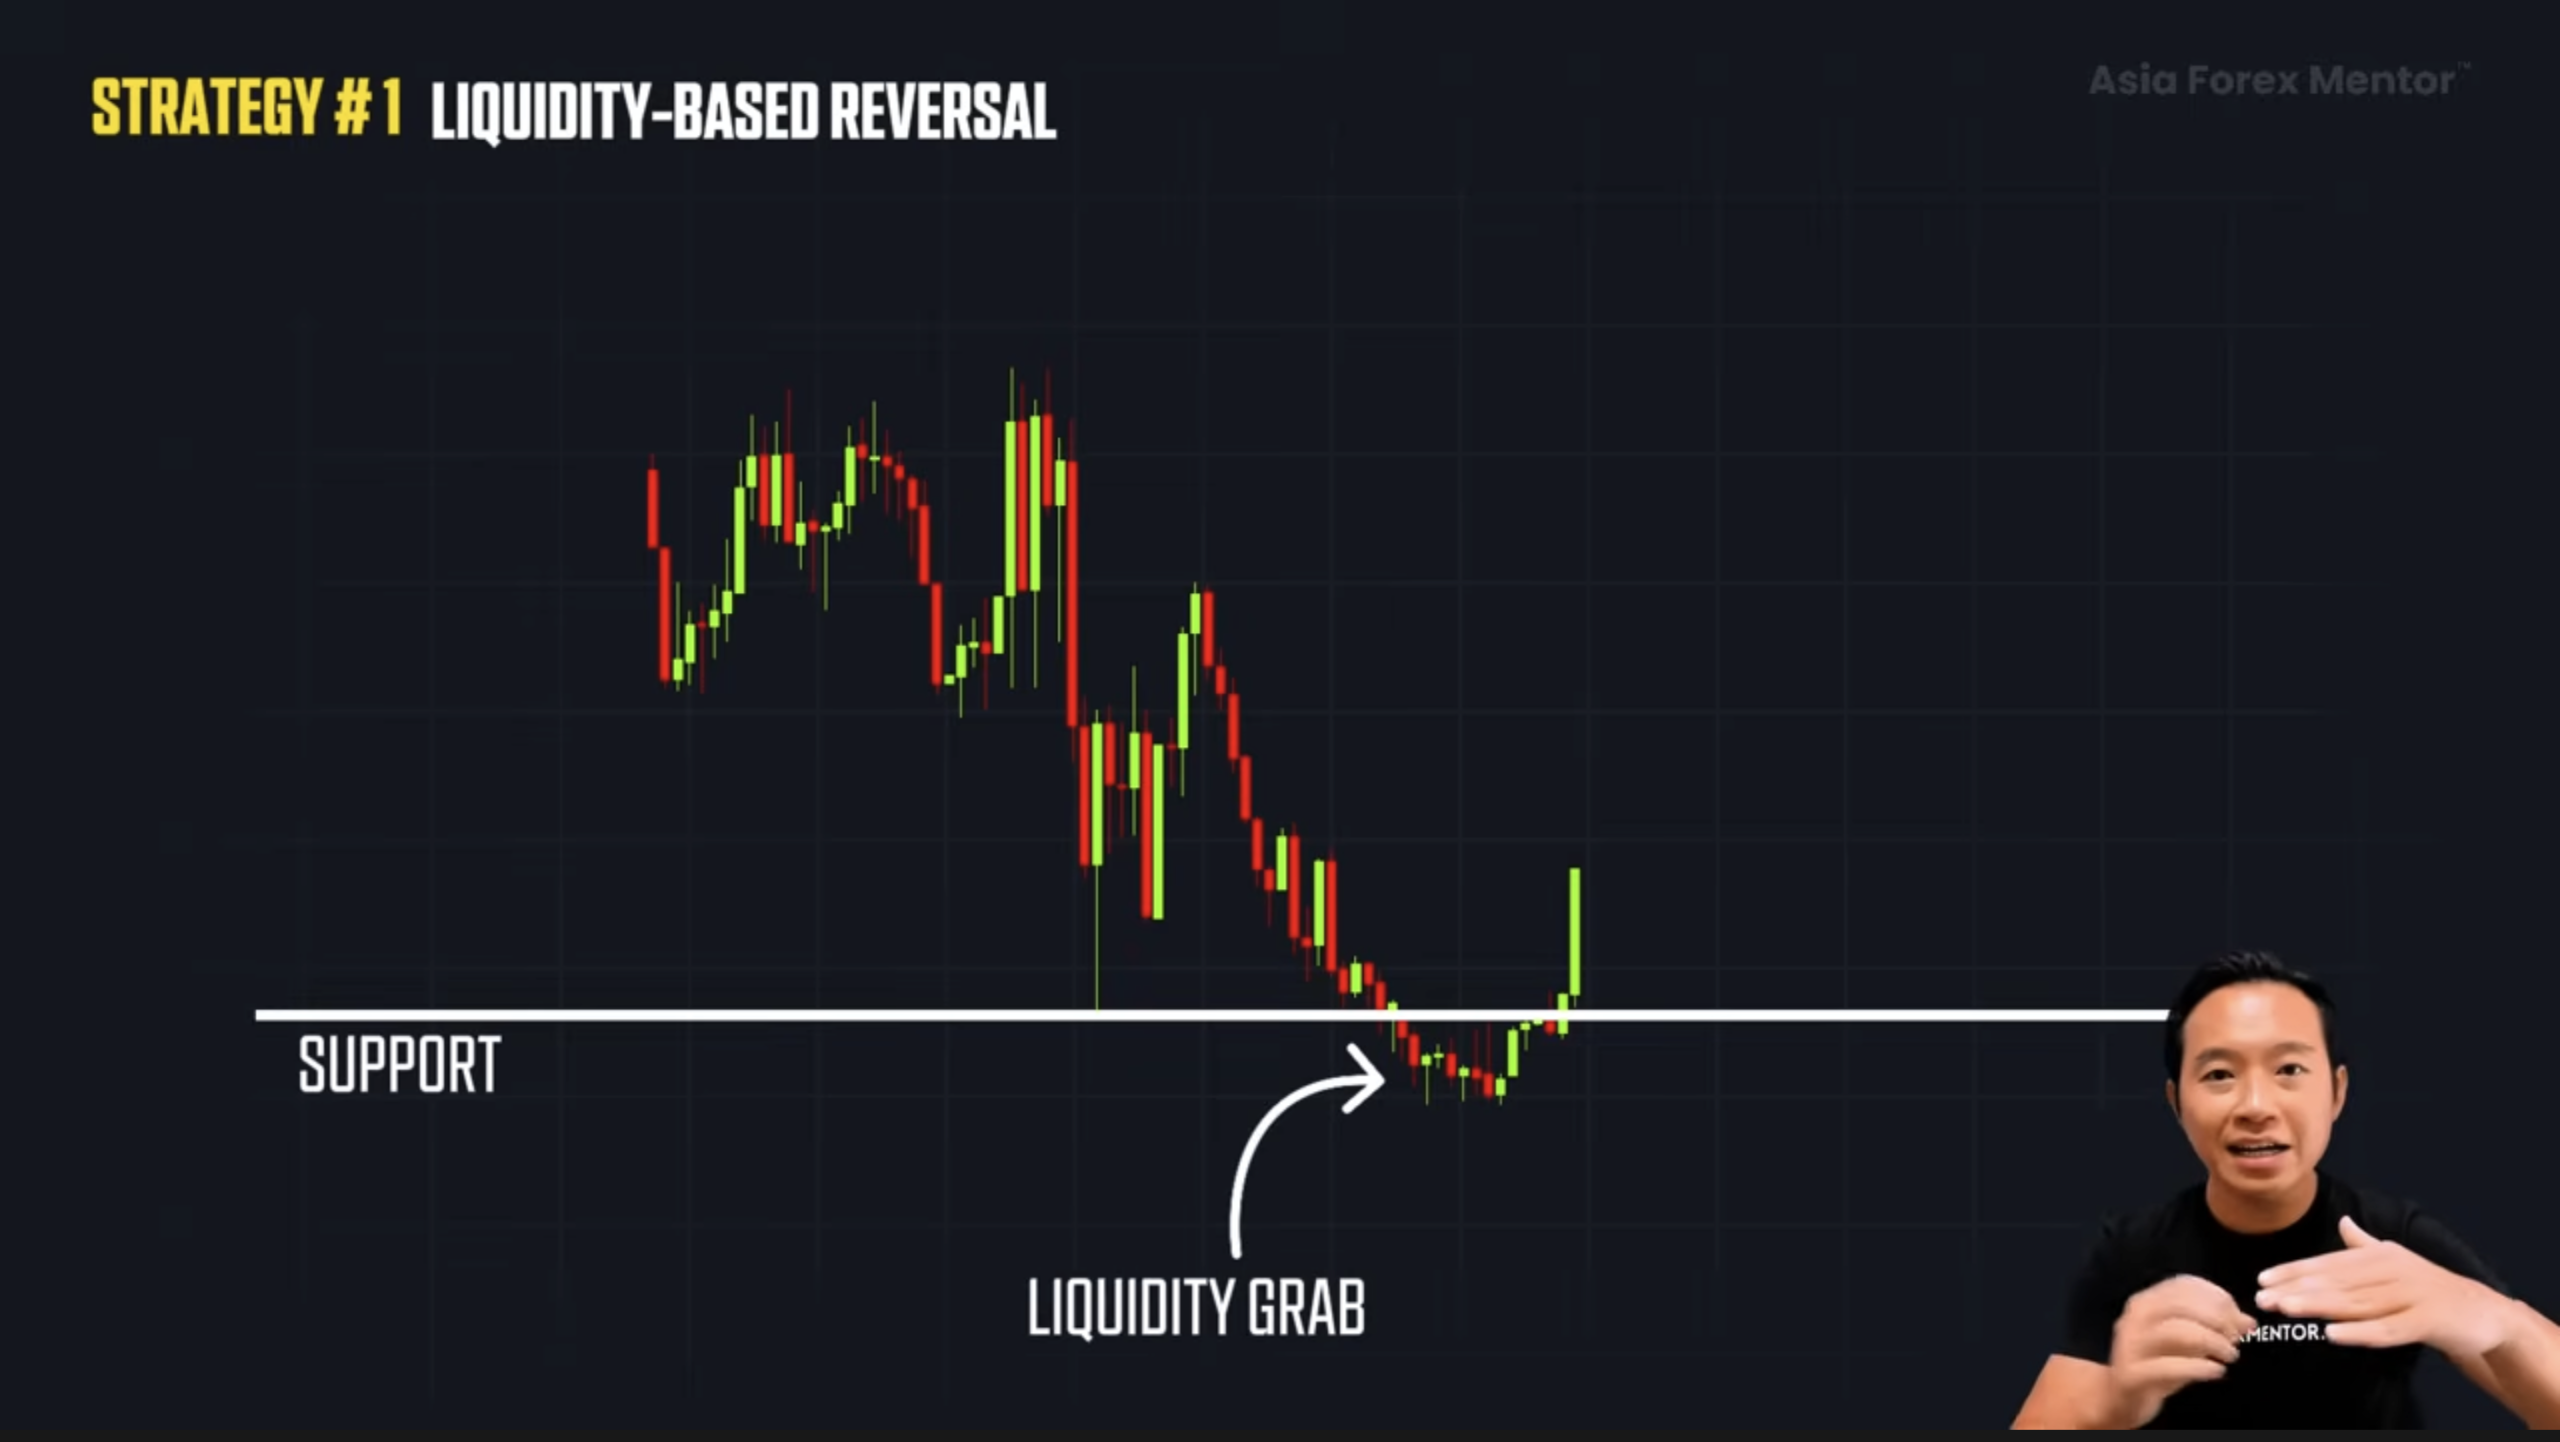
Technically, it is a stop sweep. Price goes beyond a key level just enough to trigger pending orders and stop losses, then reverses sharply in the opposite direction. What looks like a breakout is actually the market collecting liquidity before shifting bias.
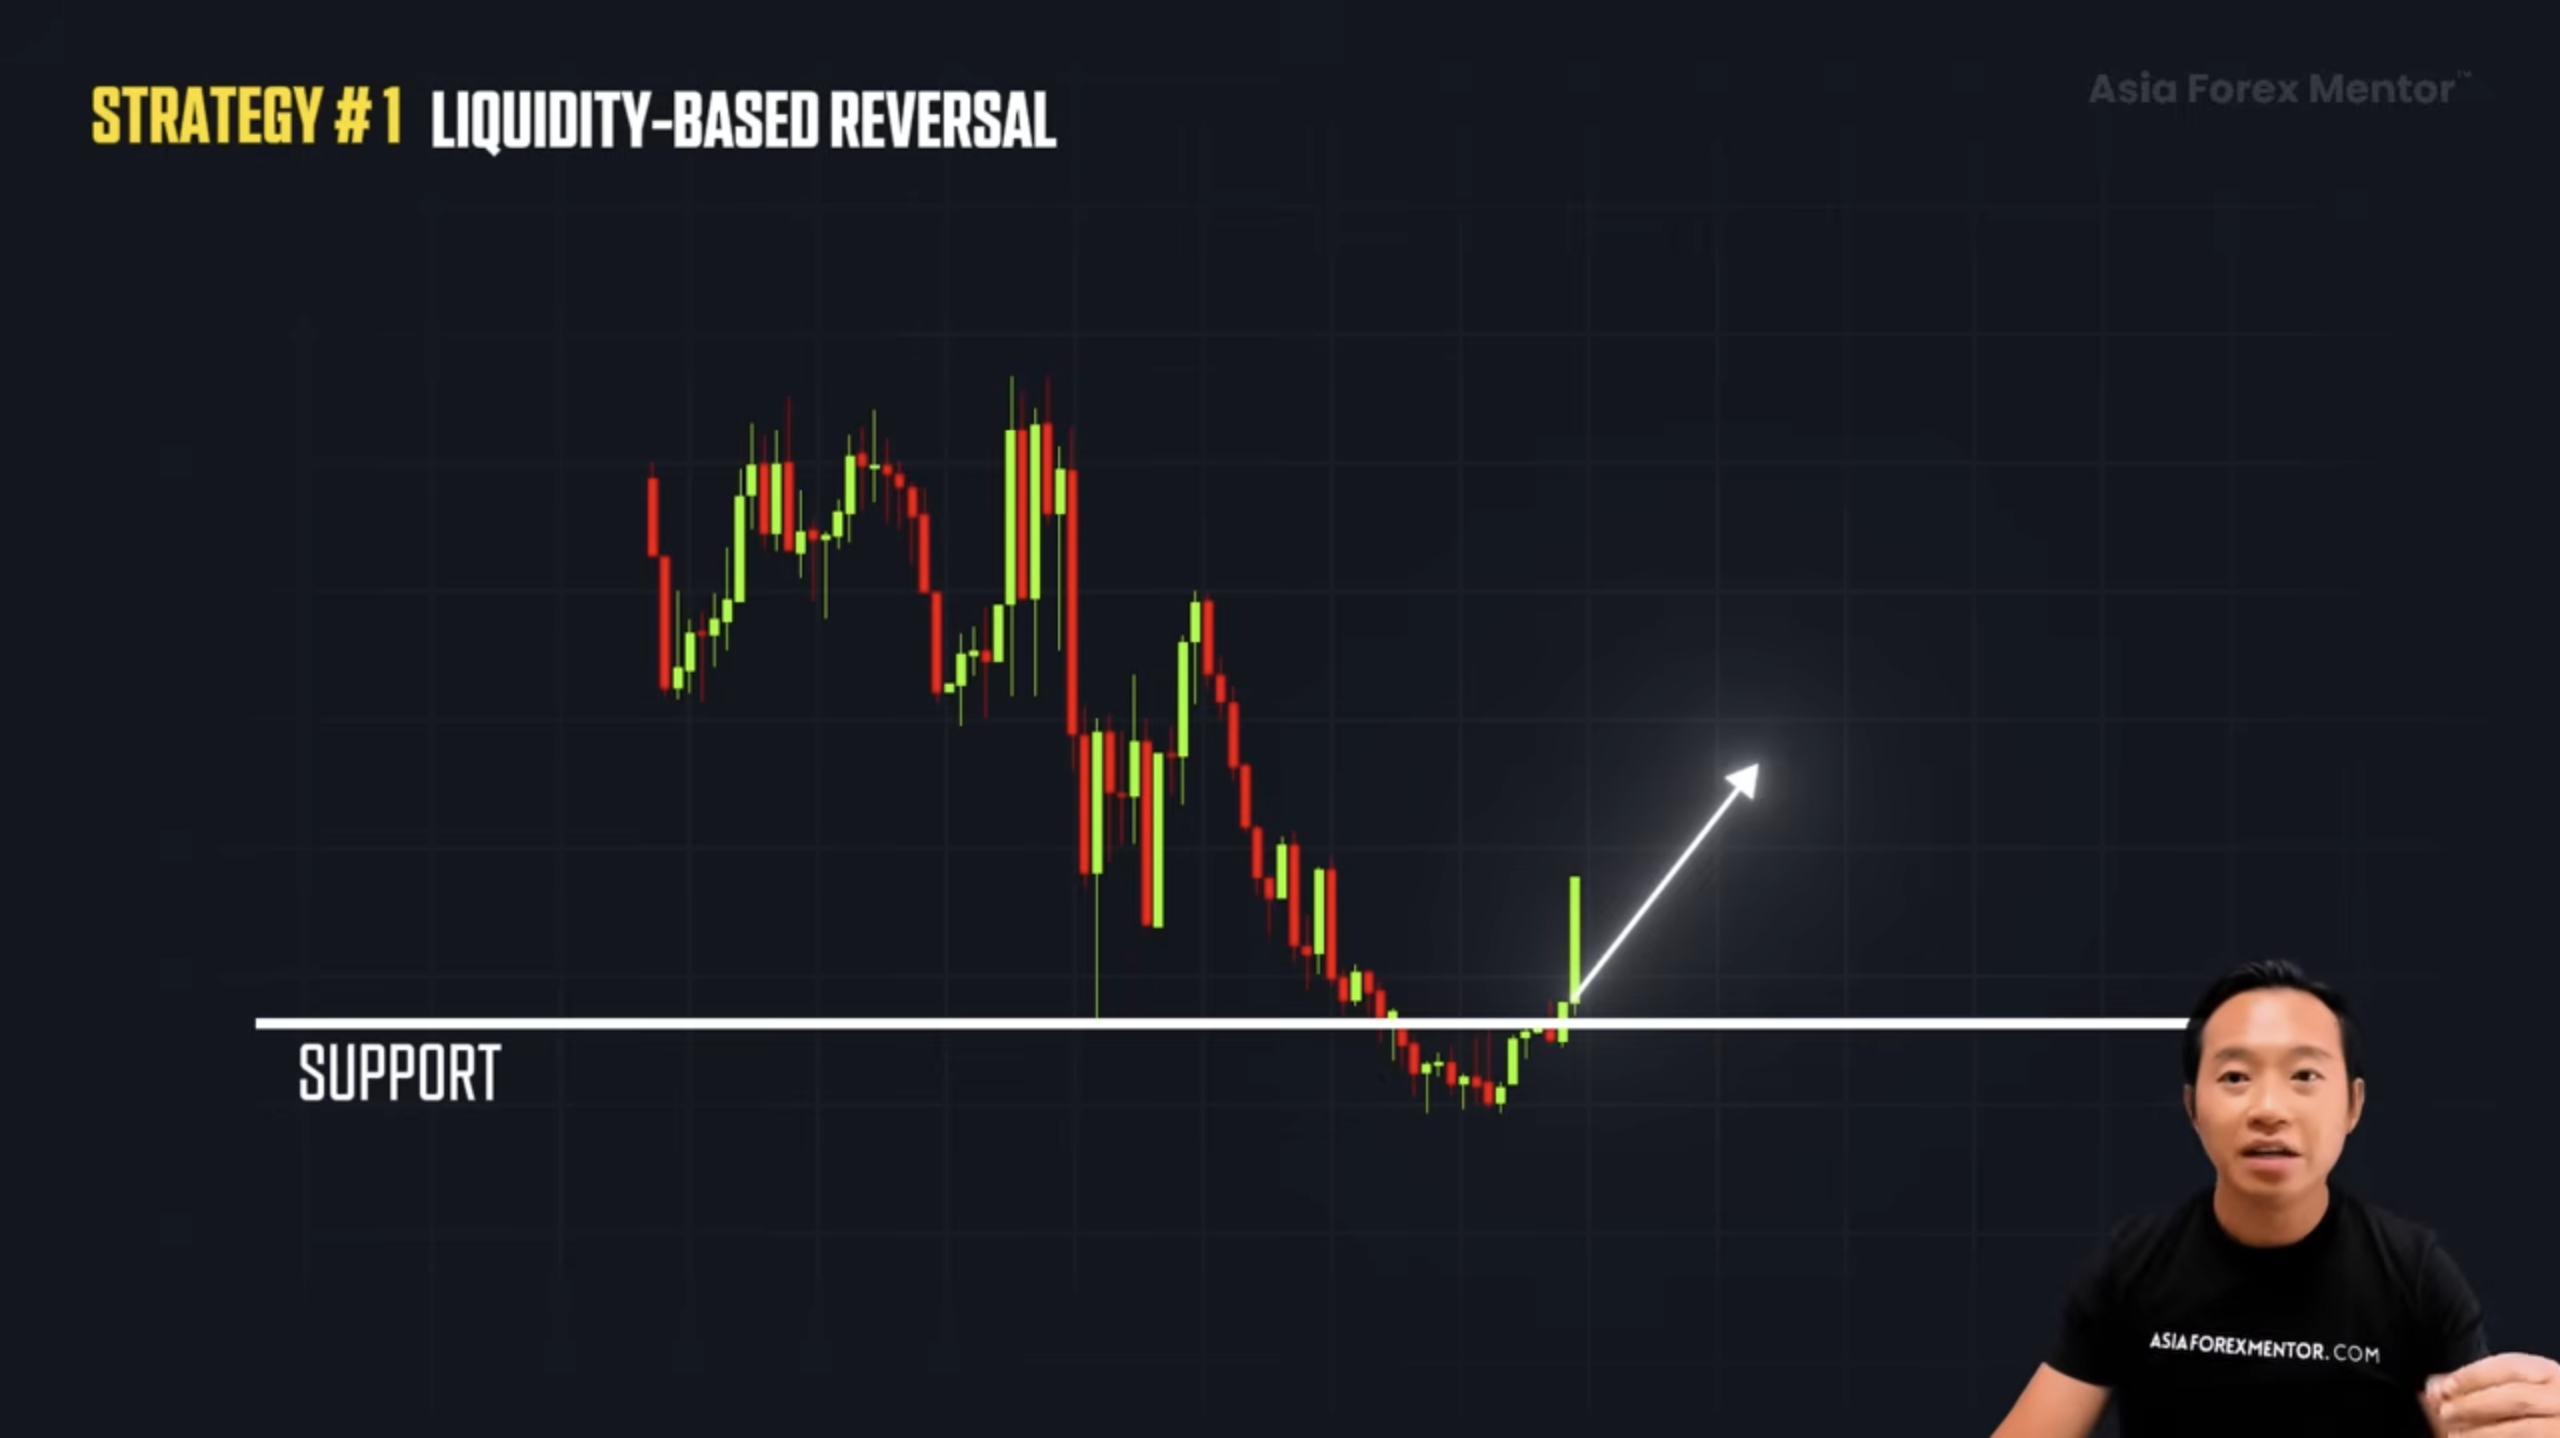
Here is the structure behind it.

At resistance, breakout traders go long above the high, while sellers place their stops just above that level. When price spikes through, both orders trigger, creating buy-side liquidity.
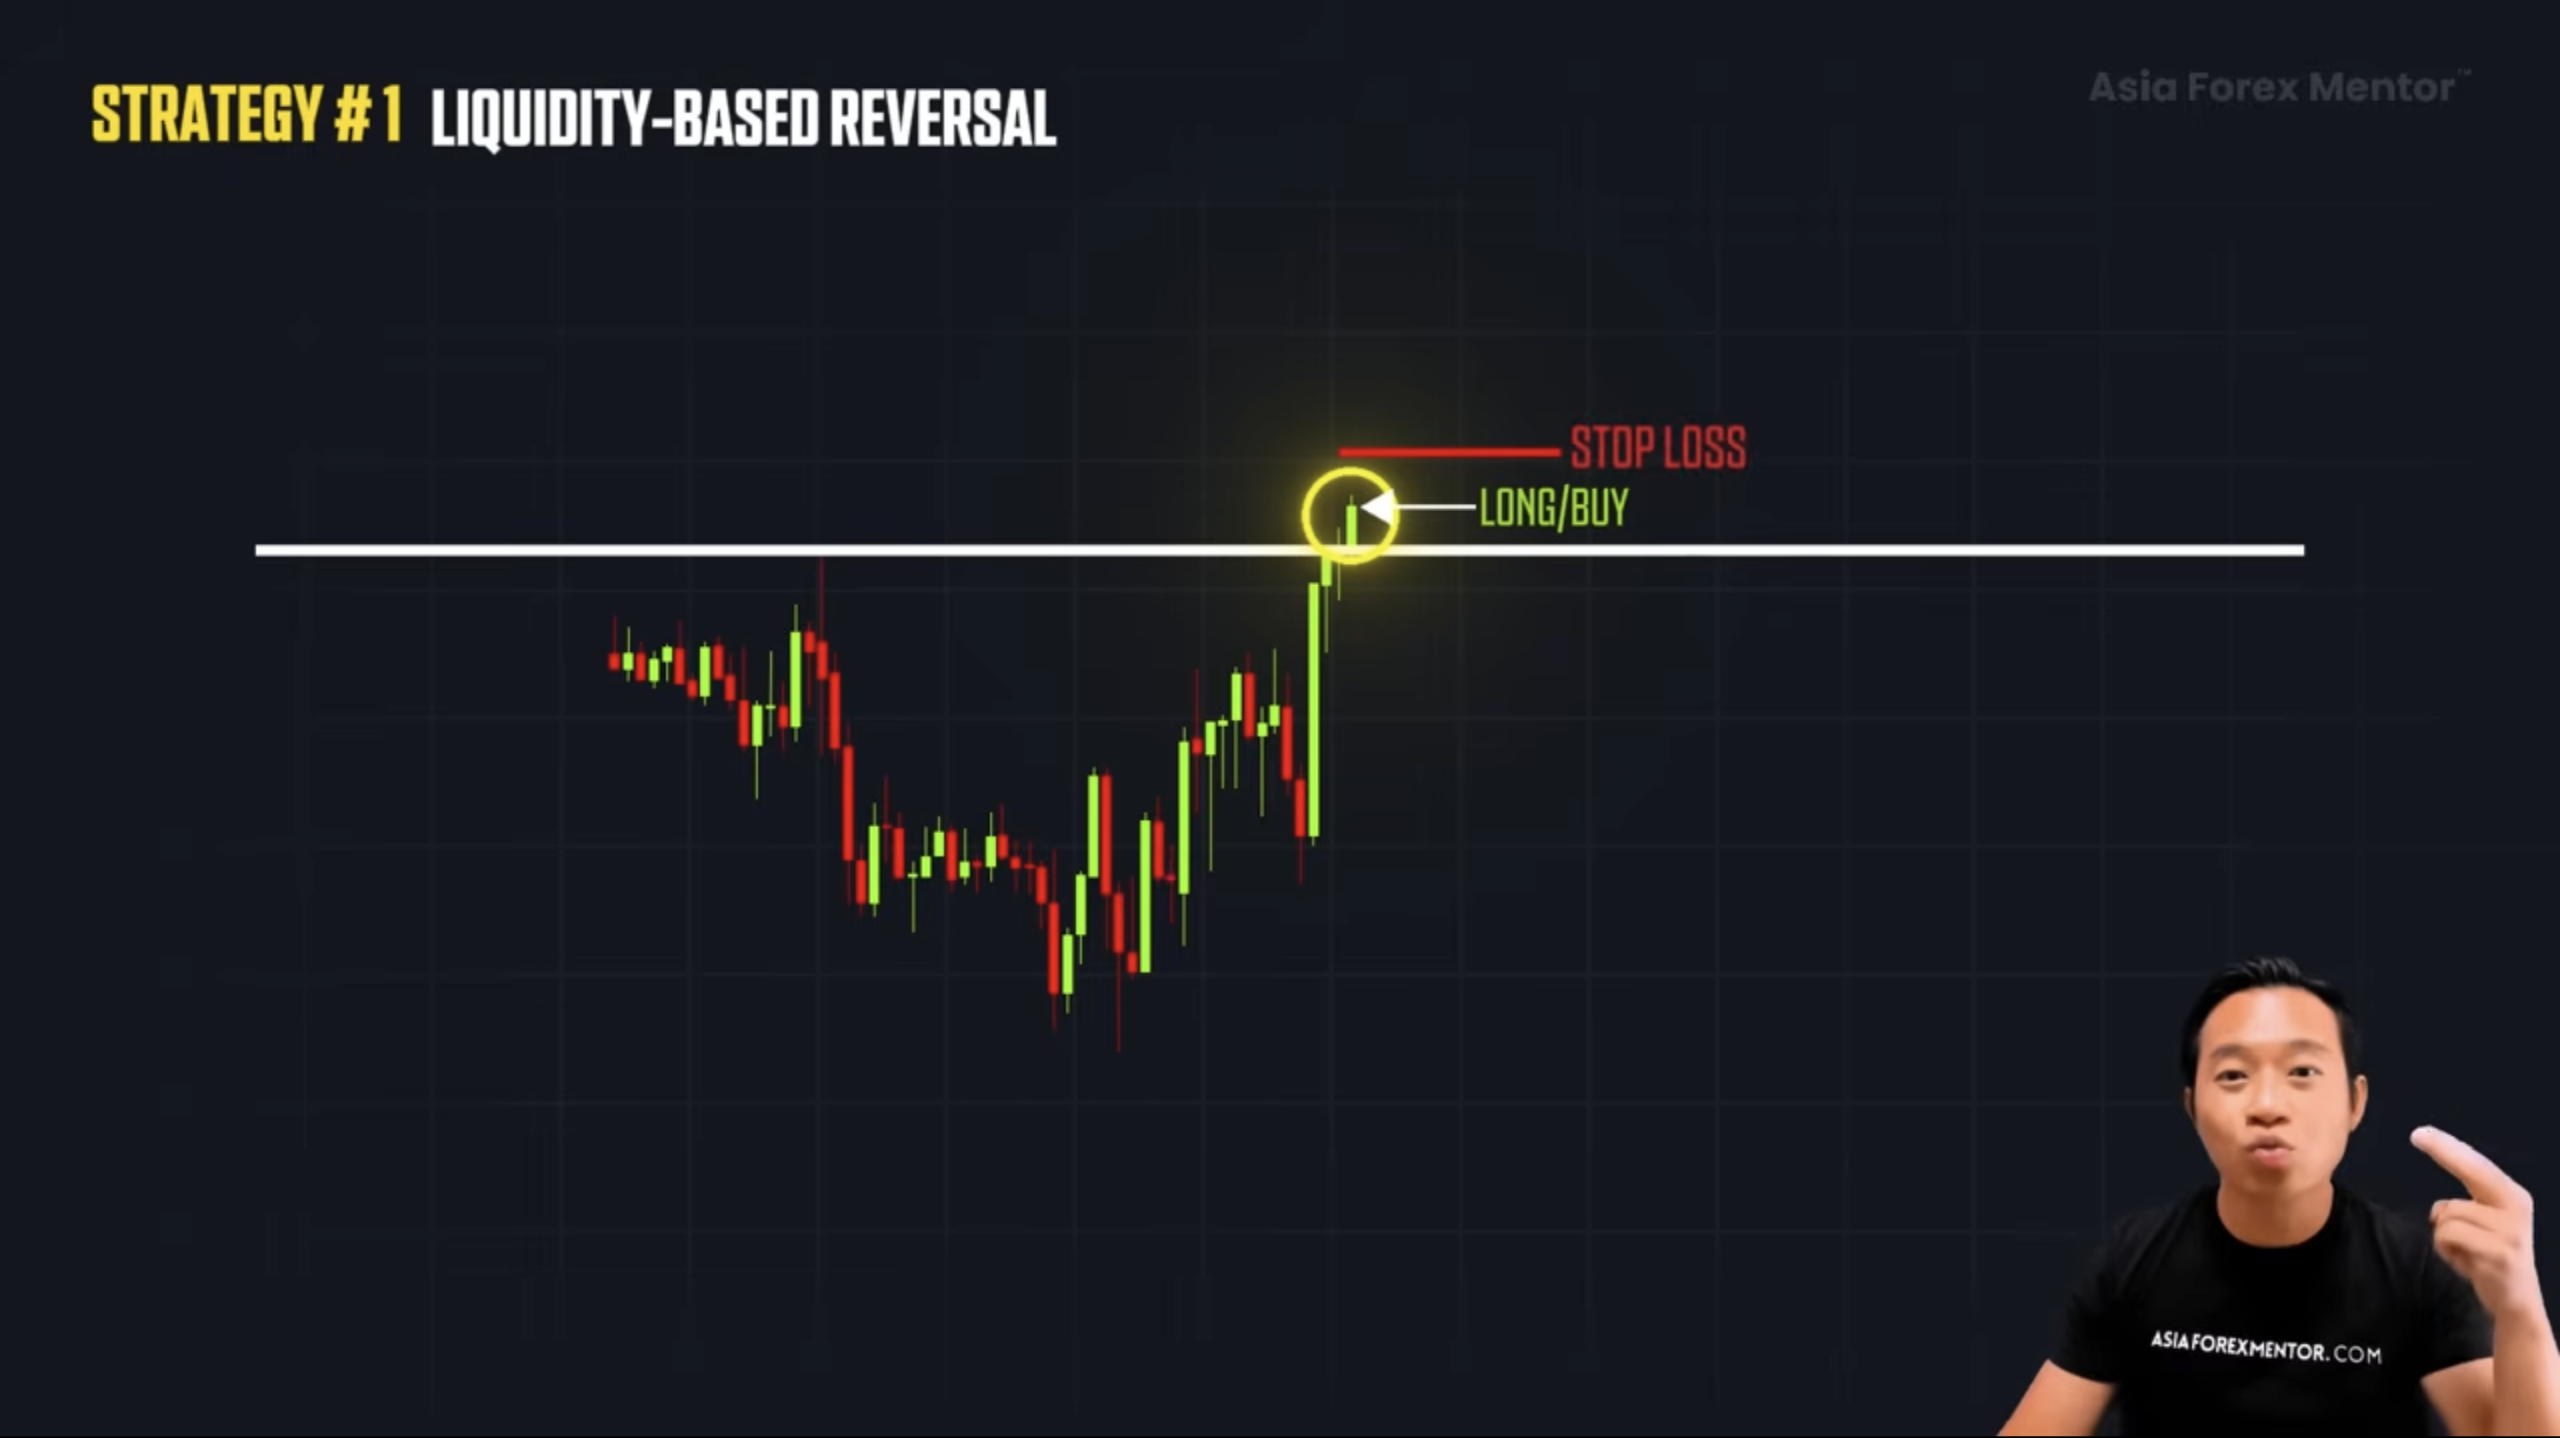
Once that fuel is used up, there is no more order flow to push higher. Price snaps back down. That reversal often becomes the start of a new short-term trend.

This principle holds across all timeframes and instruments. Forex, stocks, commodities, crypto, it does not matter.

A liquidity grab shows the same footprint.Then a sharp wick through a level, an immediate rejection, and an impulsive move in the opposite direction.

Mark the candle that created the sweep. The one that broke the level and immediately rejected.
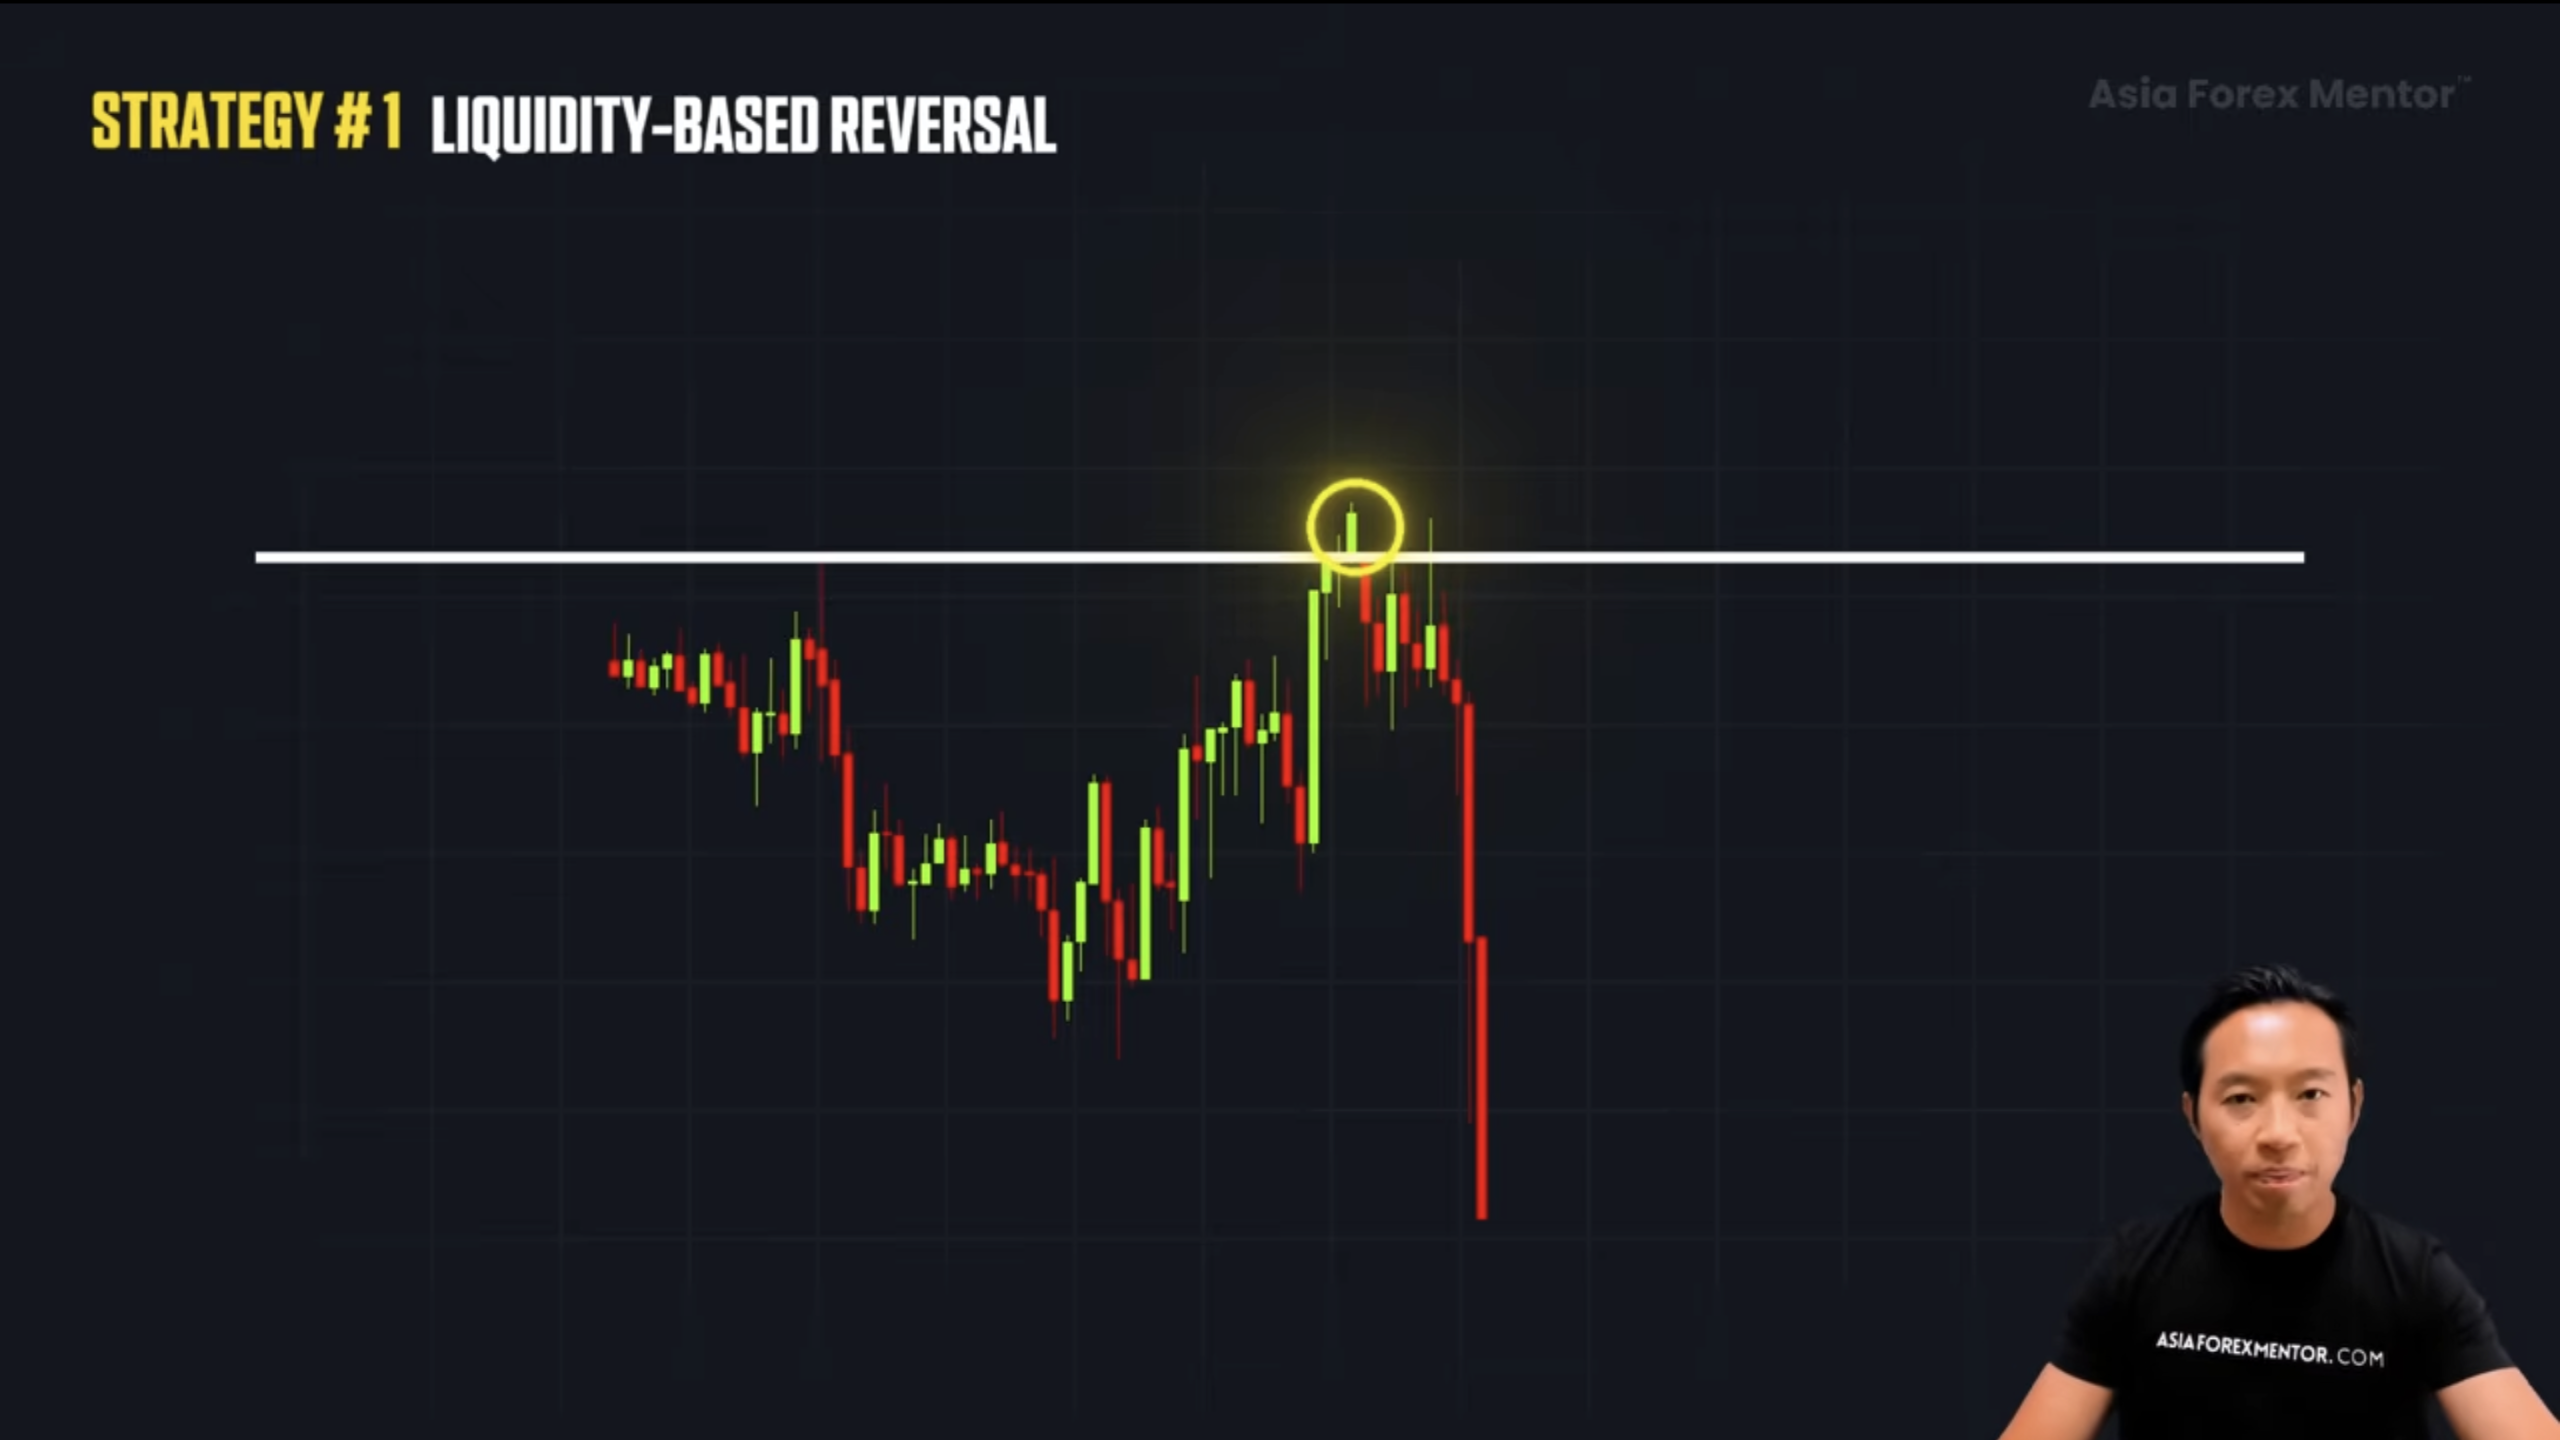
For a bearish reversal, that is the candle piercing above resistance before closing back below.

For a bullish reversal, it is the opposite.
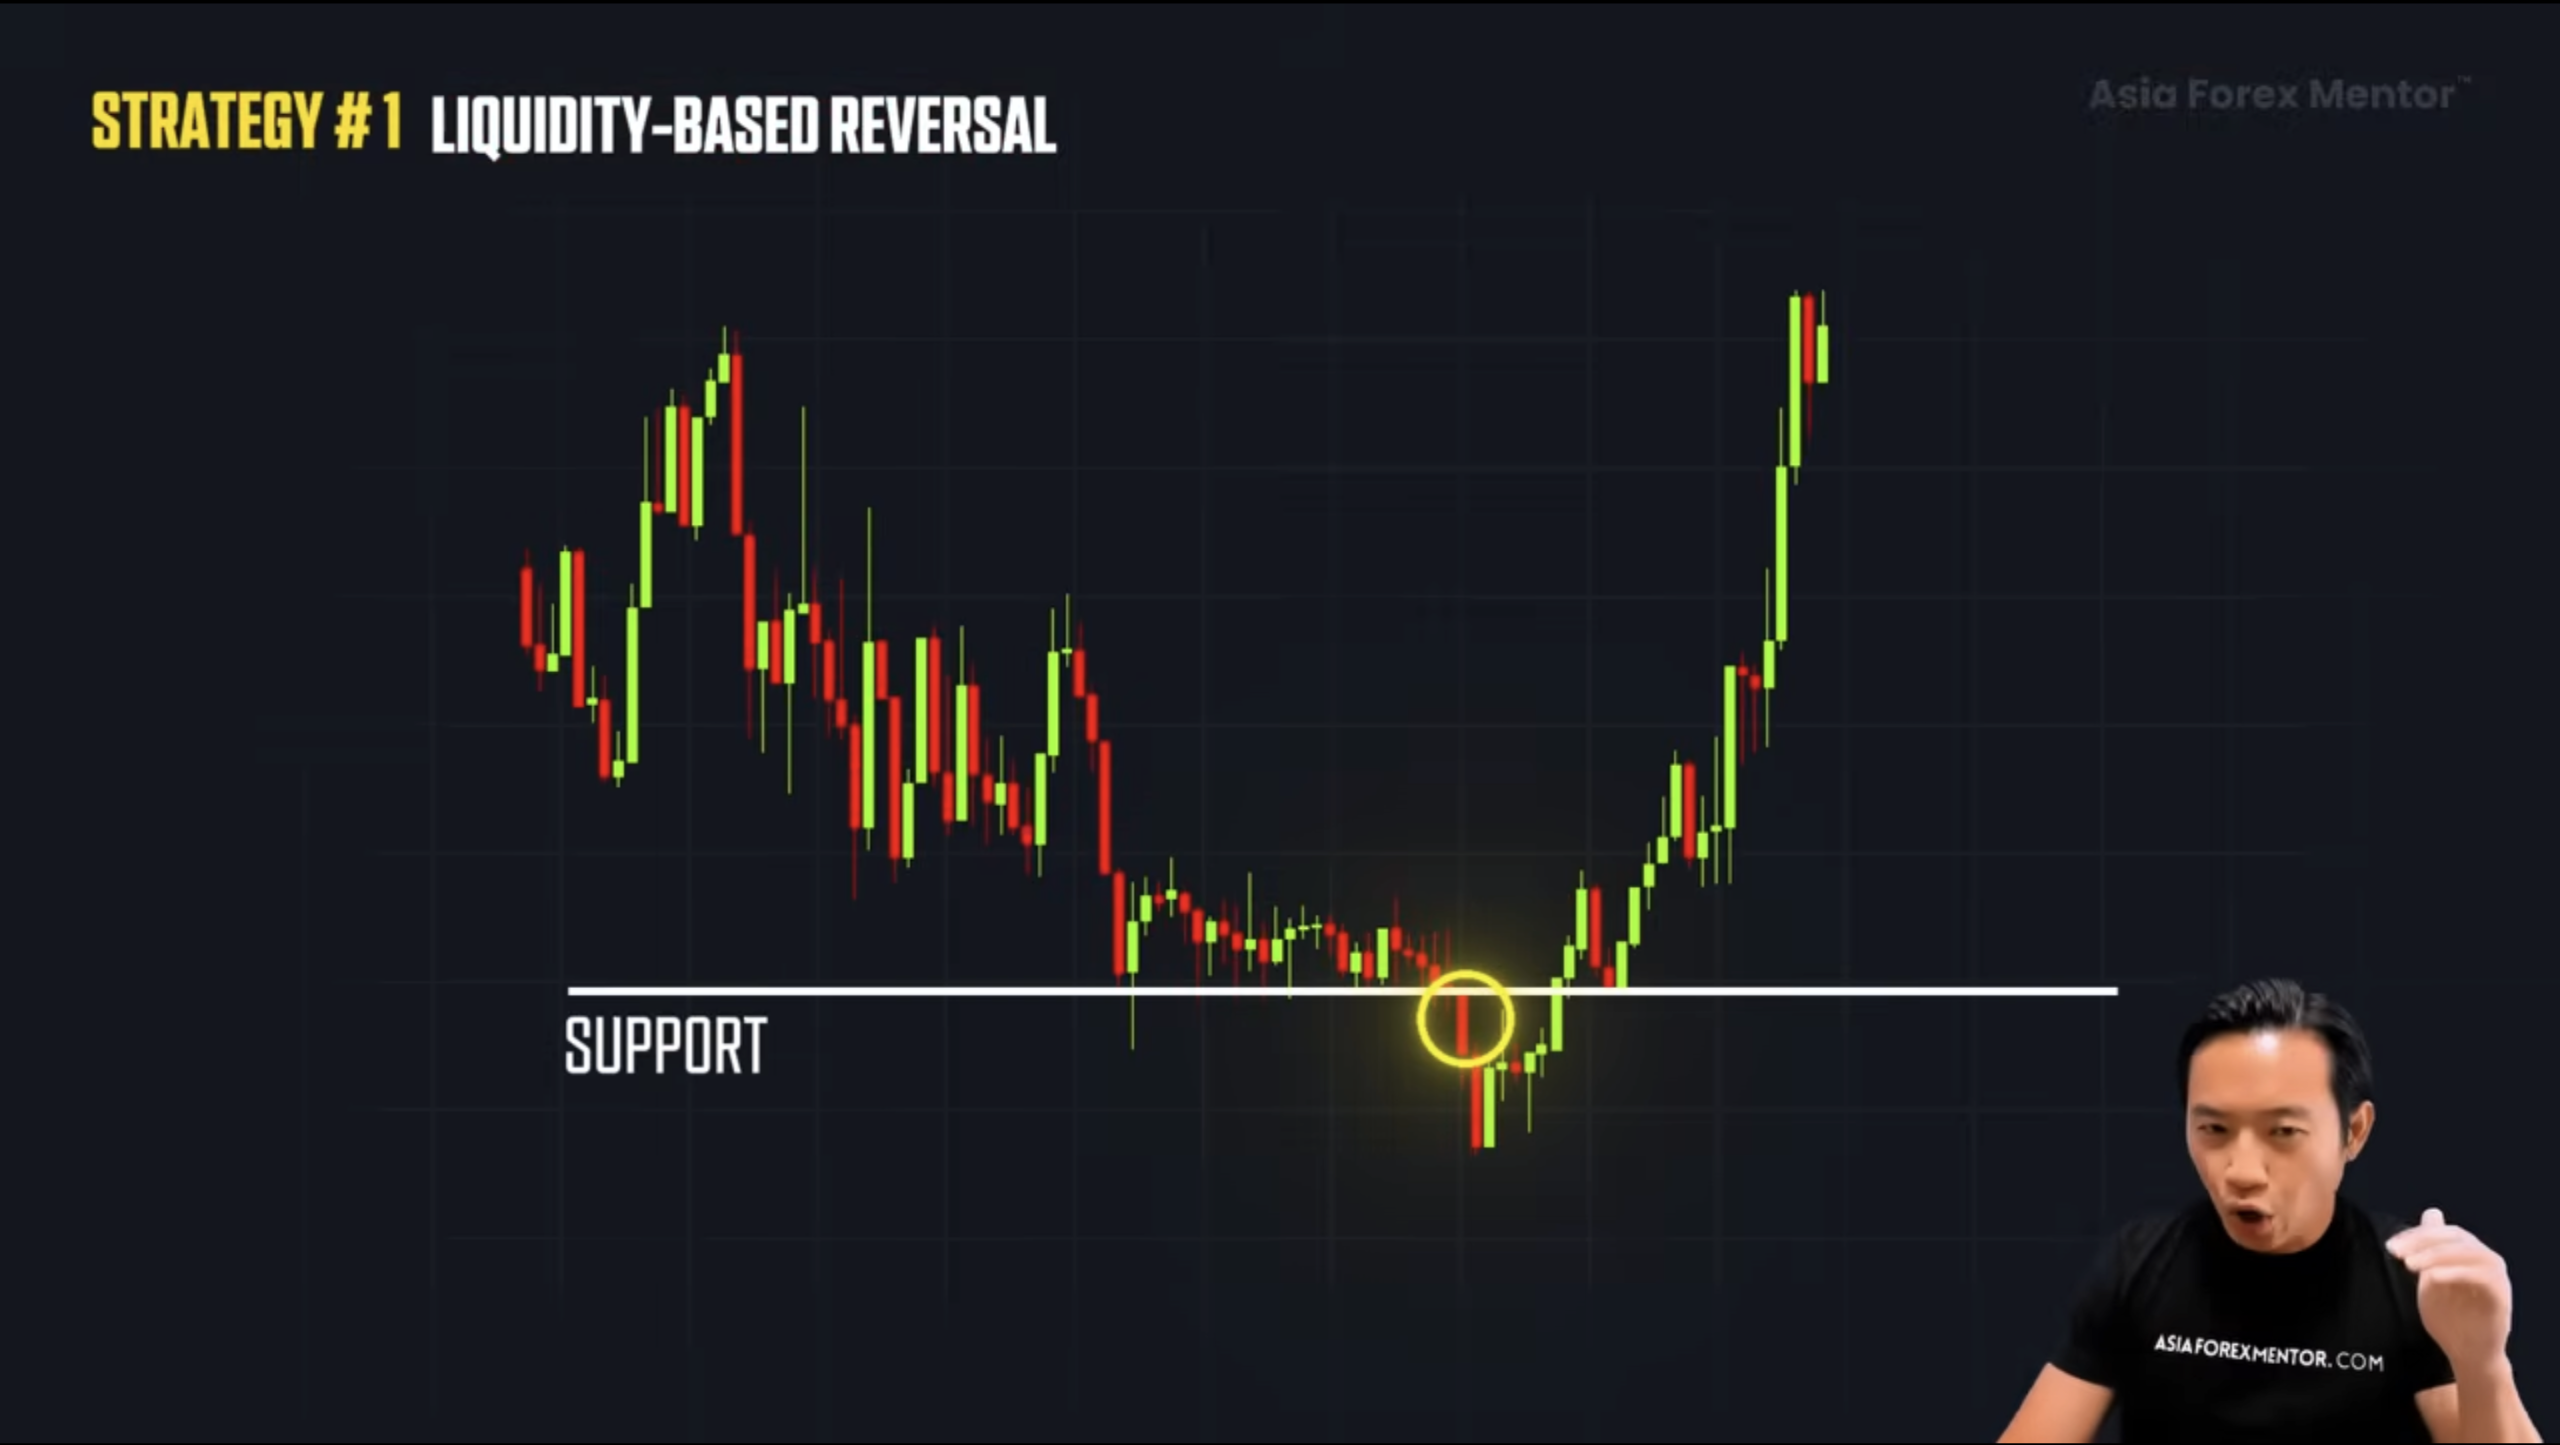
Your entry point is taken from that candle. Stops go just beyond the wick that performed the grab. Because your entry is near the turning point, your risk stays tight while your reward expands. That is why liquidity-grab setups often deliver high risk-to-reward trades.
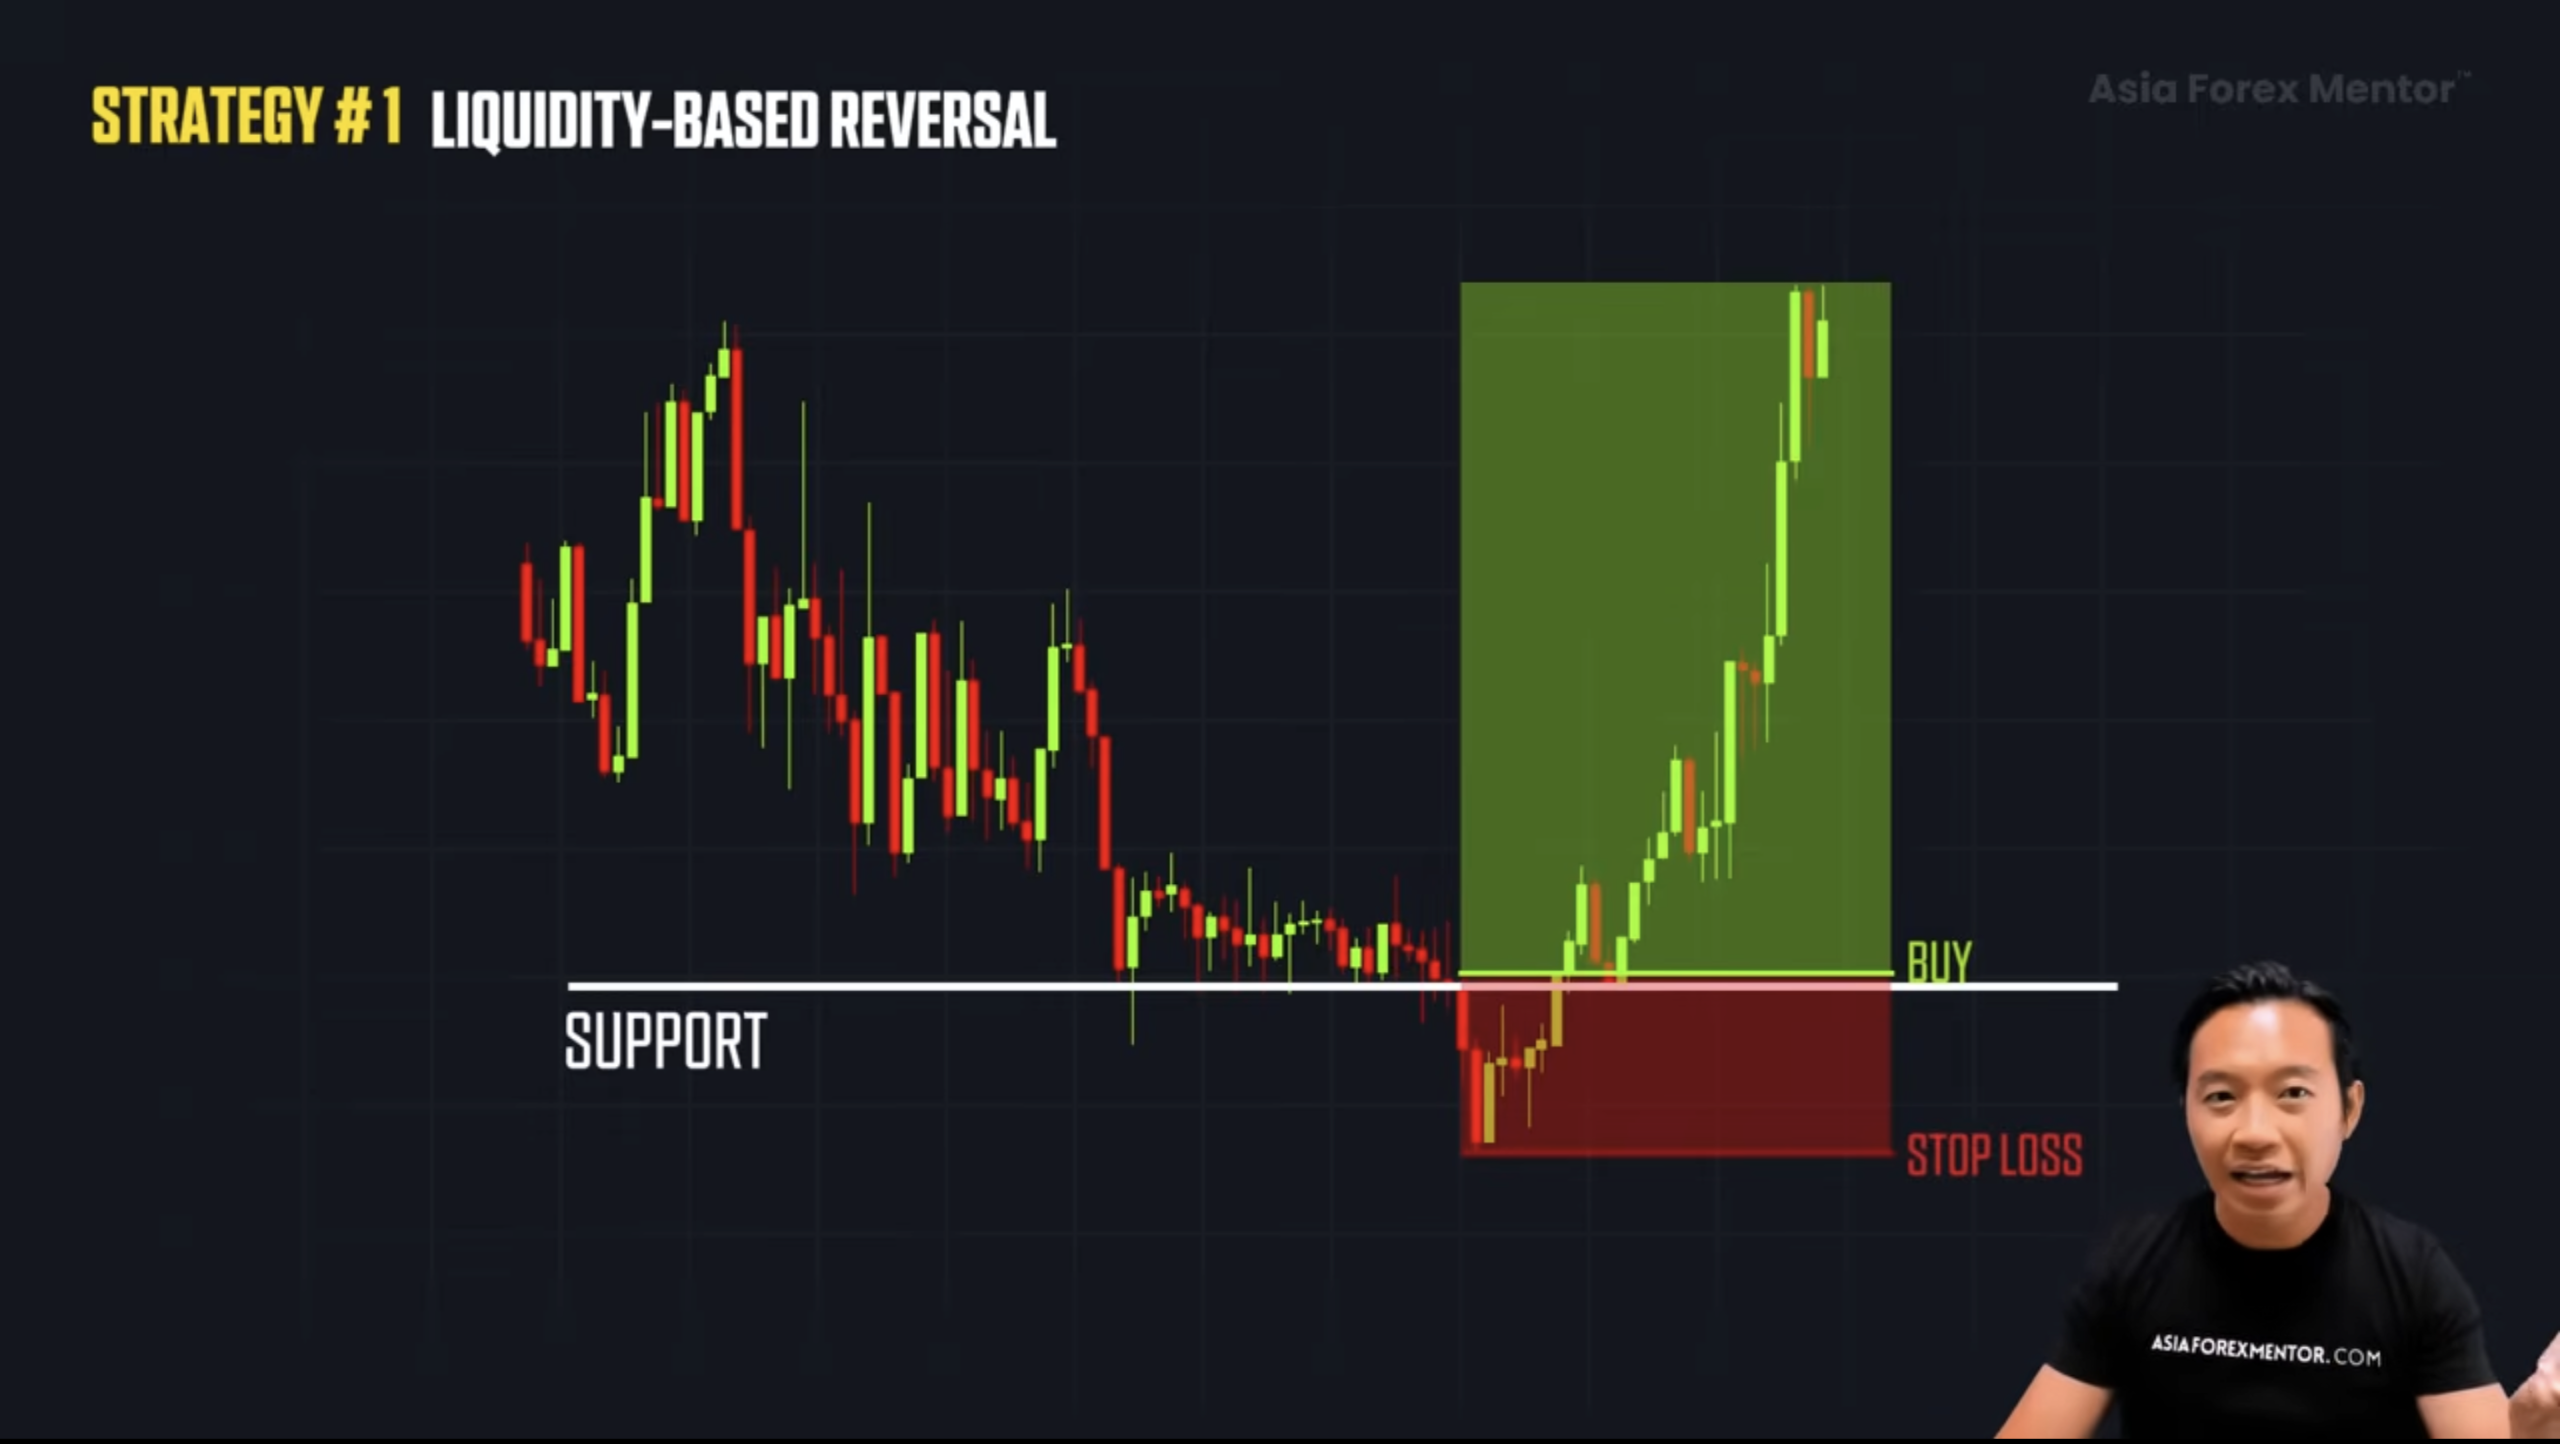
You are not chasing but rather positioning at the origin of the move.

When backtested, this structure consistently outperformed traditional breakout entries.
Moves after liquidity sweeps were cleaner, more impulsive, and easier to manage.

Even when it fails, losses are minimal because the invalidation point is clear.
That is what makes this a professional-grade setup.

Defined levels. Measurable risk. Structural precision.

Getting stopped out by fake breakouts kills most traders. This is the solution.

Strategy 2: Recognizing Chart-Based Reversal Patterns

Patterns do not predict the market. They reveal what is already happening underneath the surface.

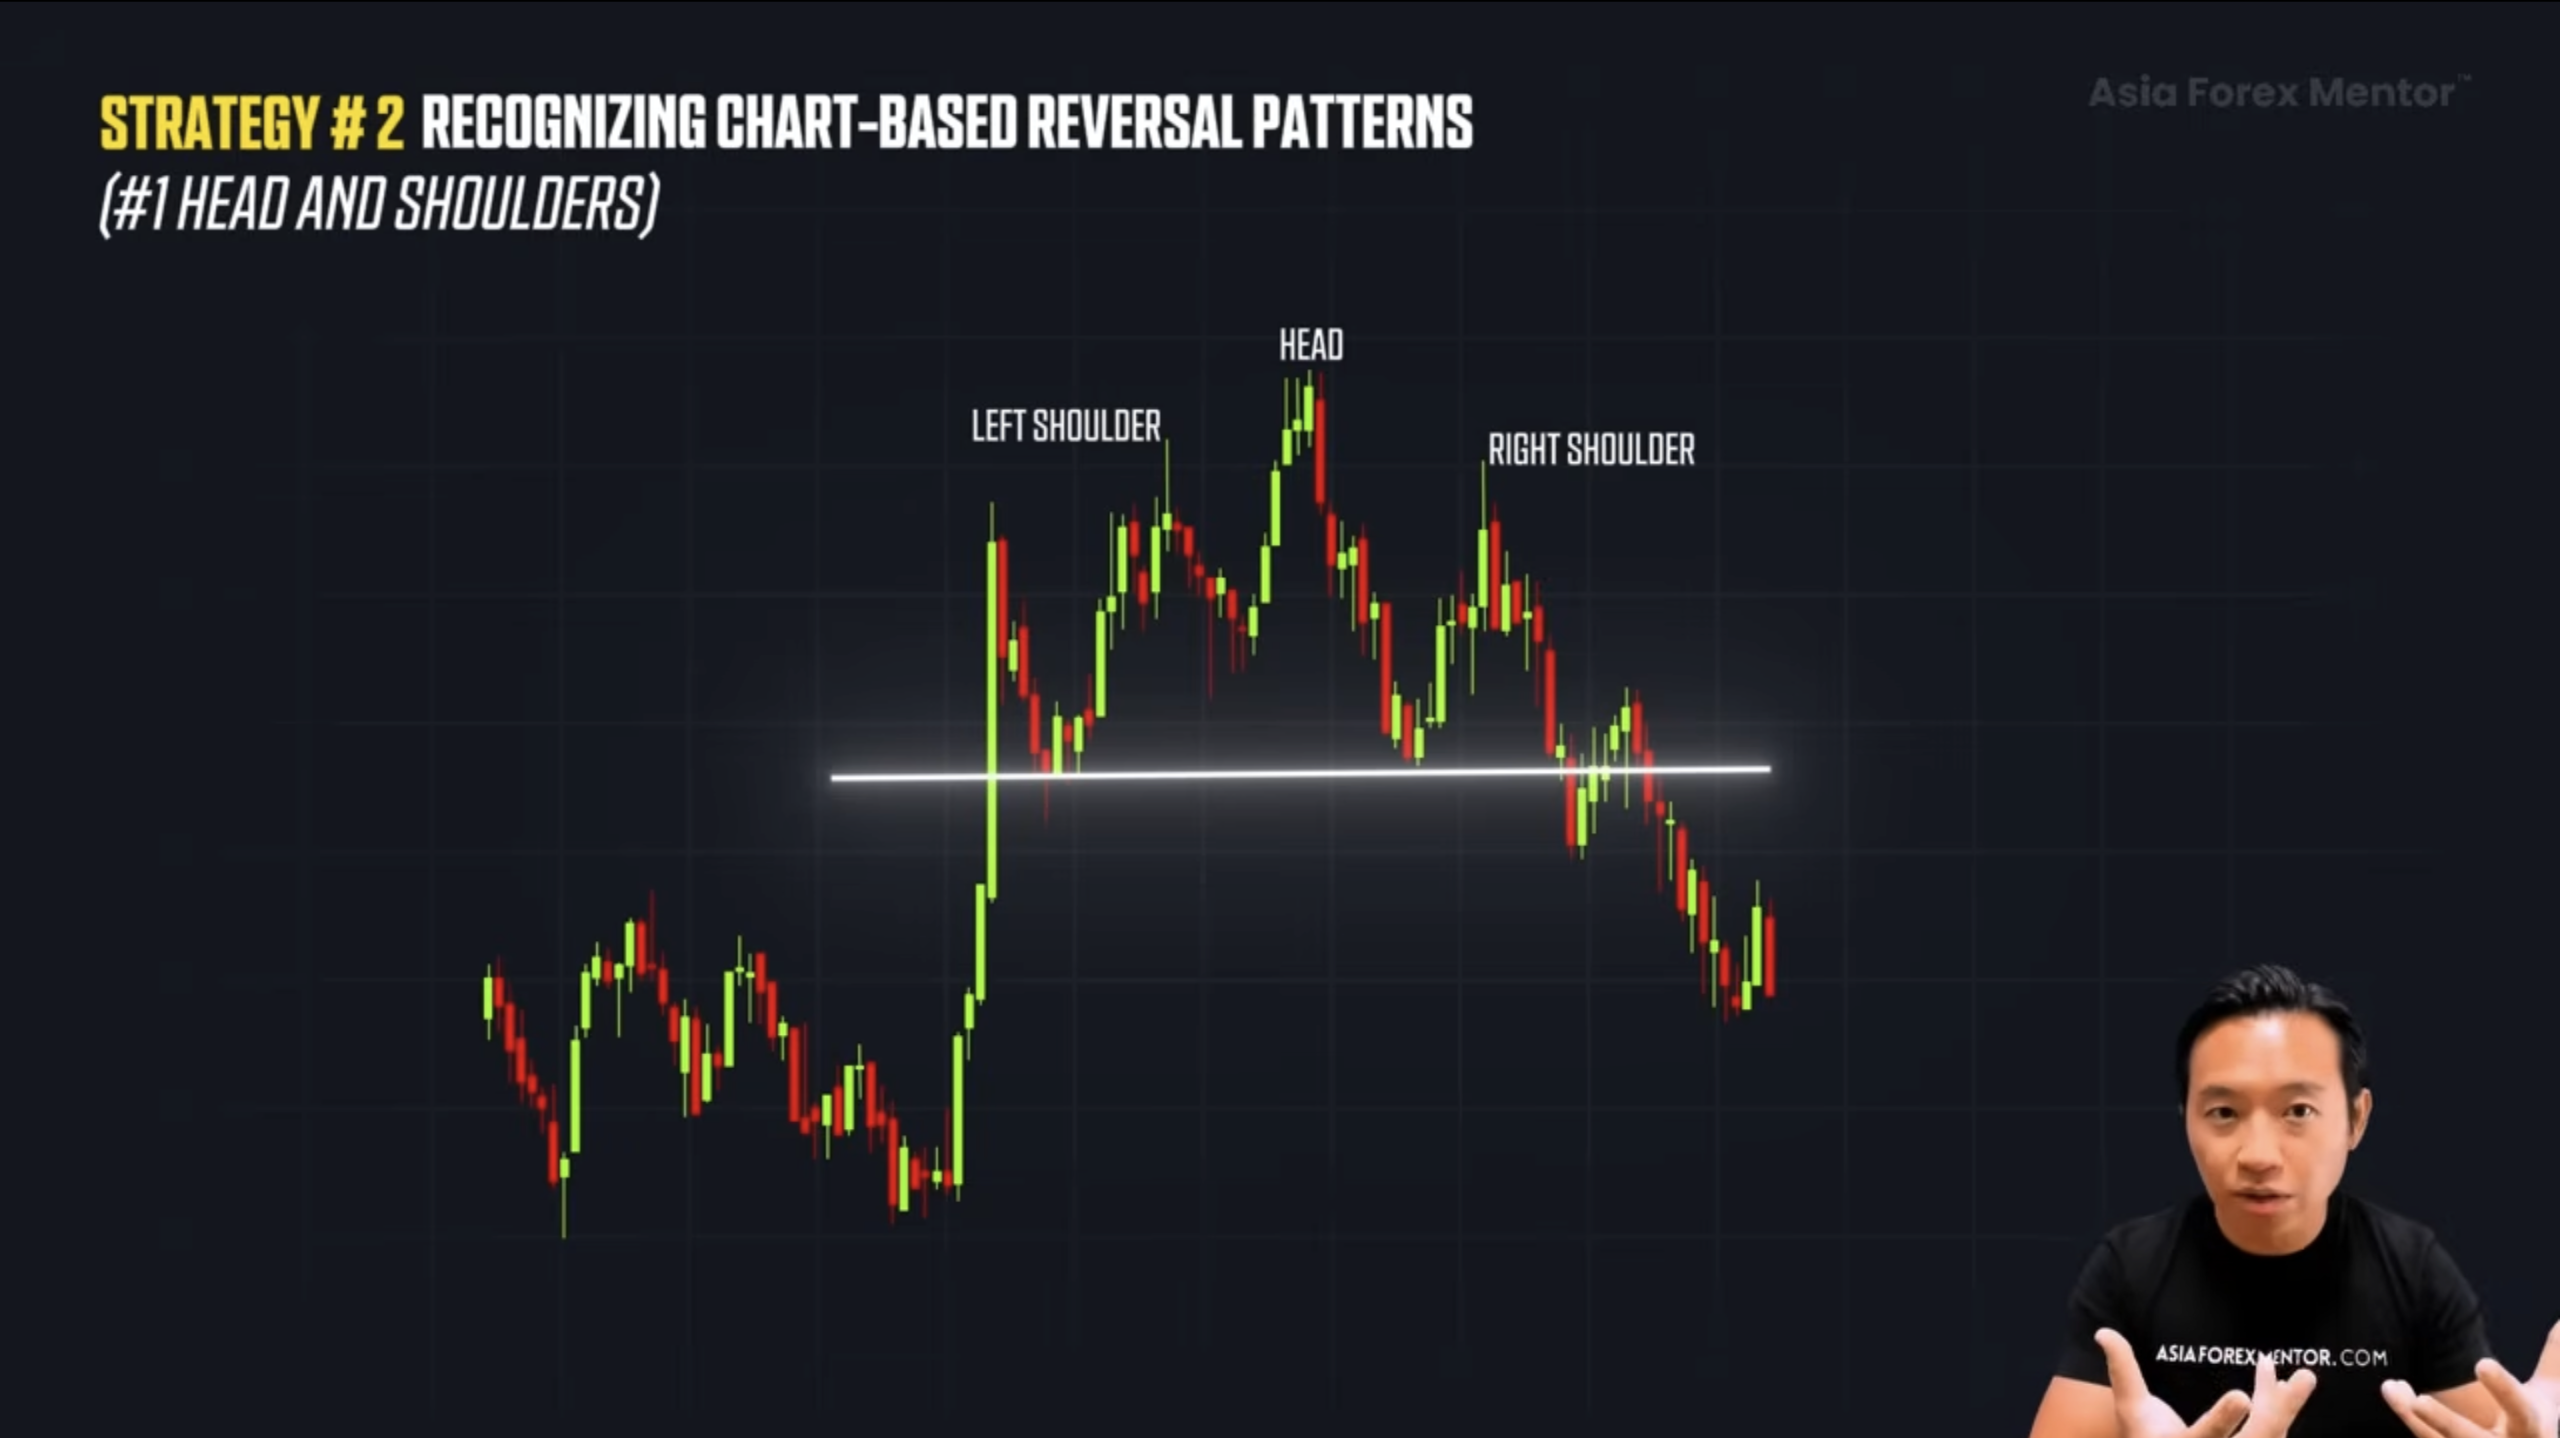
Let us start with one of the strongest reversal formations. The Head and Shoulders pattern. This pattern is built from three swings in a trend.
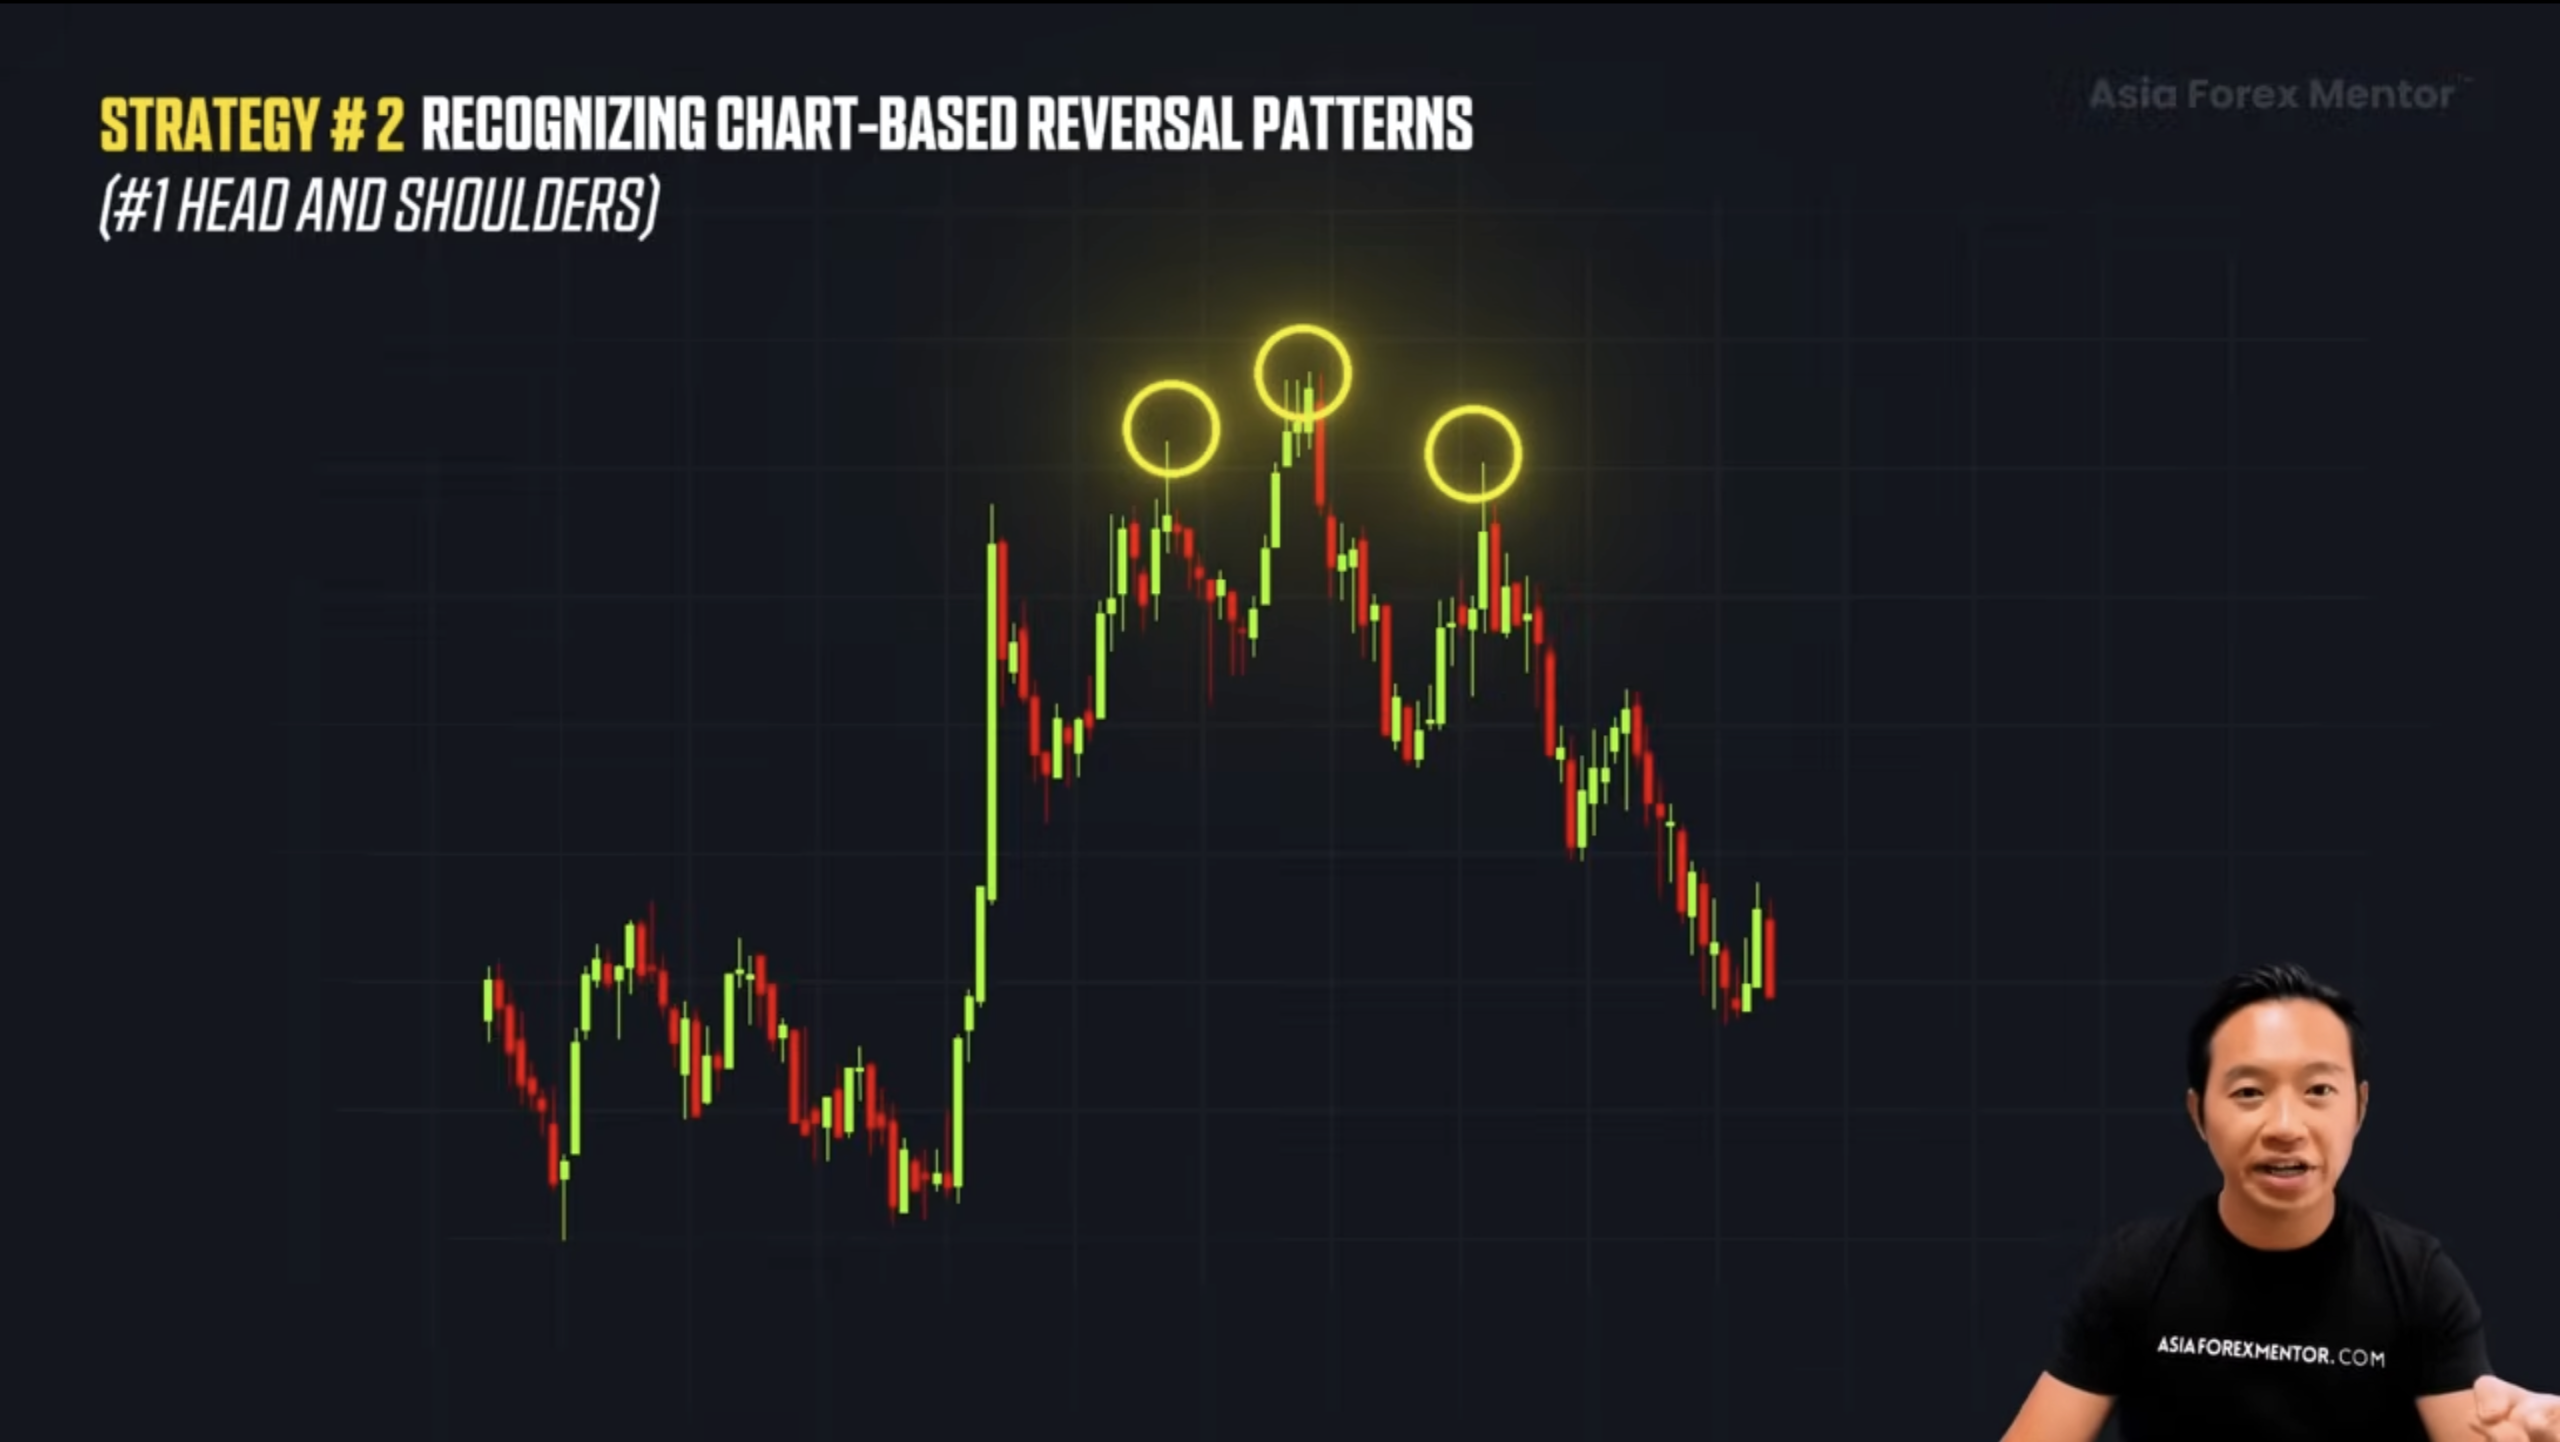
In an uptrend, price makes a higher high, the head, then a lower high, forming the right shoulder. That tells you momentum is fading. Buyers no longer have enough strength to push past the previous high.
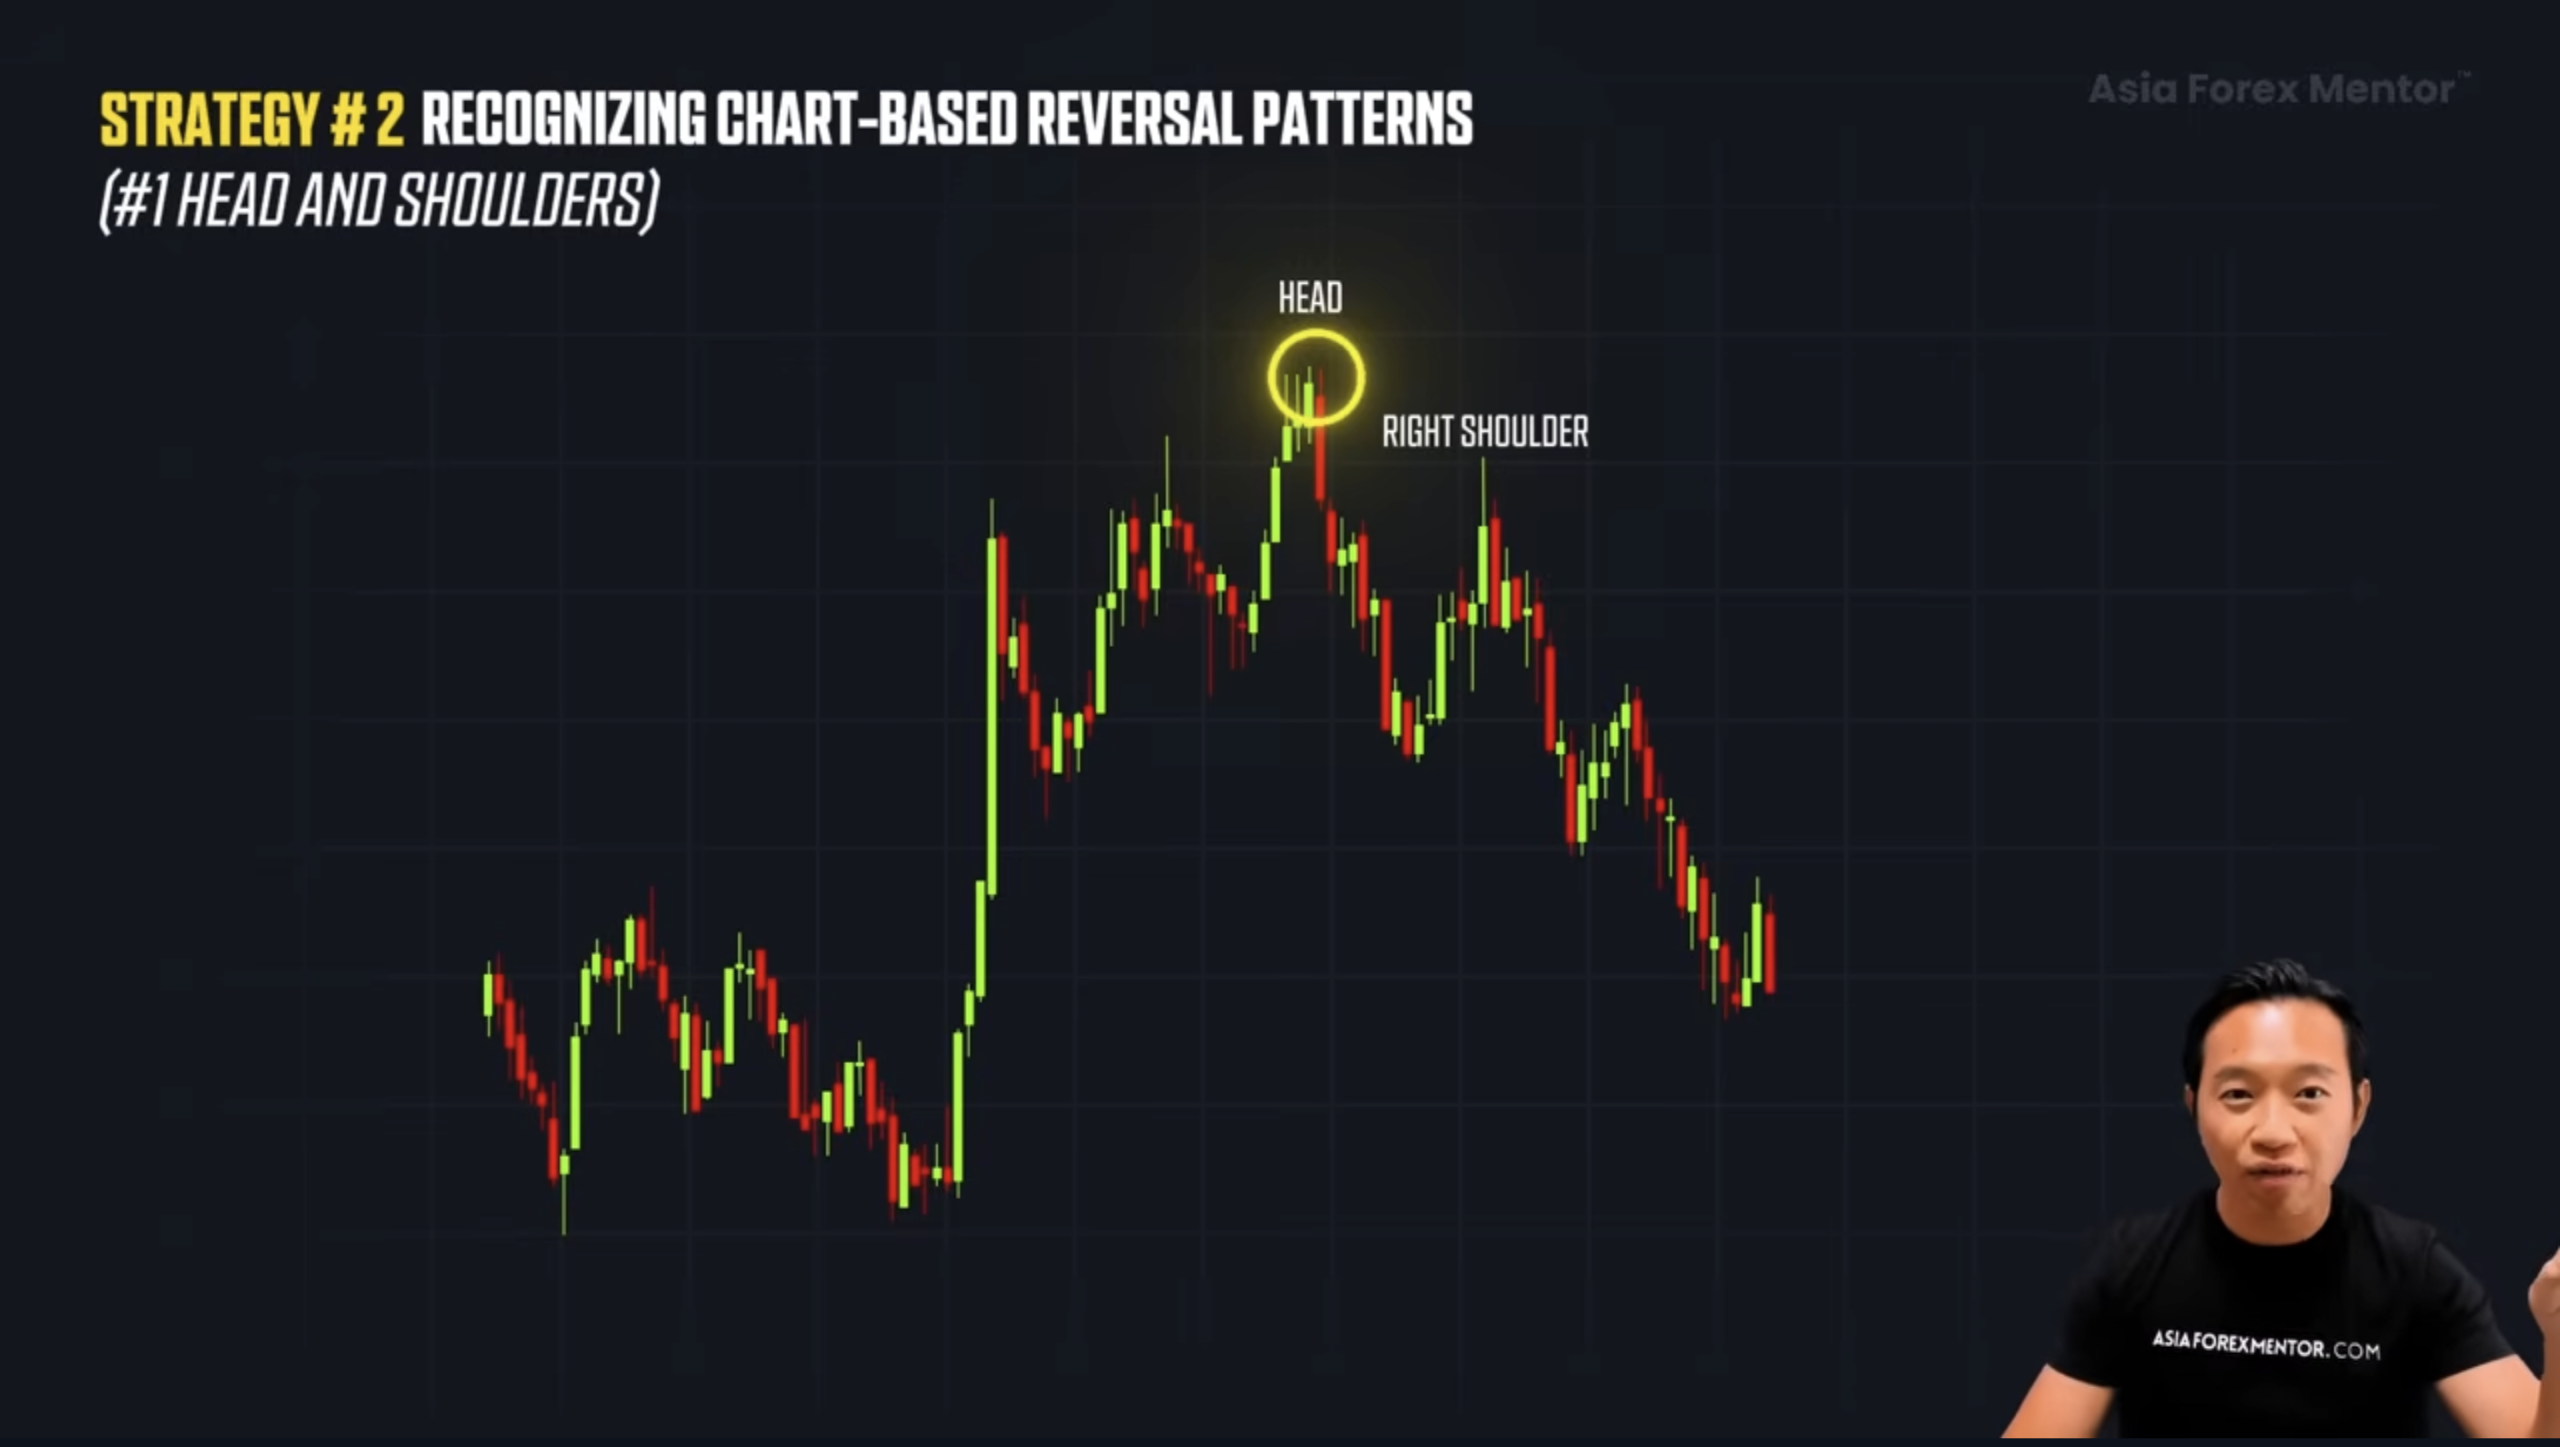
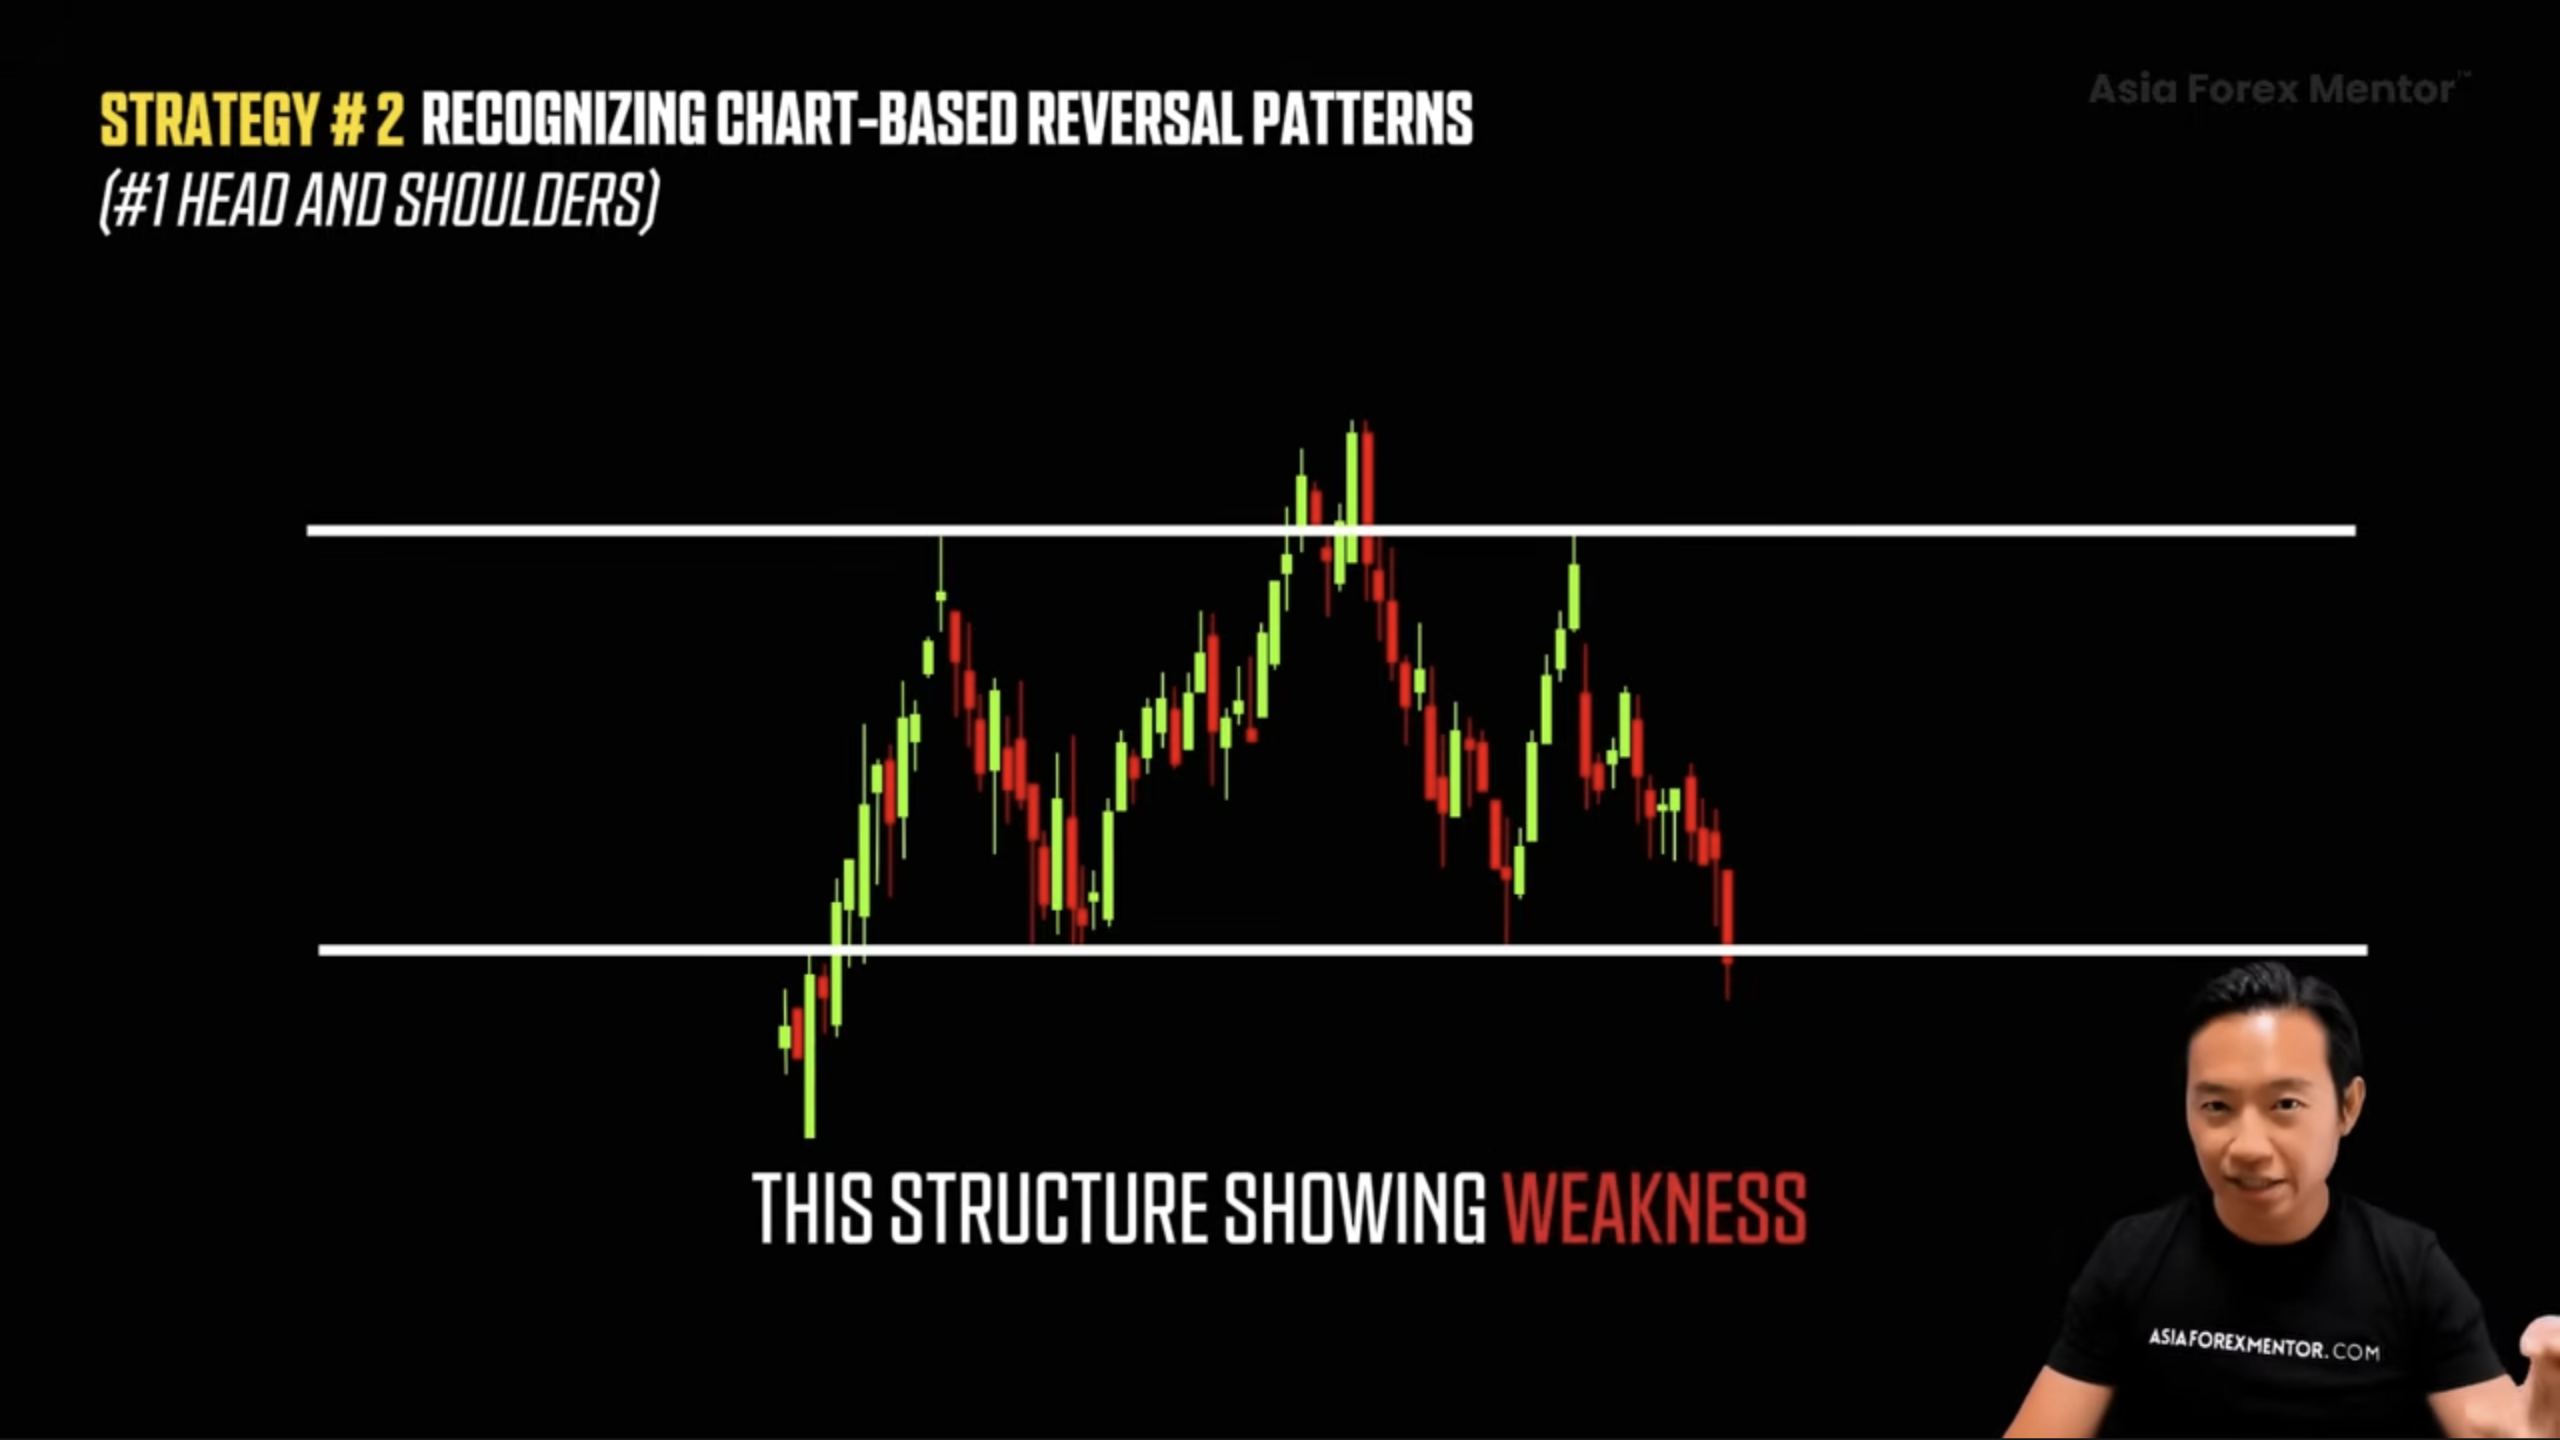
When both shoulders form around the same area and the neckline lines up evenly, that symmetry reveals hesitation. It is structure showing weakness, not emotion.
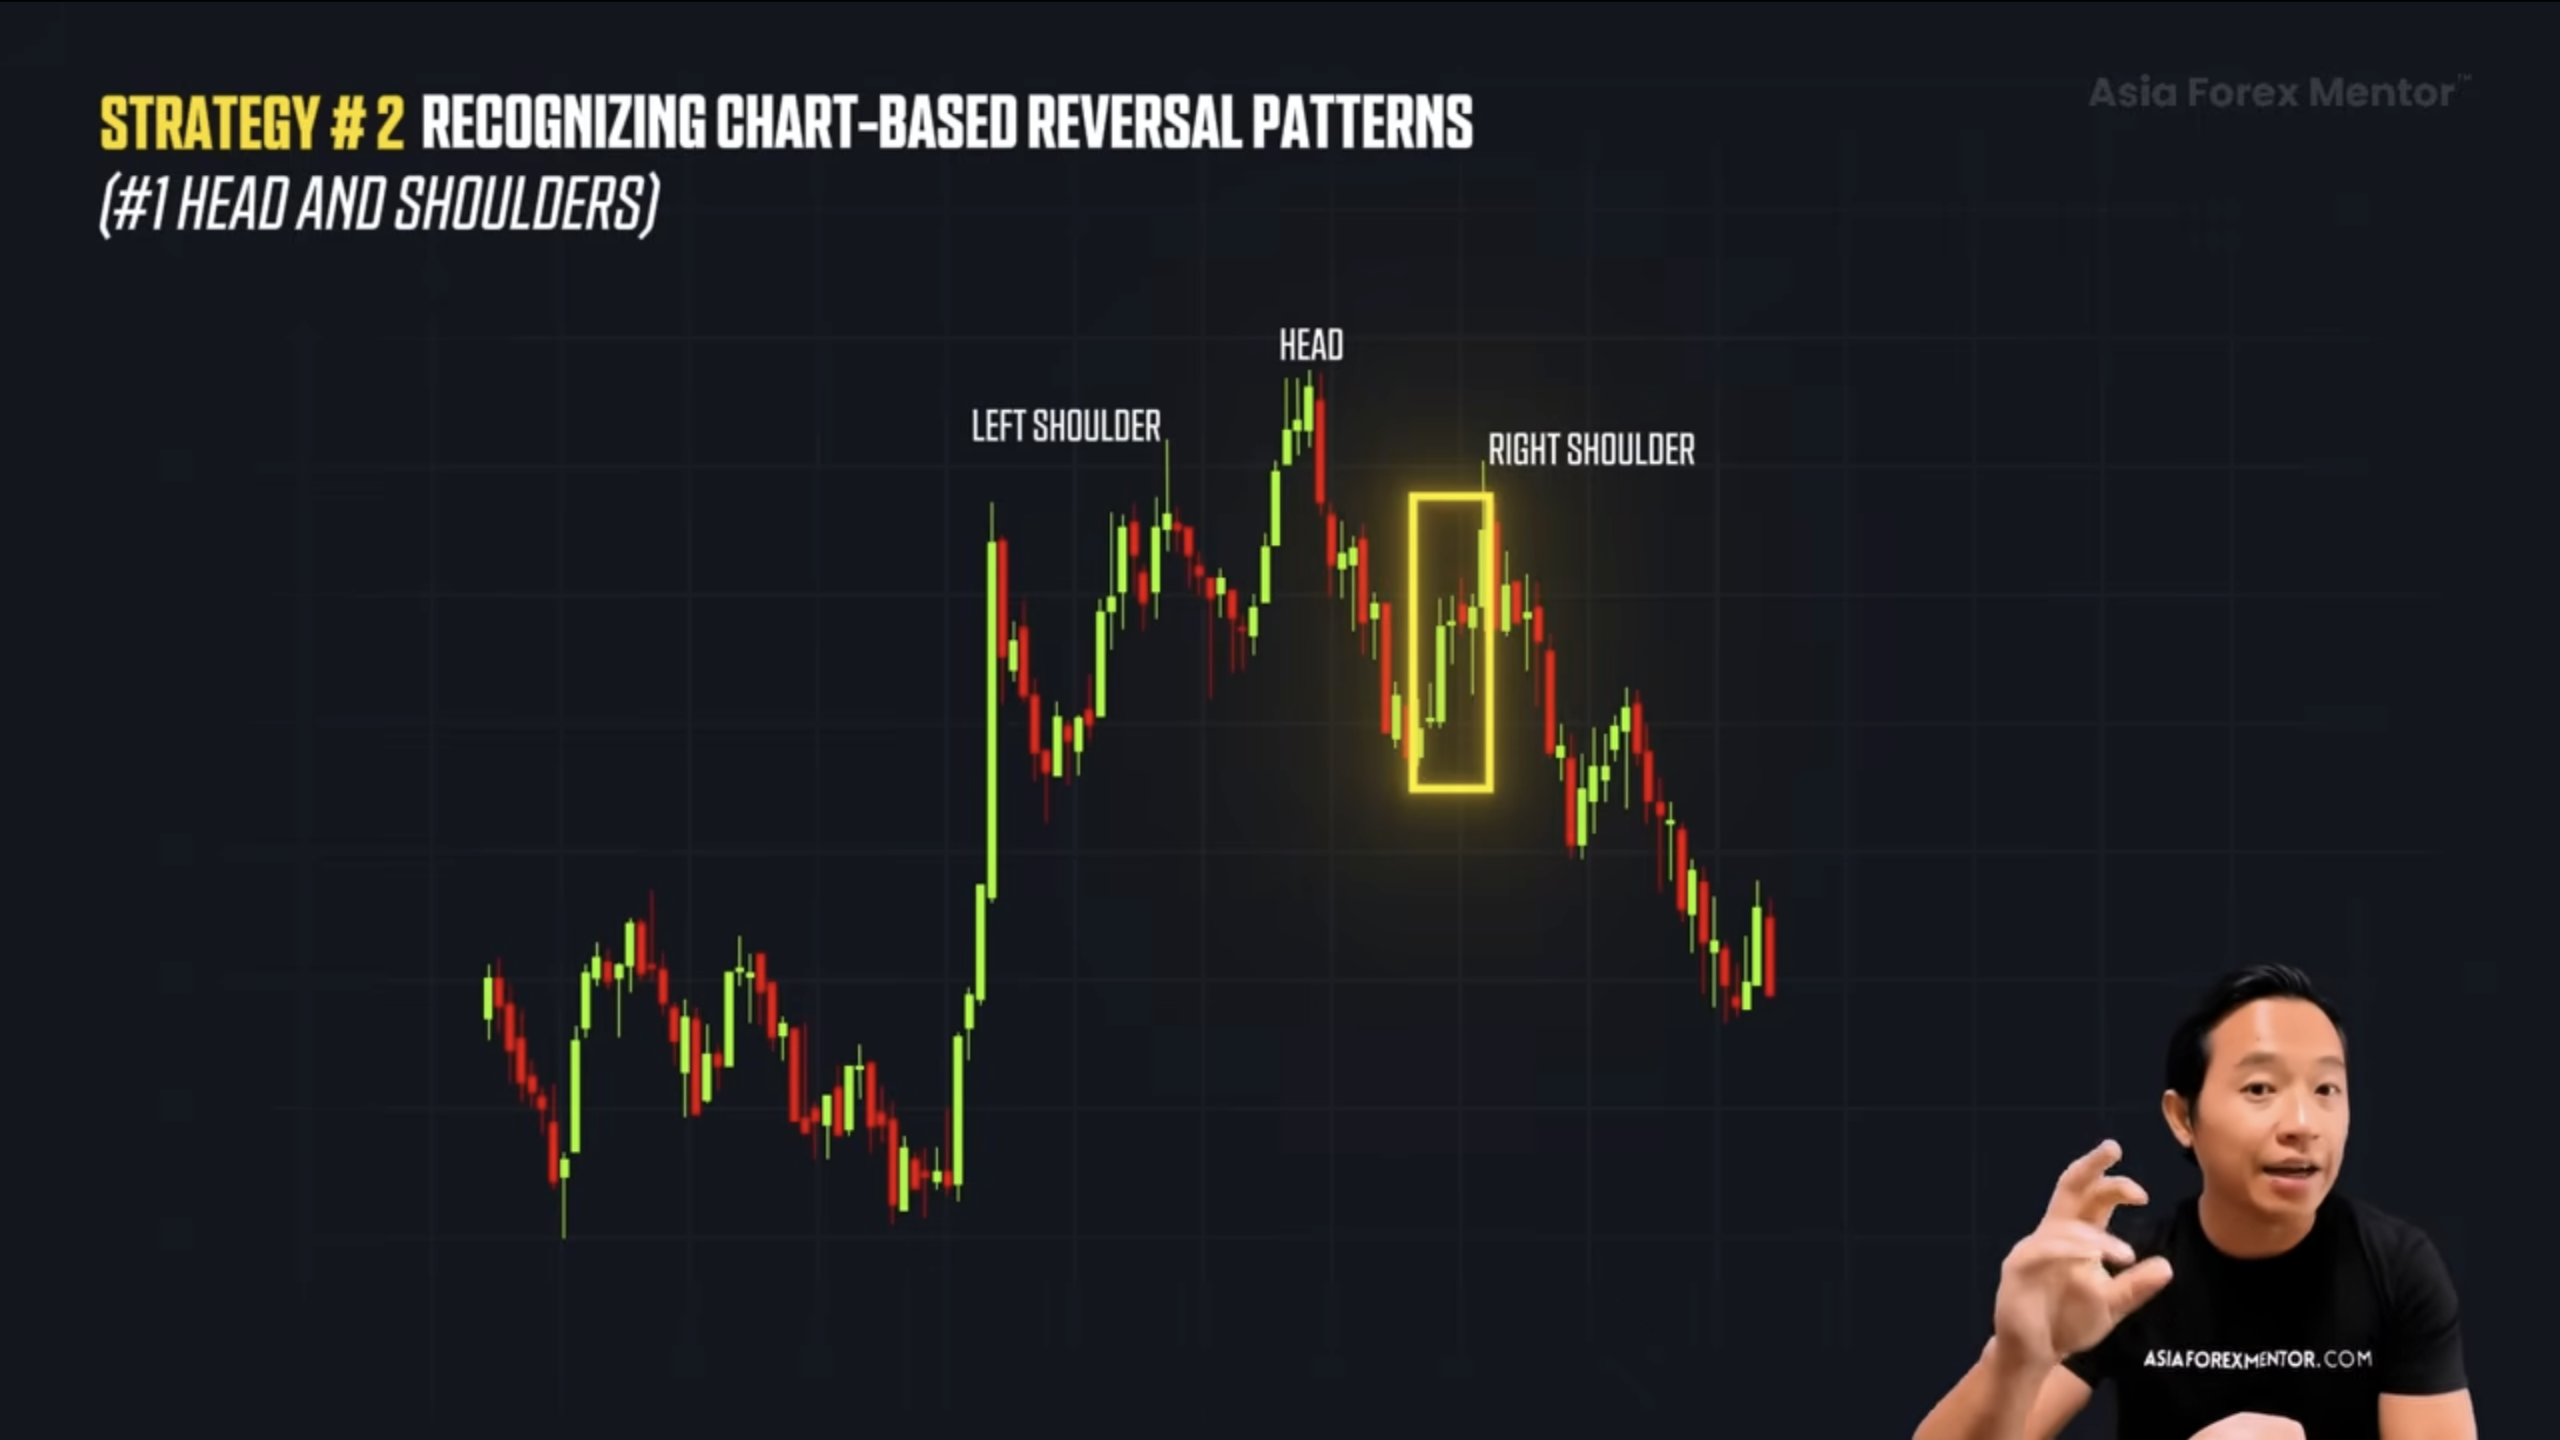
A clean Head and Shoulders usually has a final exhaustion push. Strong bullish candles try to break higher,
then a decisive bearish candle follows. That is control shifting hands.
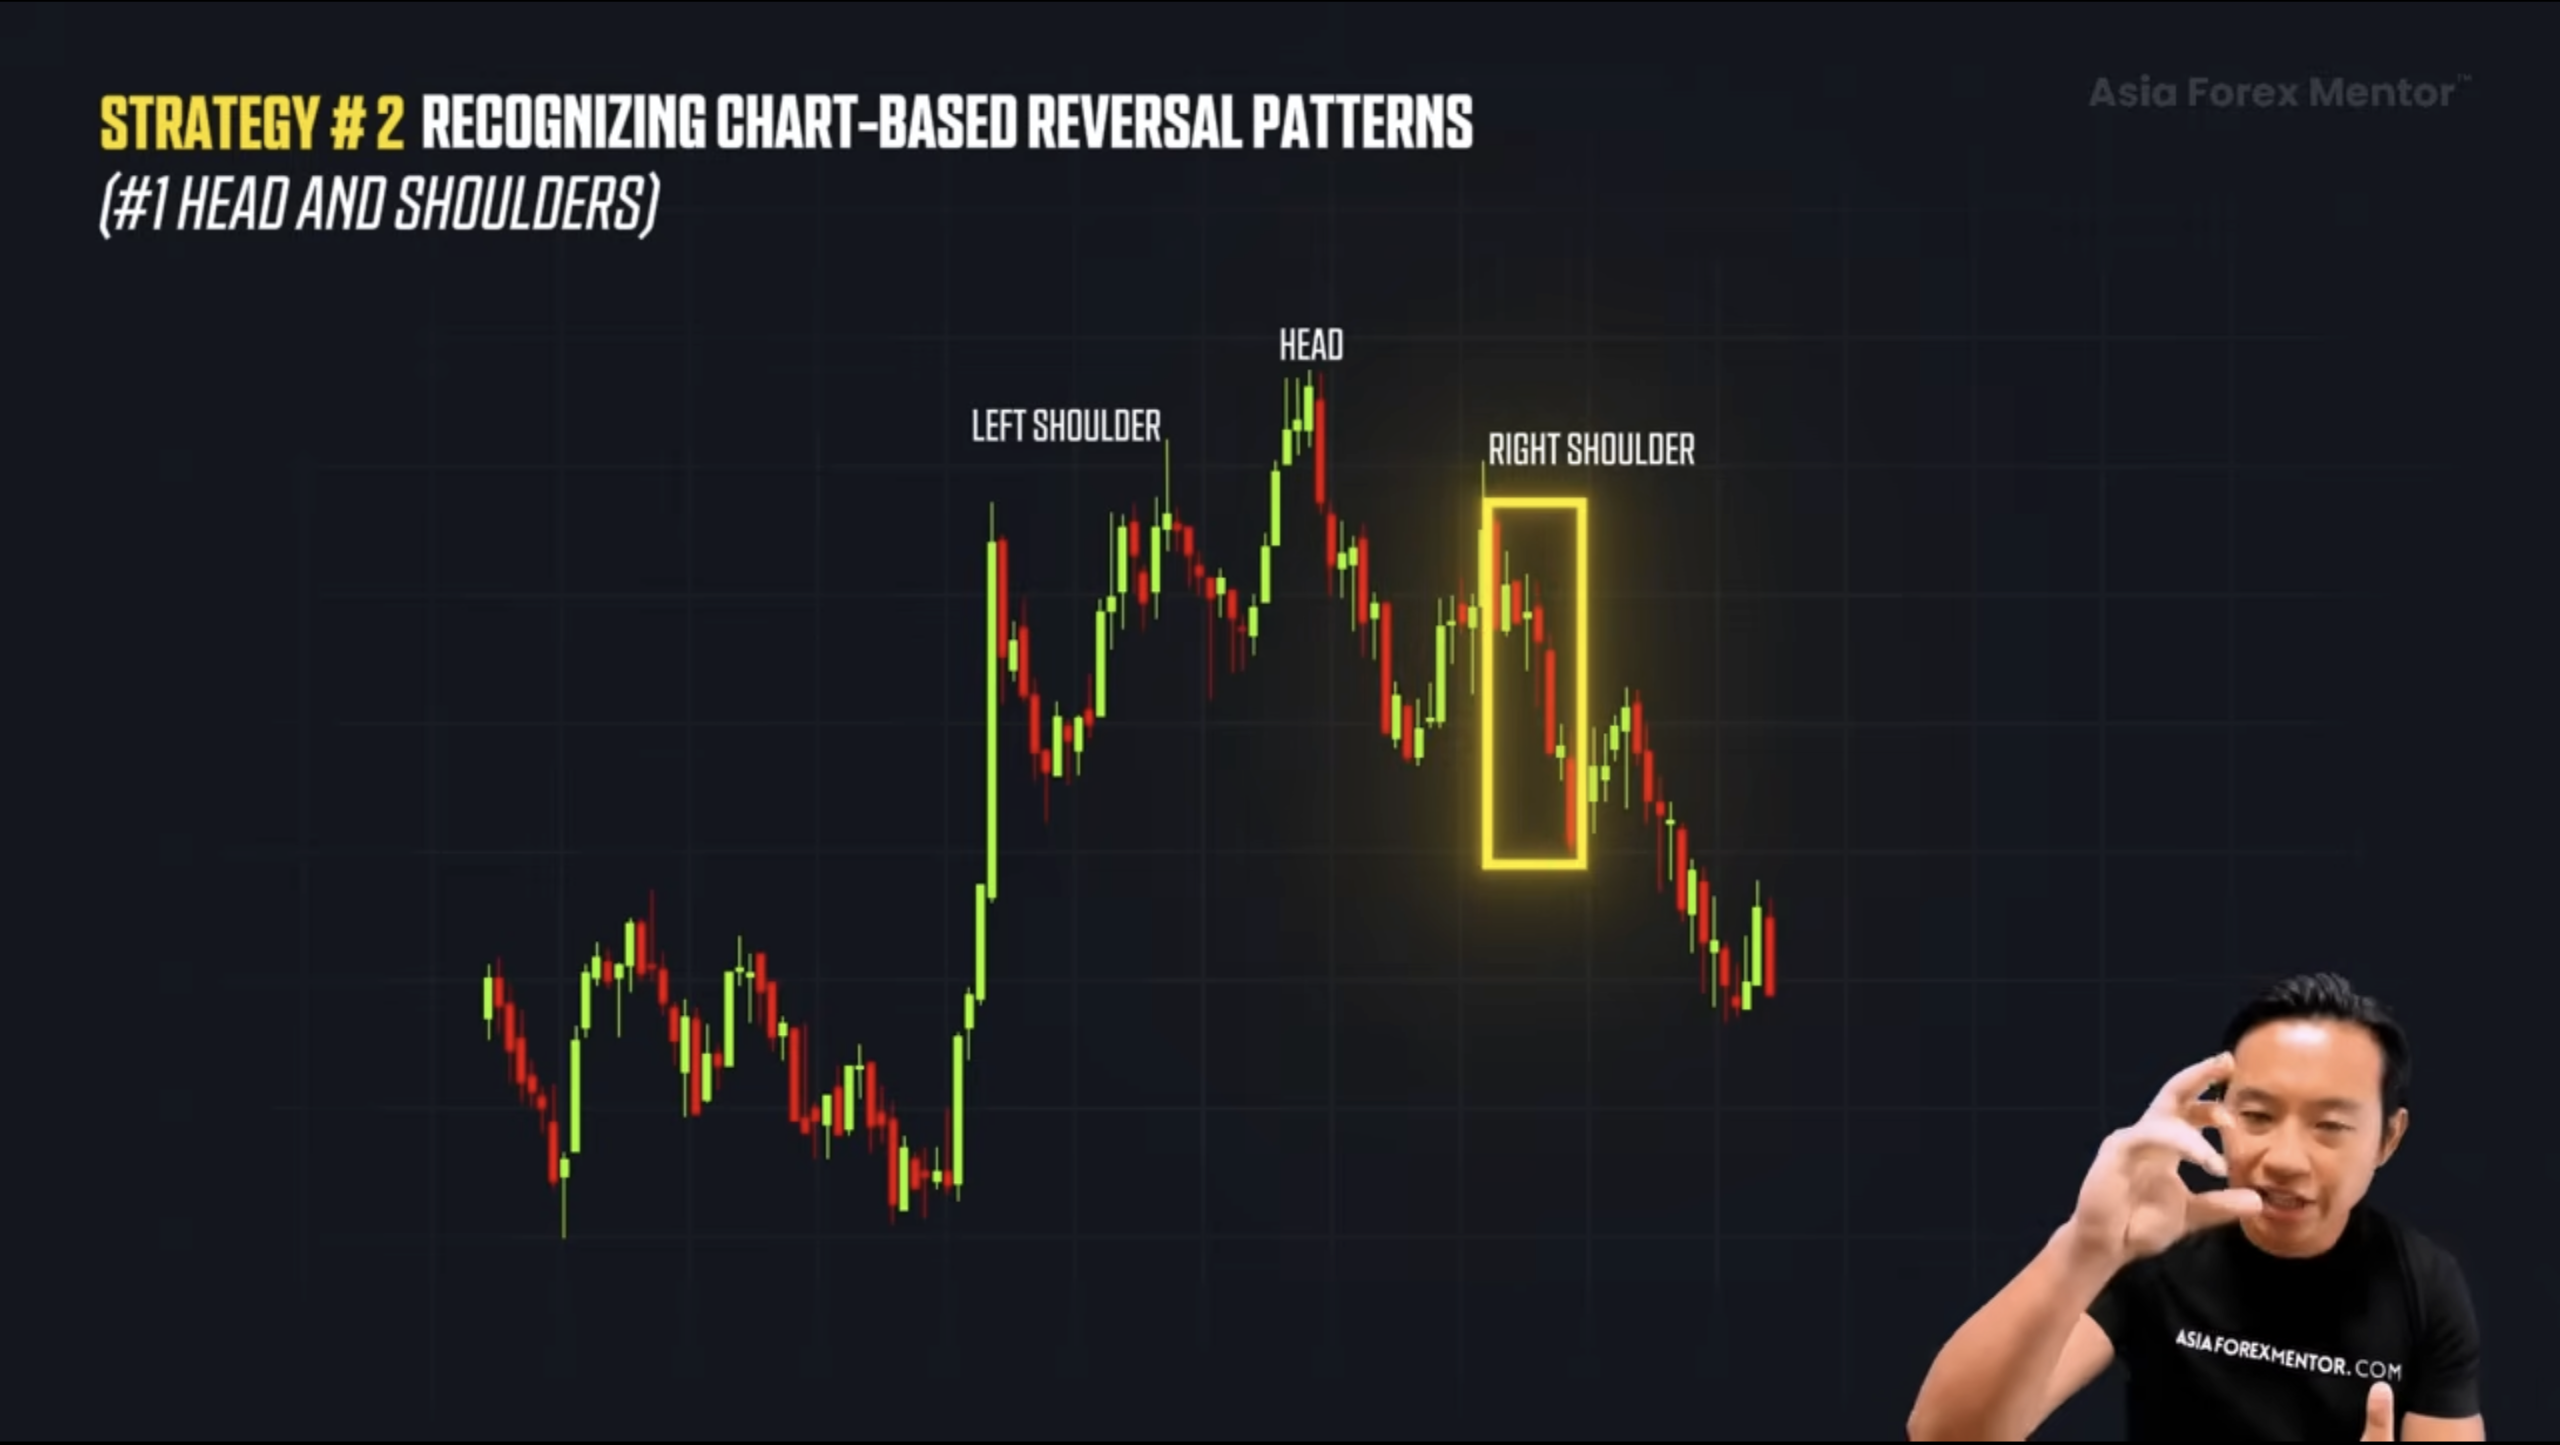
Once the neckline breaks, the reversal is confirmed.
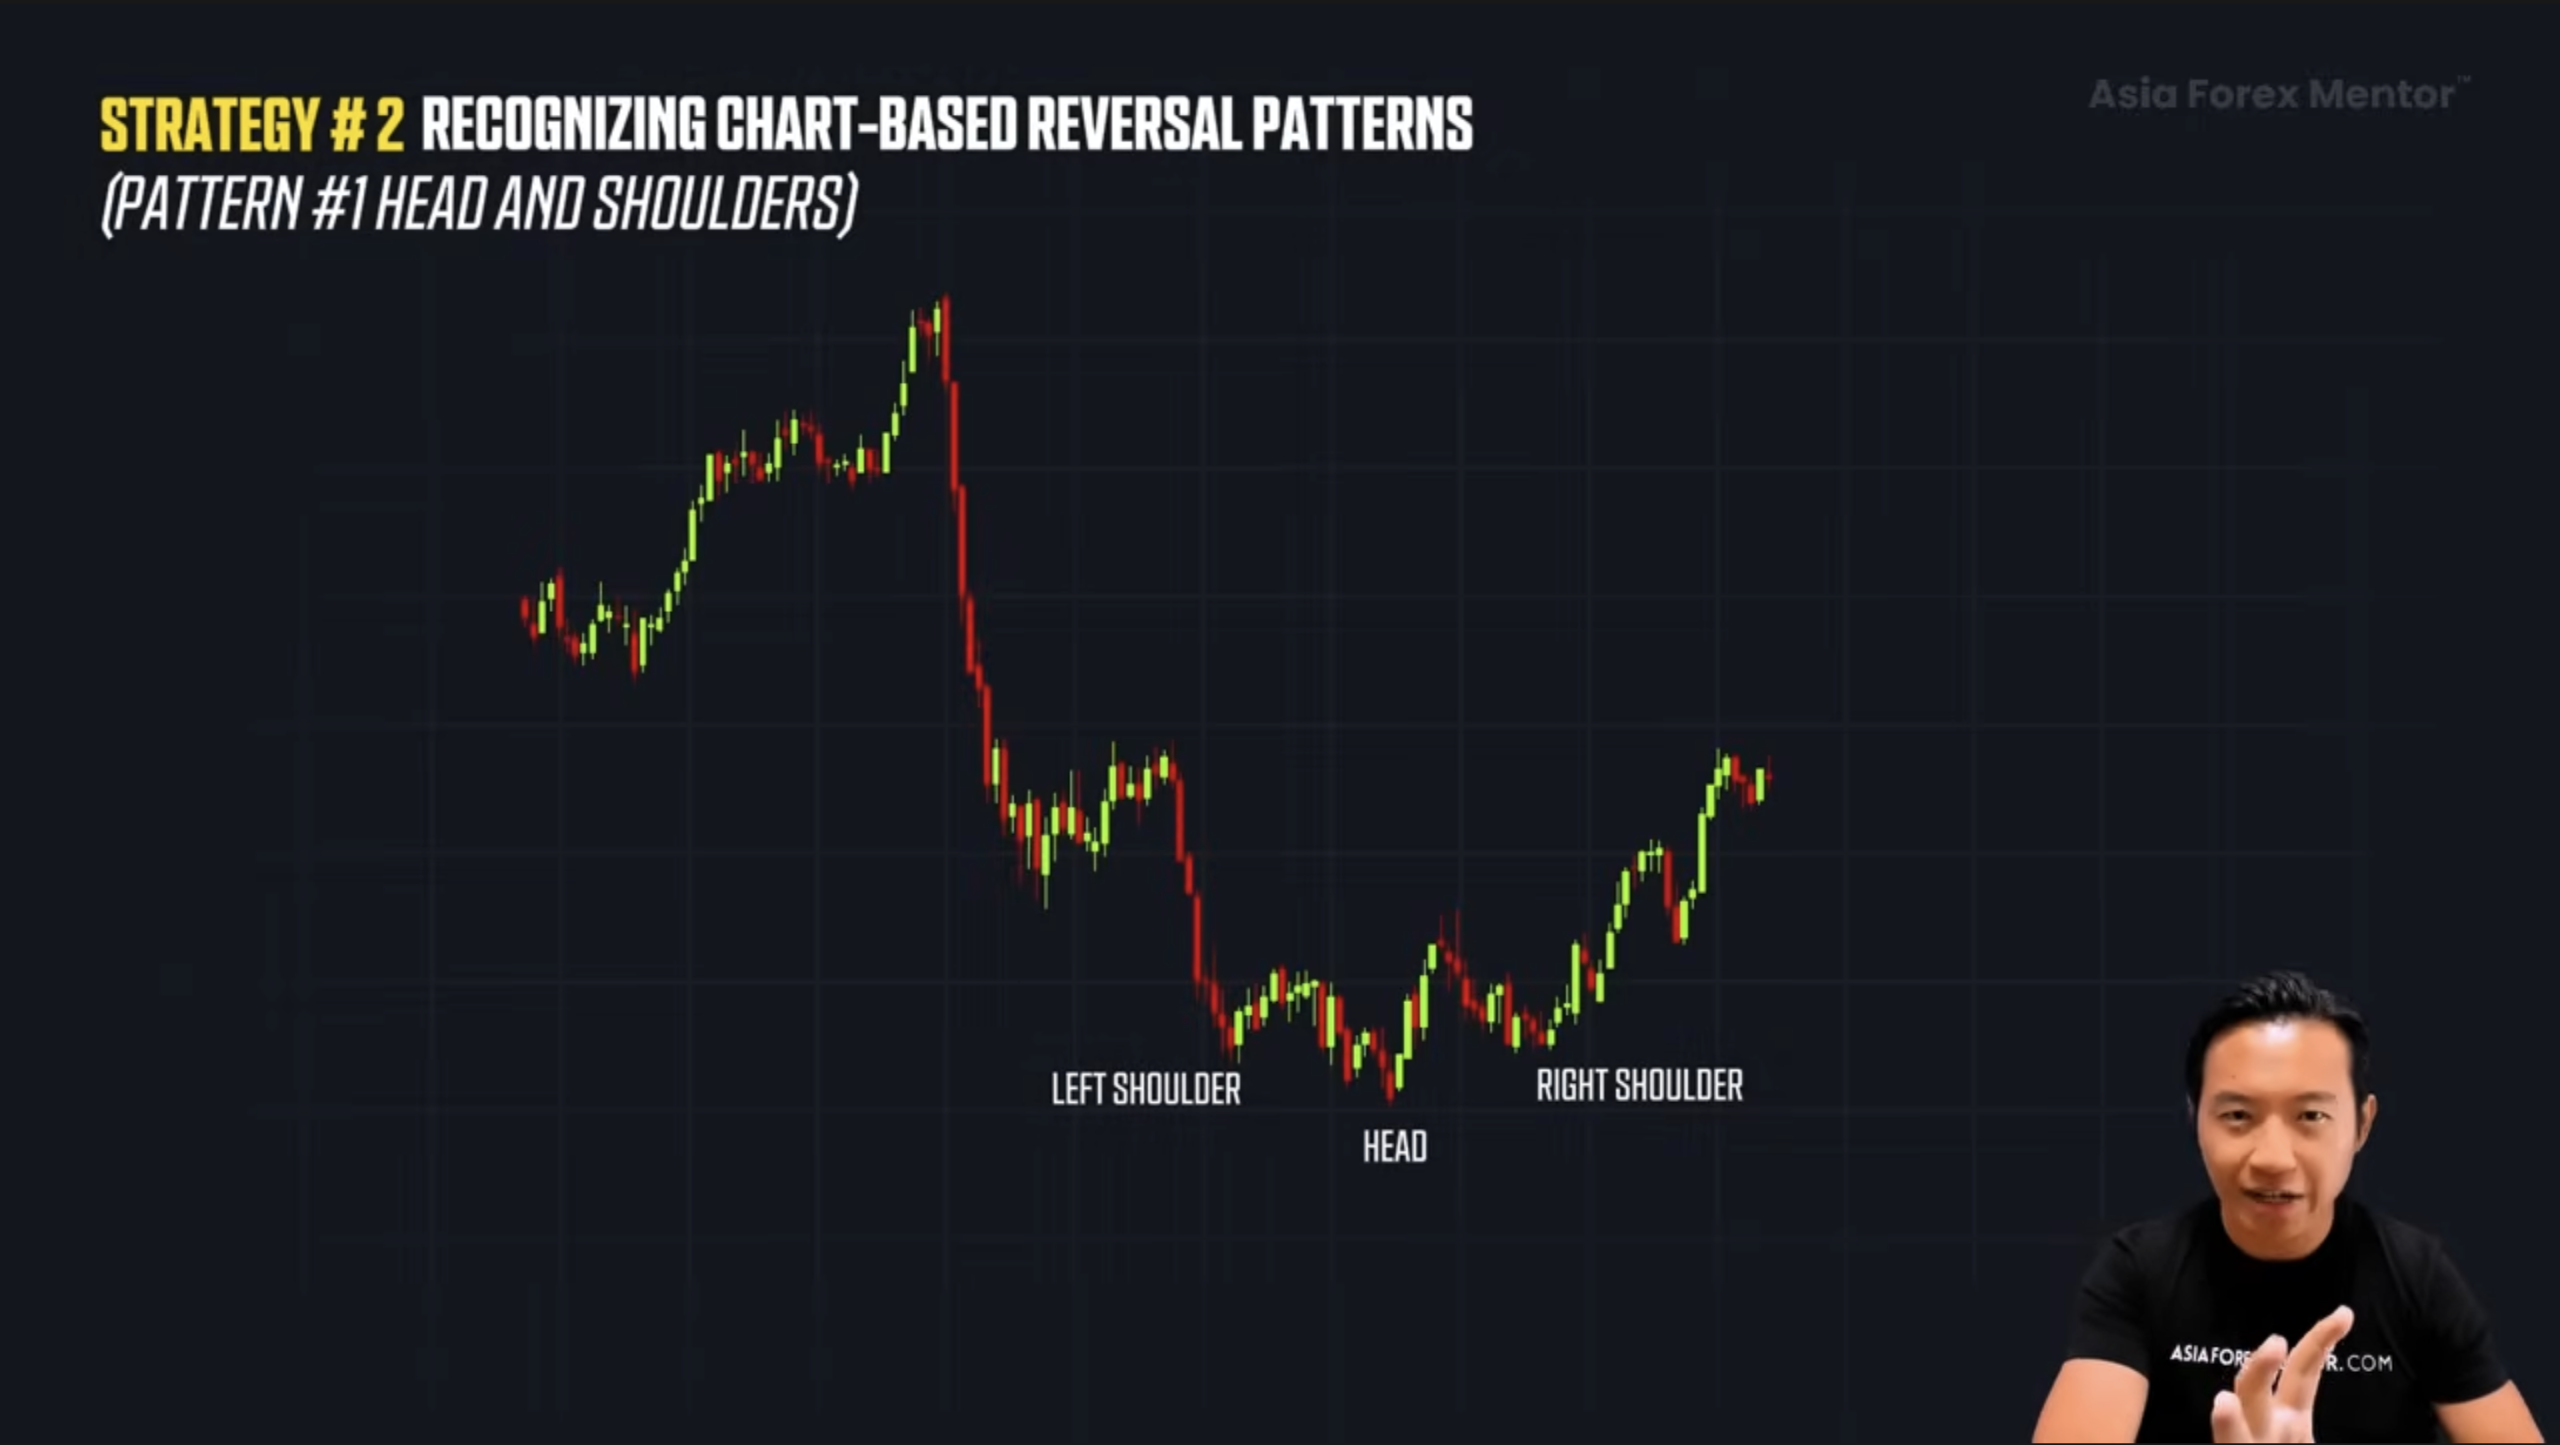
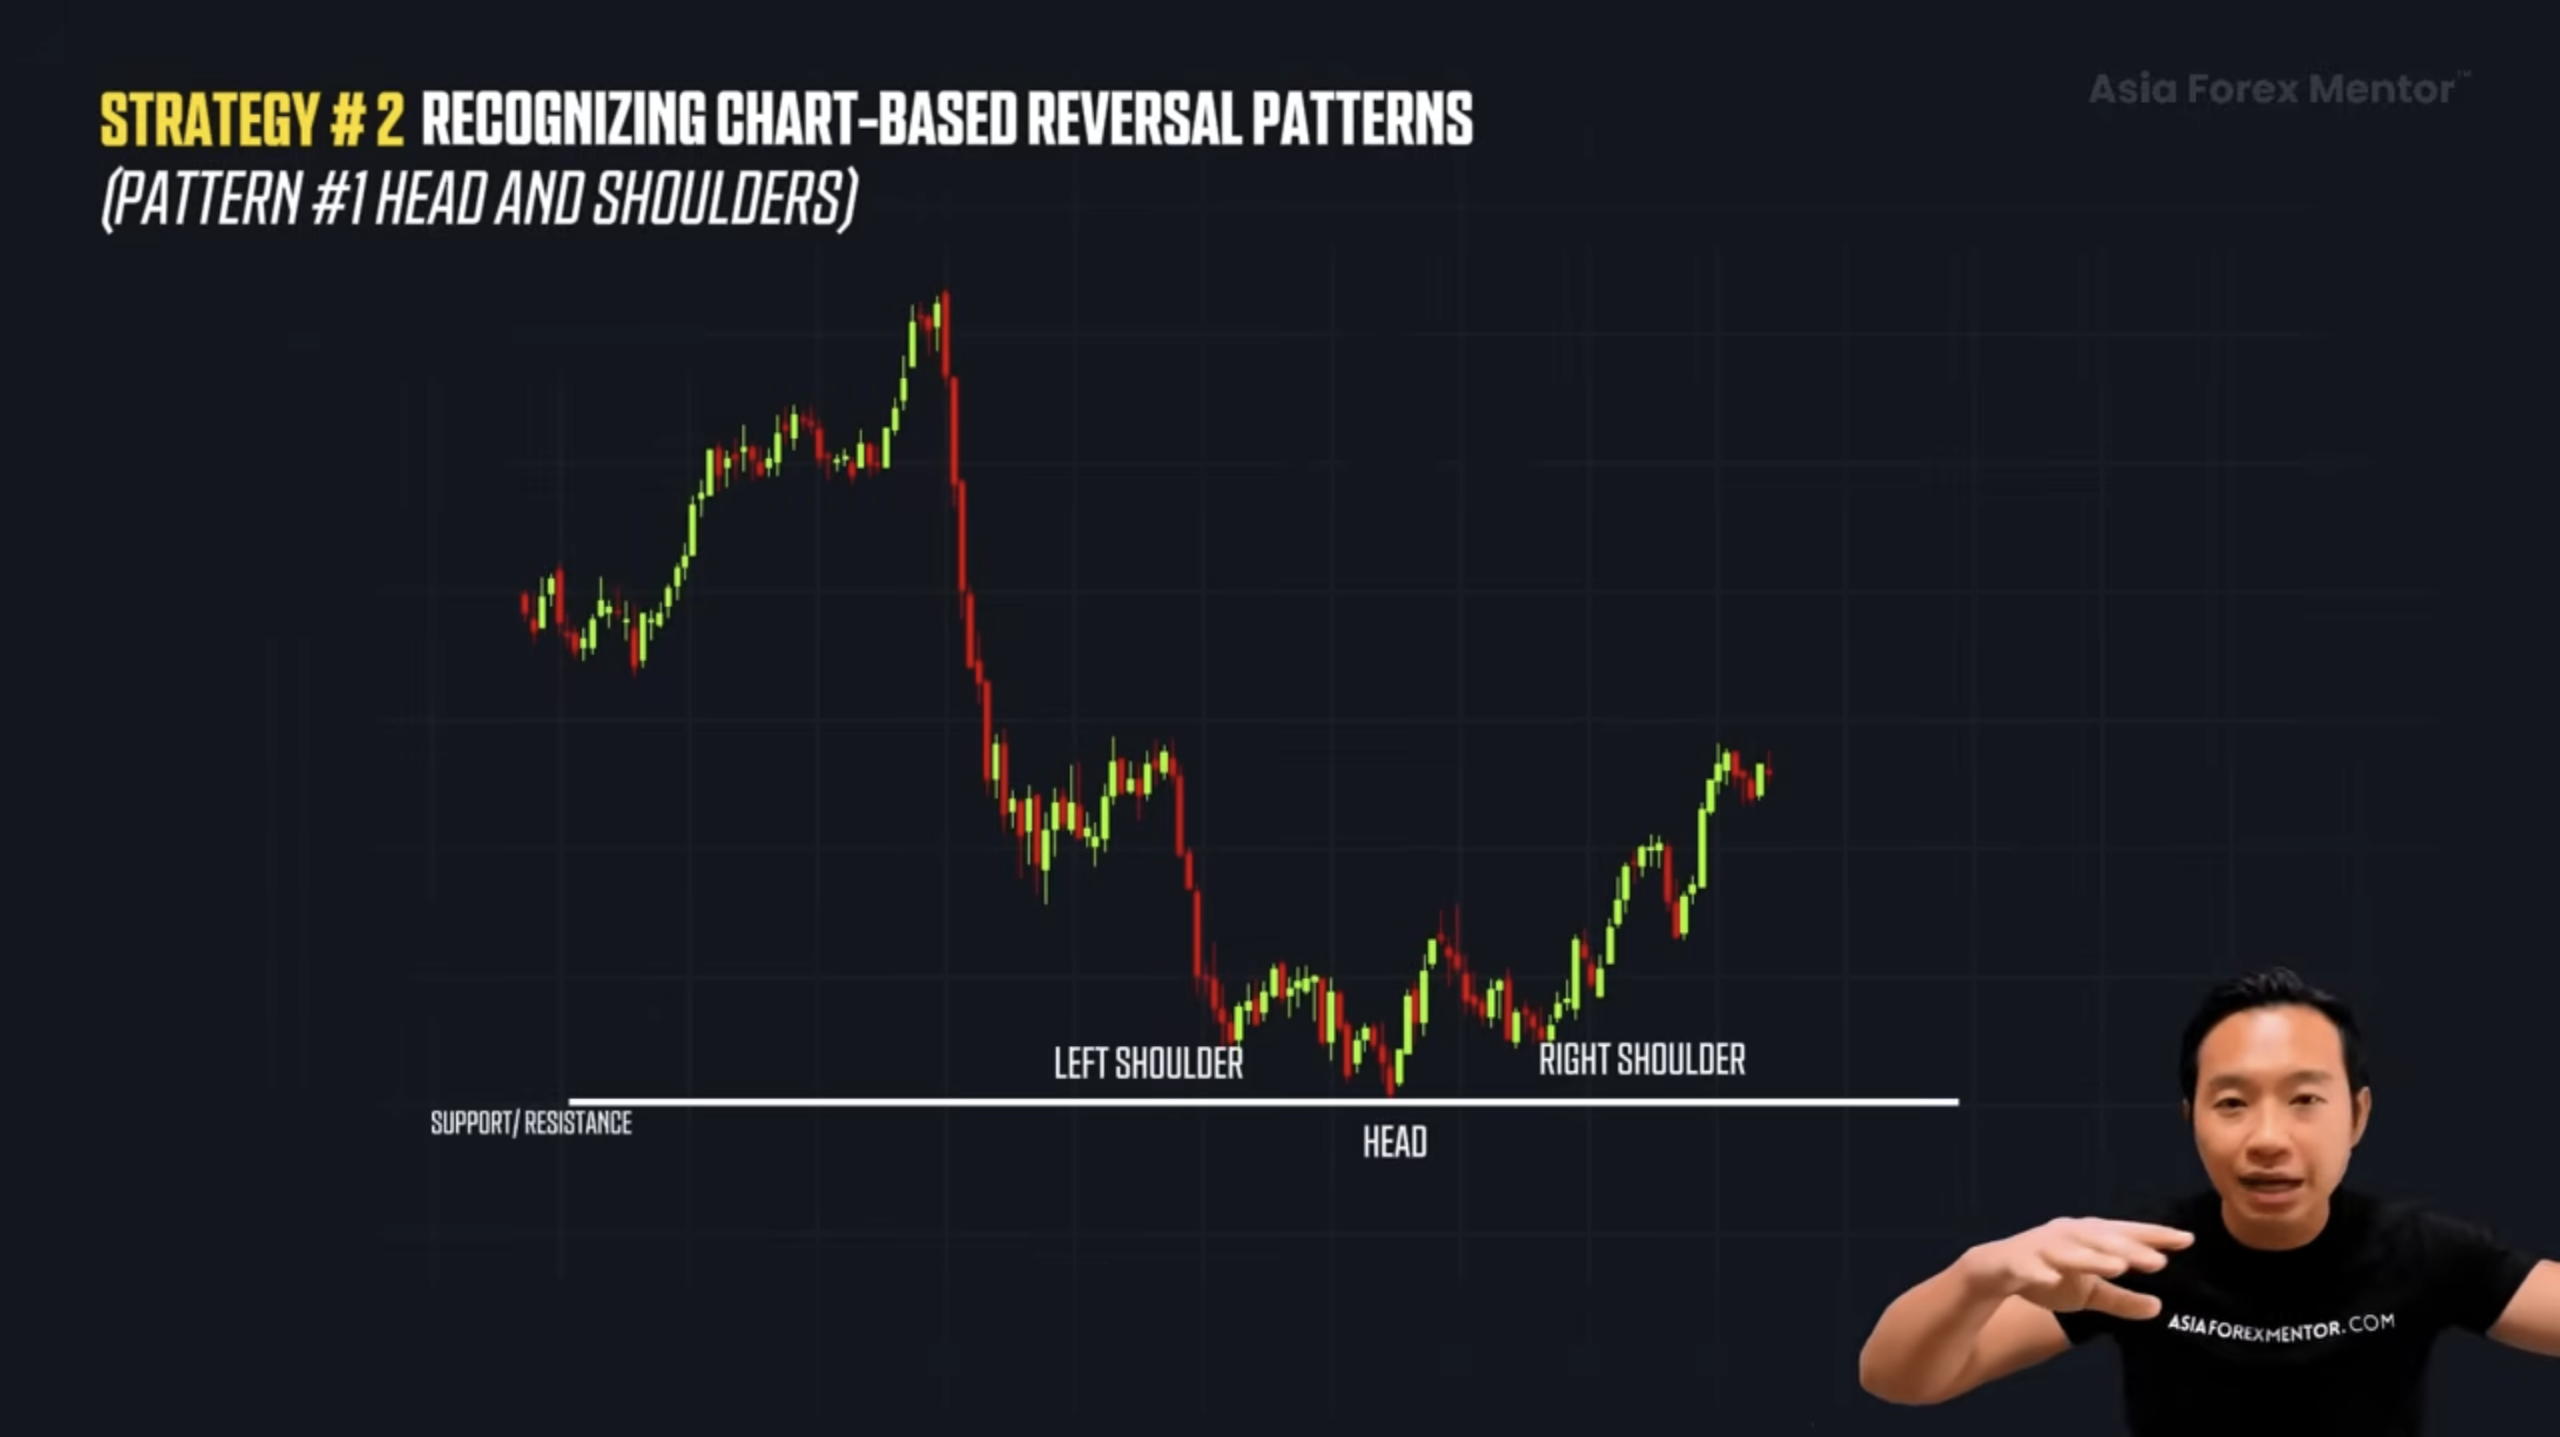
The same logic applies to the Inverse Head and Shoulders in downtrends. Sellers lose control, buyers start to take over.
Patterns work best when aligned with previous zones.  Head and Shoulders near a known resistance increases the probability. You are not relying on shape alone but combining structure with context.
The second pattern is the Double Top and Double Bottom. Price tests a level twice and fails to break through. A Double Top rejects at resistance. While a Double Bottom rejects at support.
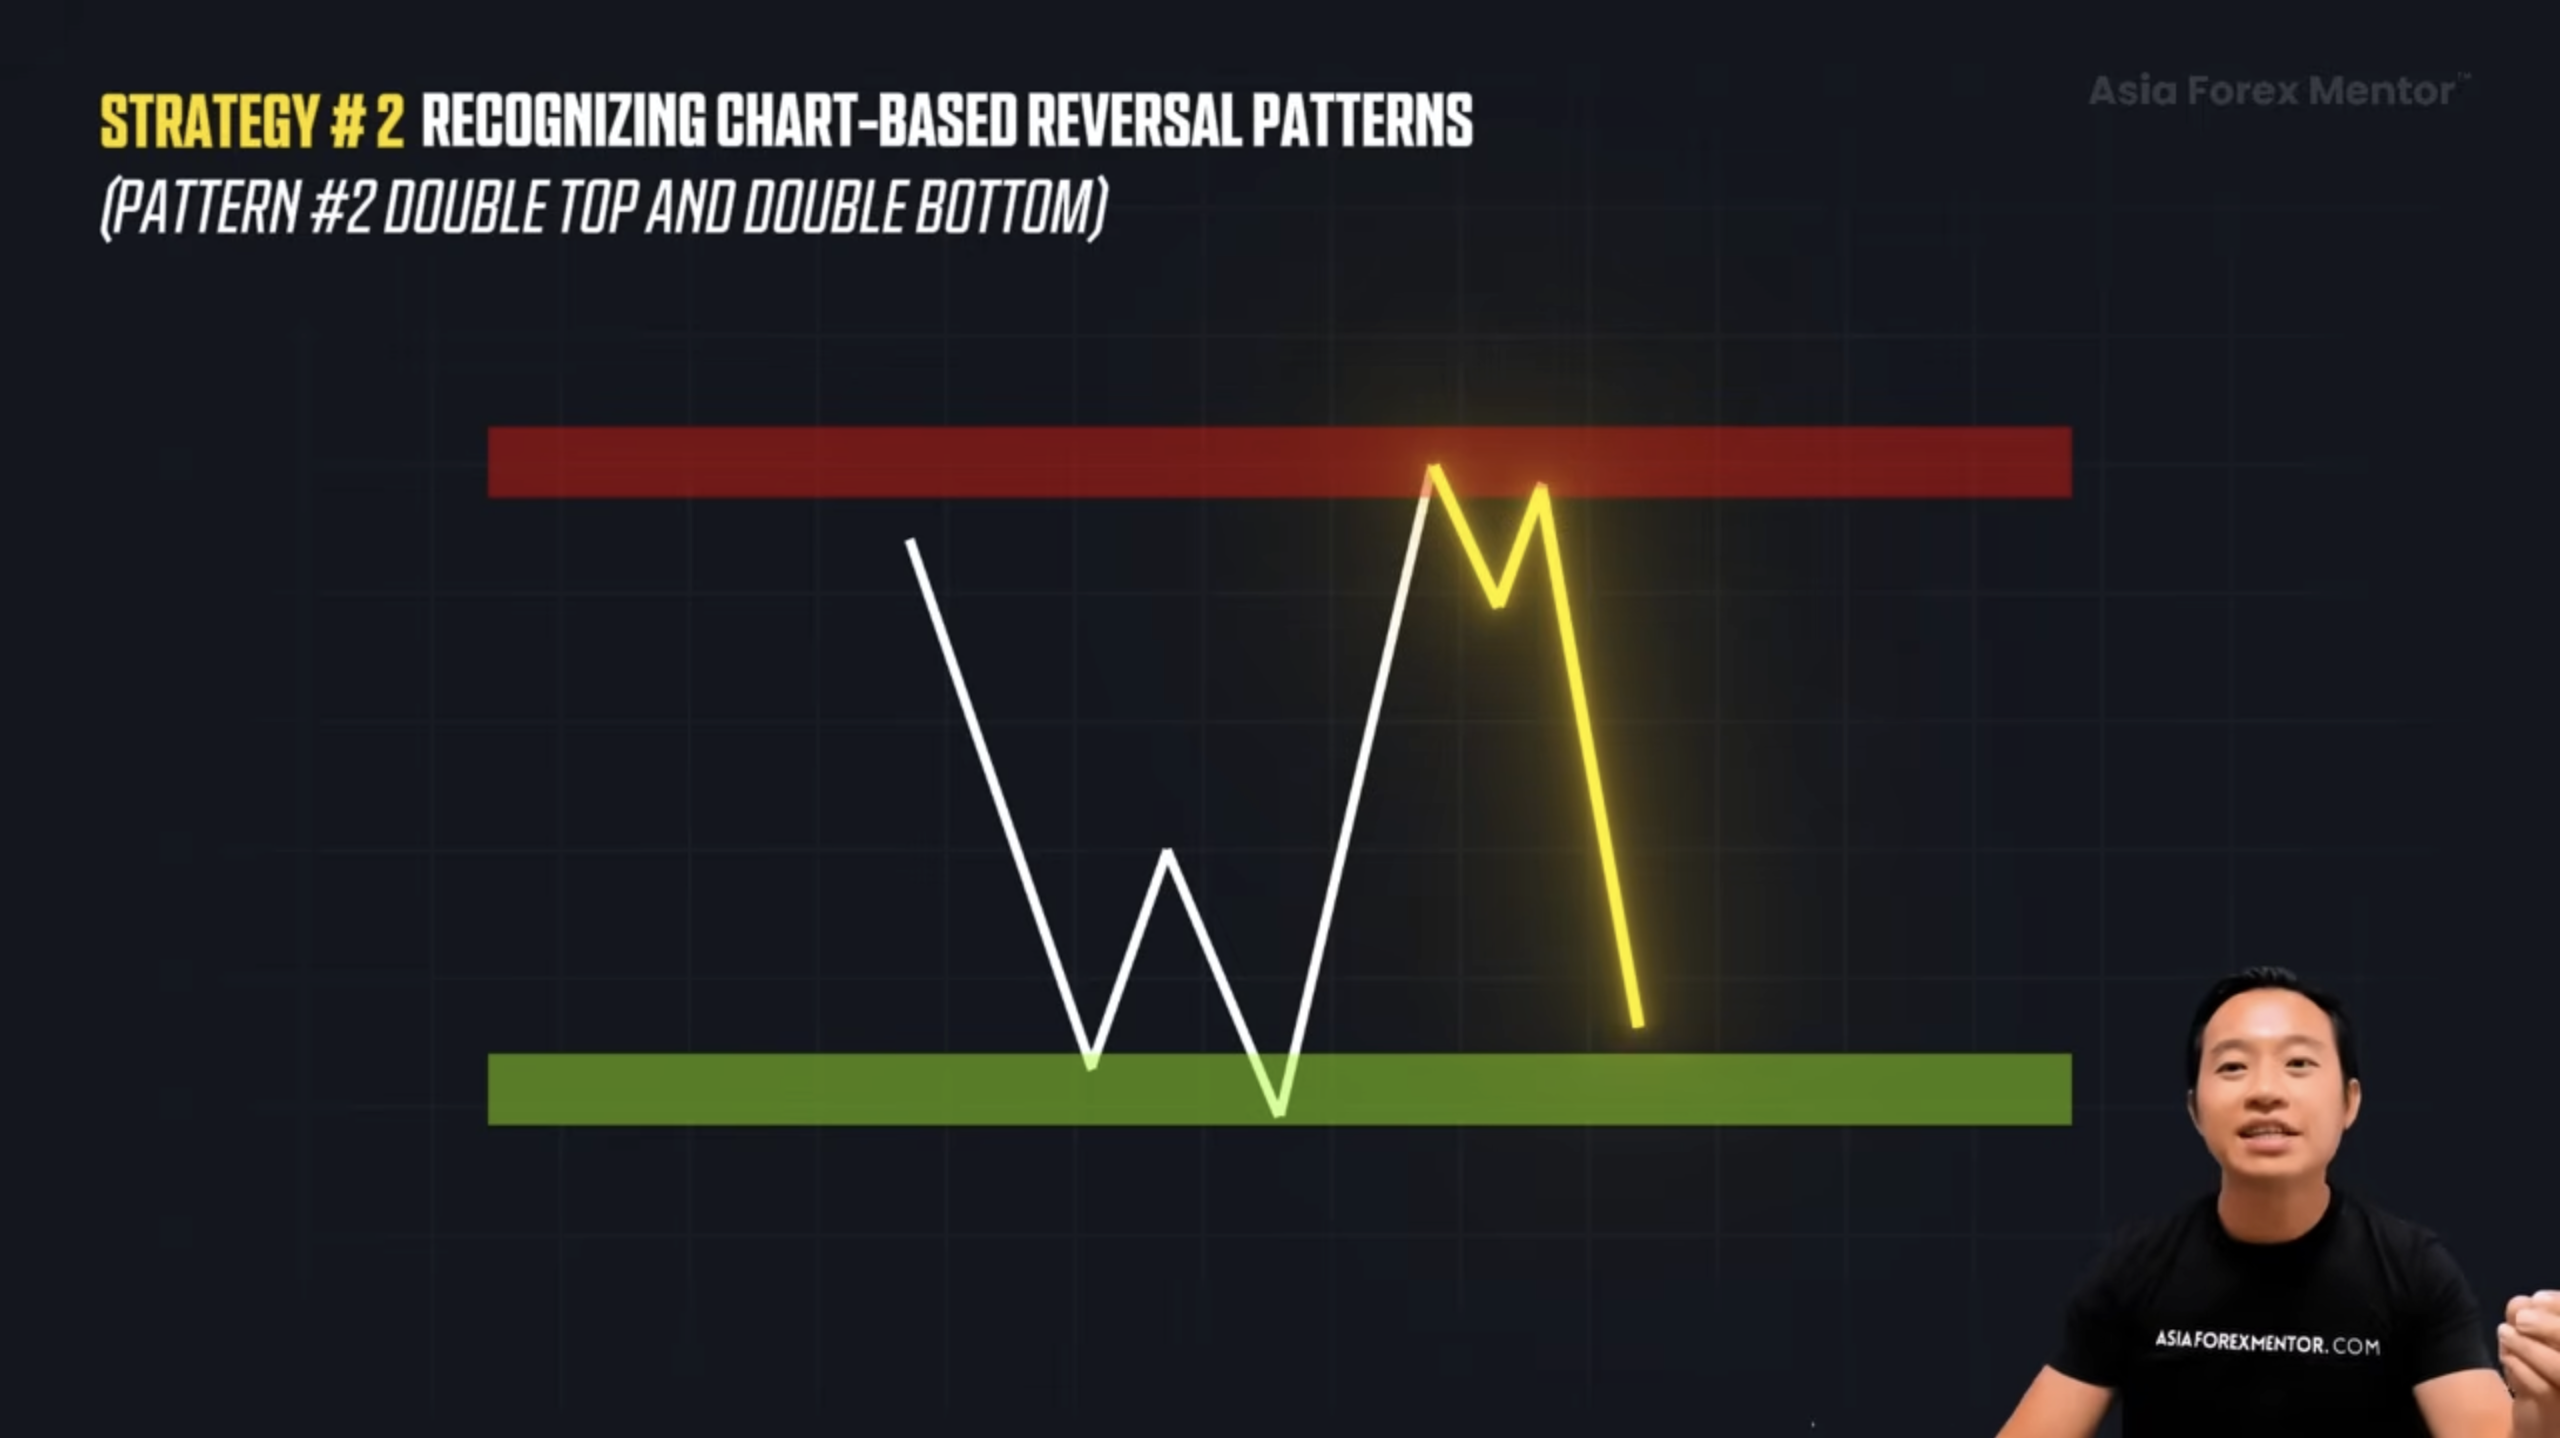
These are not instant entry signals. They confirm that a zone is valid. The better entry comes from rejection candles or minor structure breaks near that level.
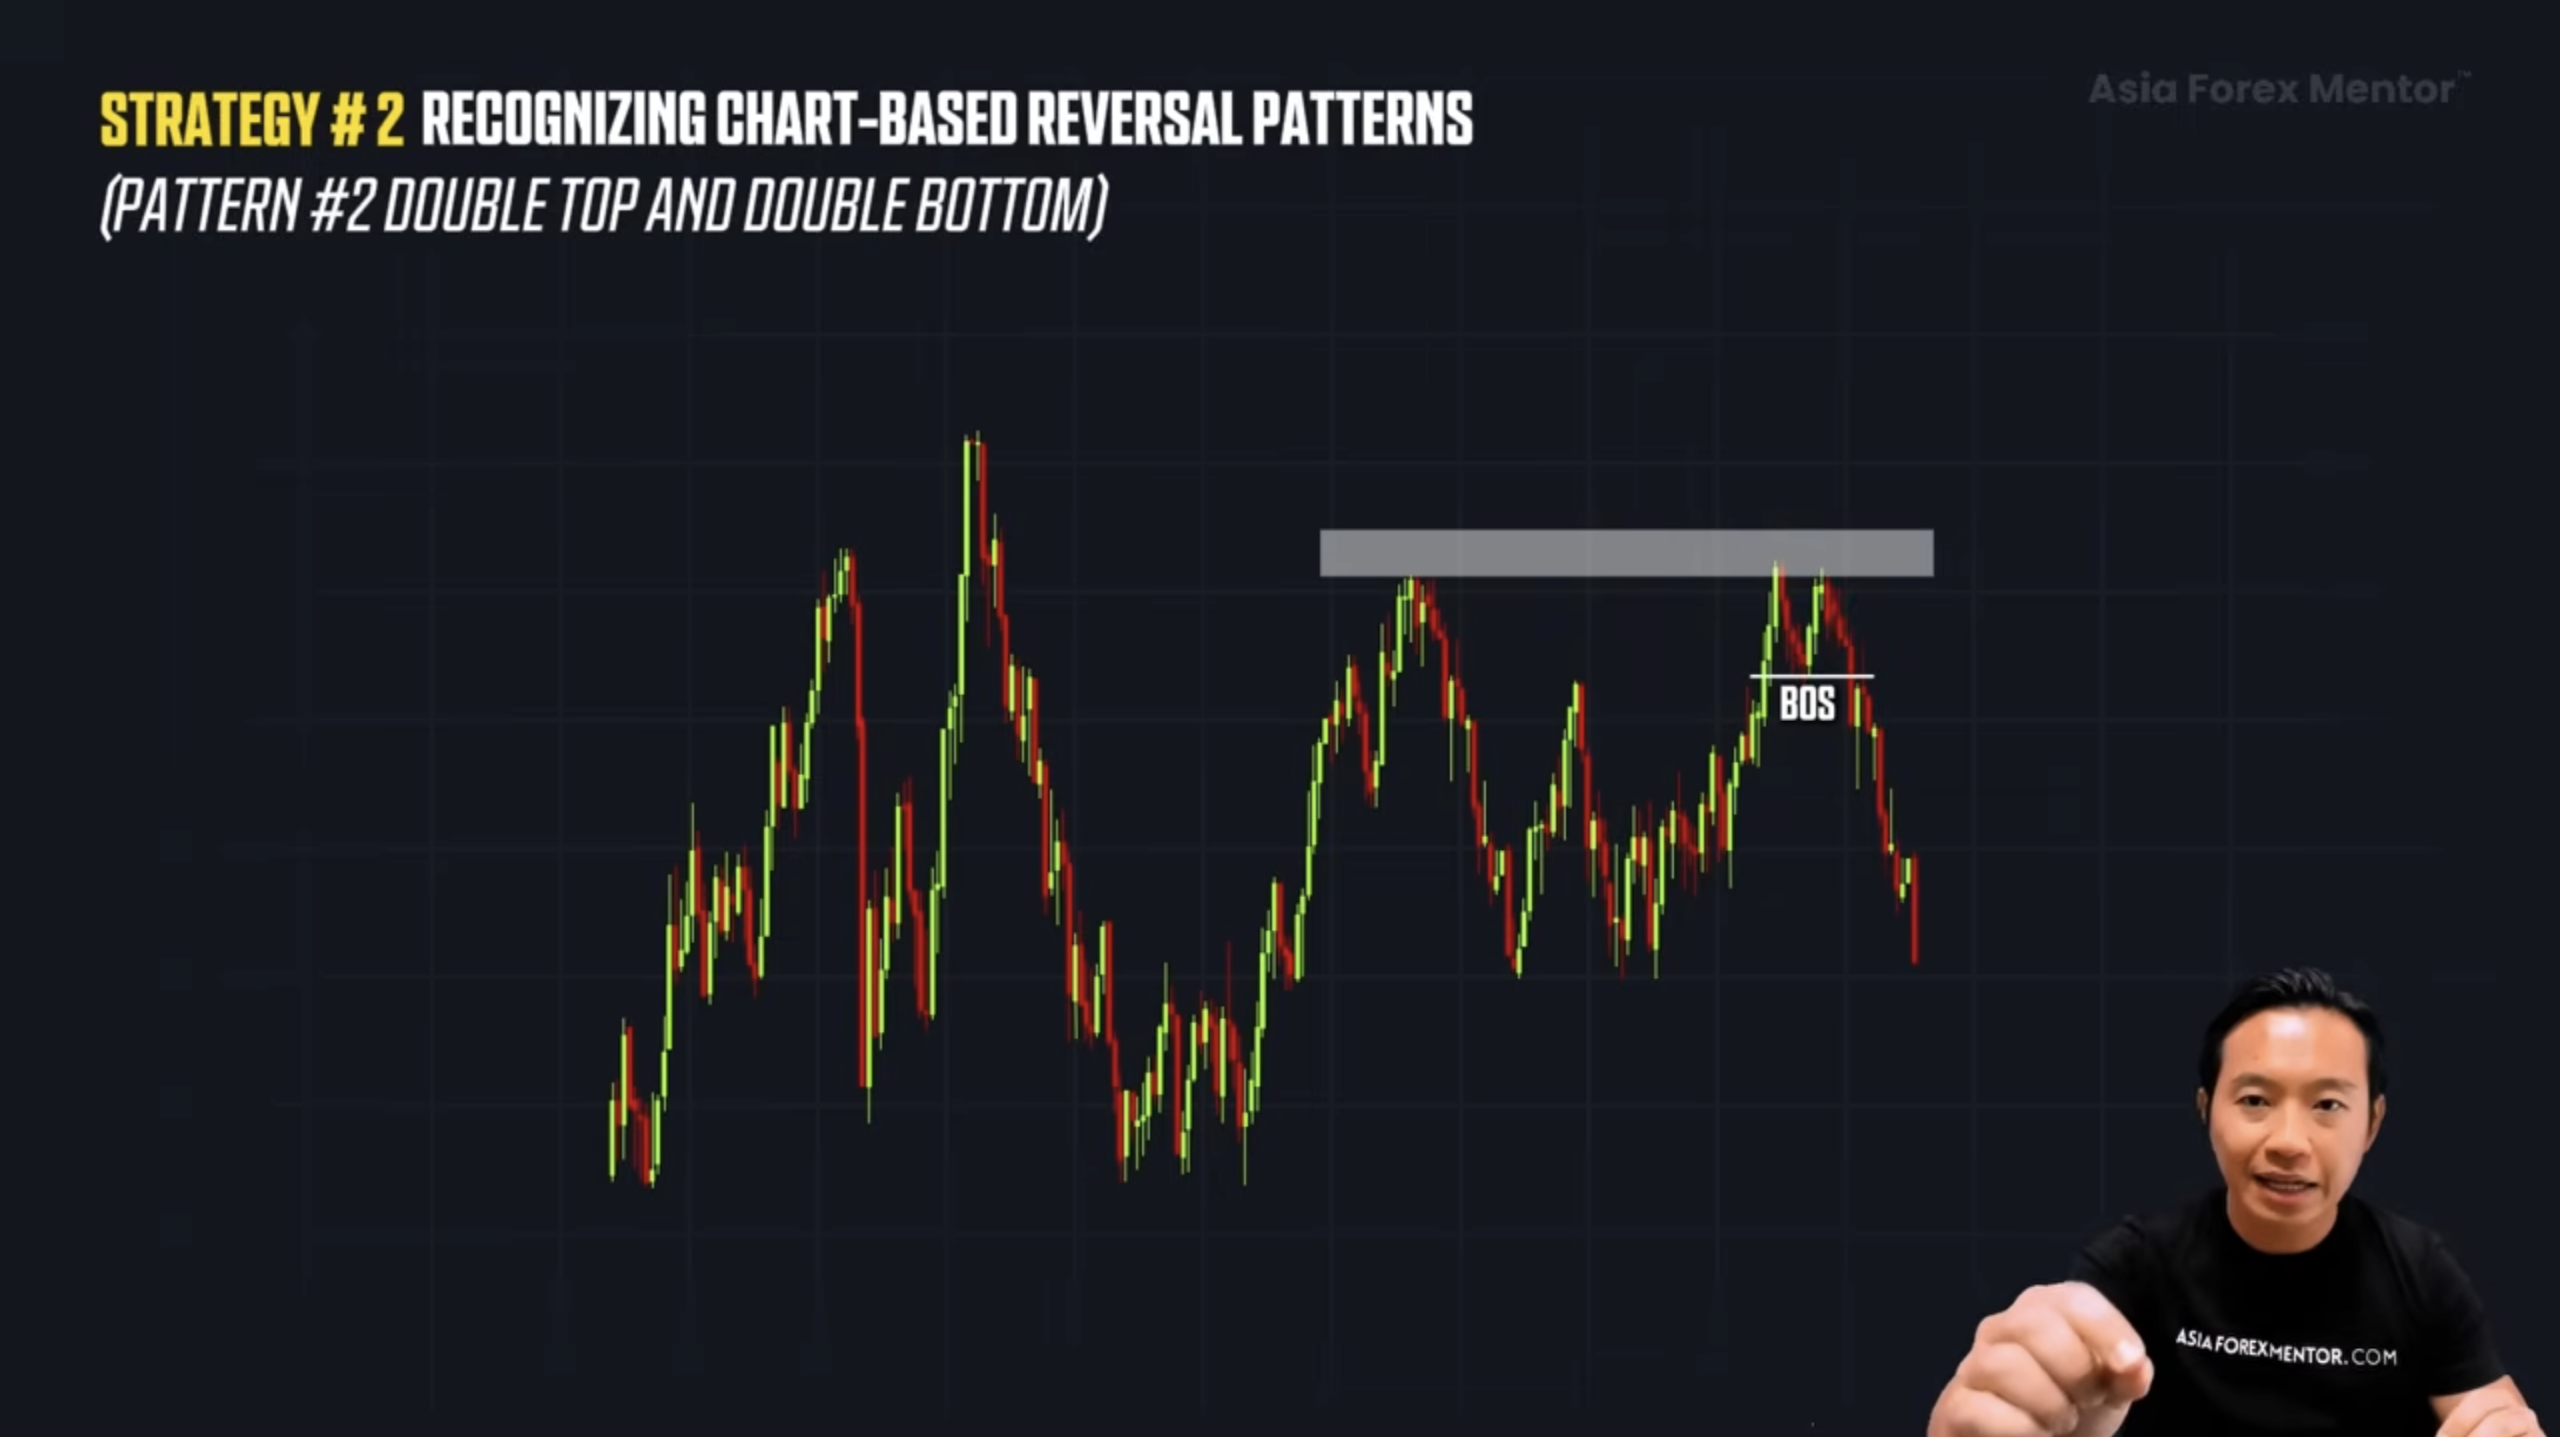
The third pattern is the Trendline Break. A clean trendline shows the rhythm of the trend. Higher lows or lower highs.
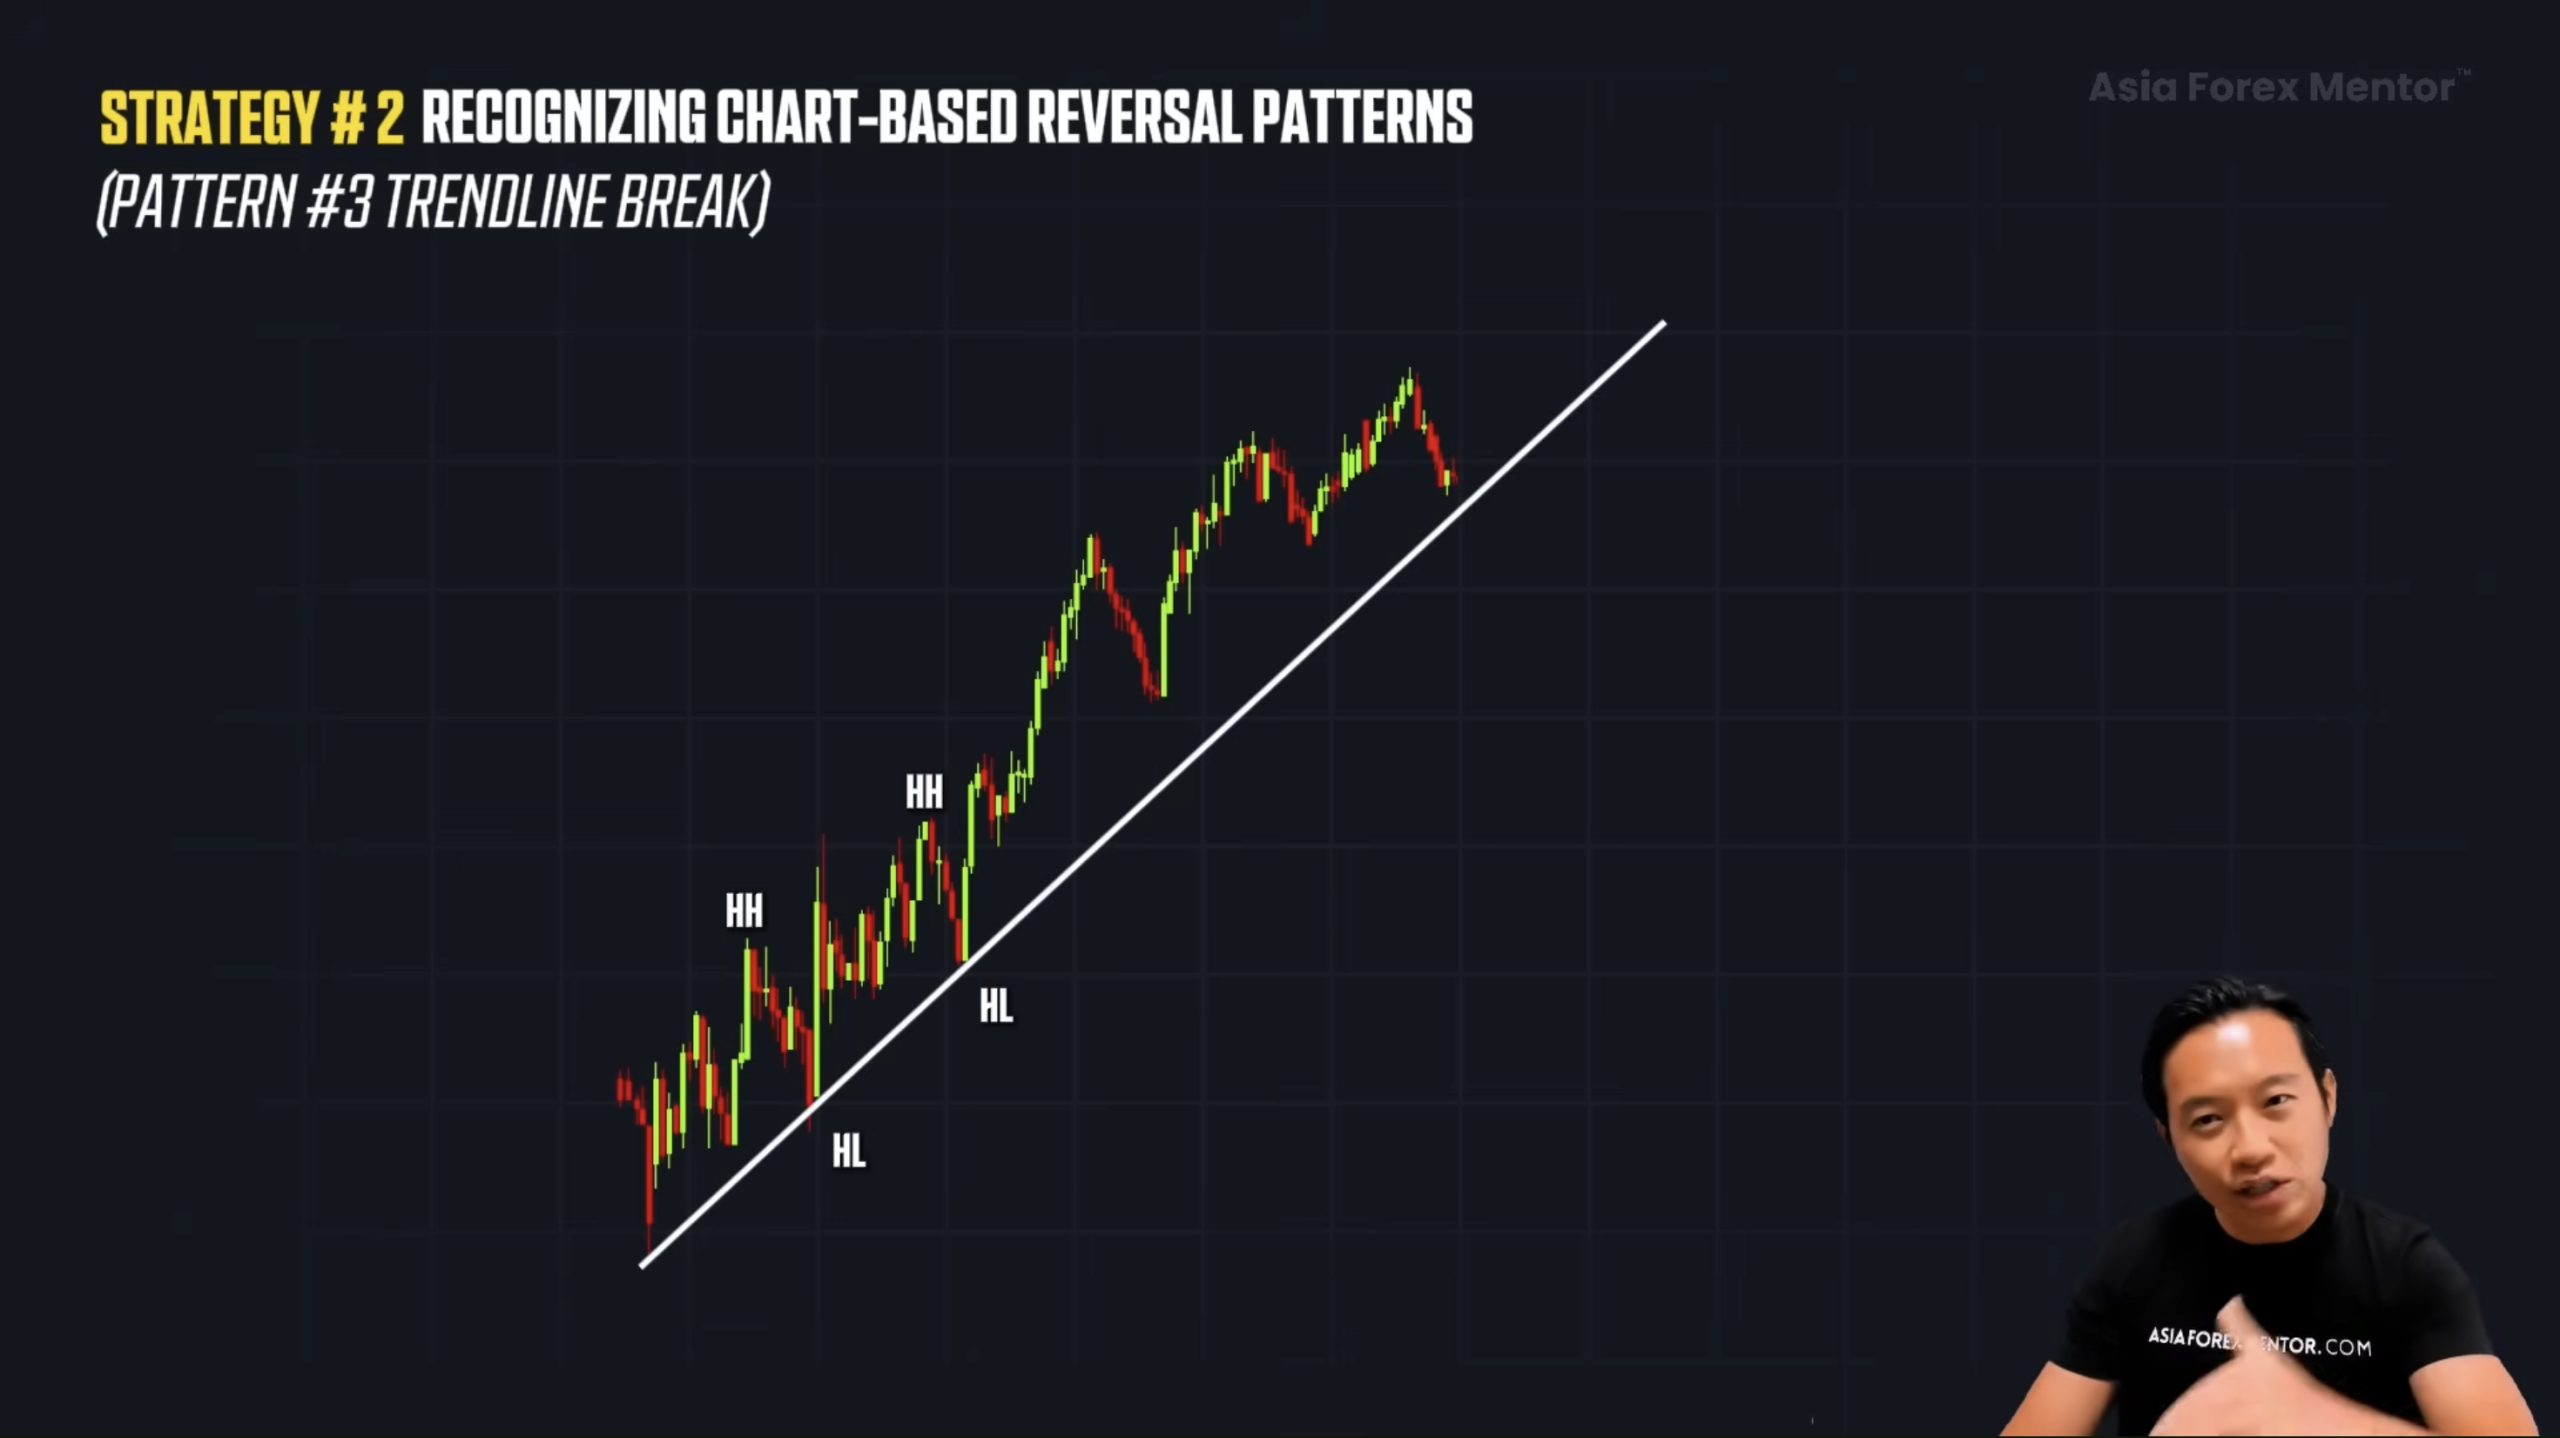
When that rhythm breaks, something has changed. Do not rush the entry. Price often retests the trendline before fully reversing.
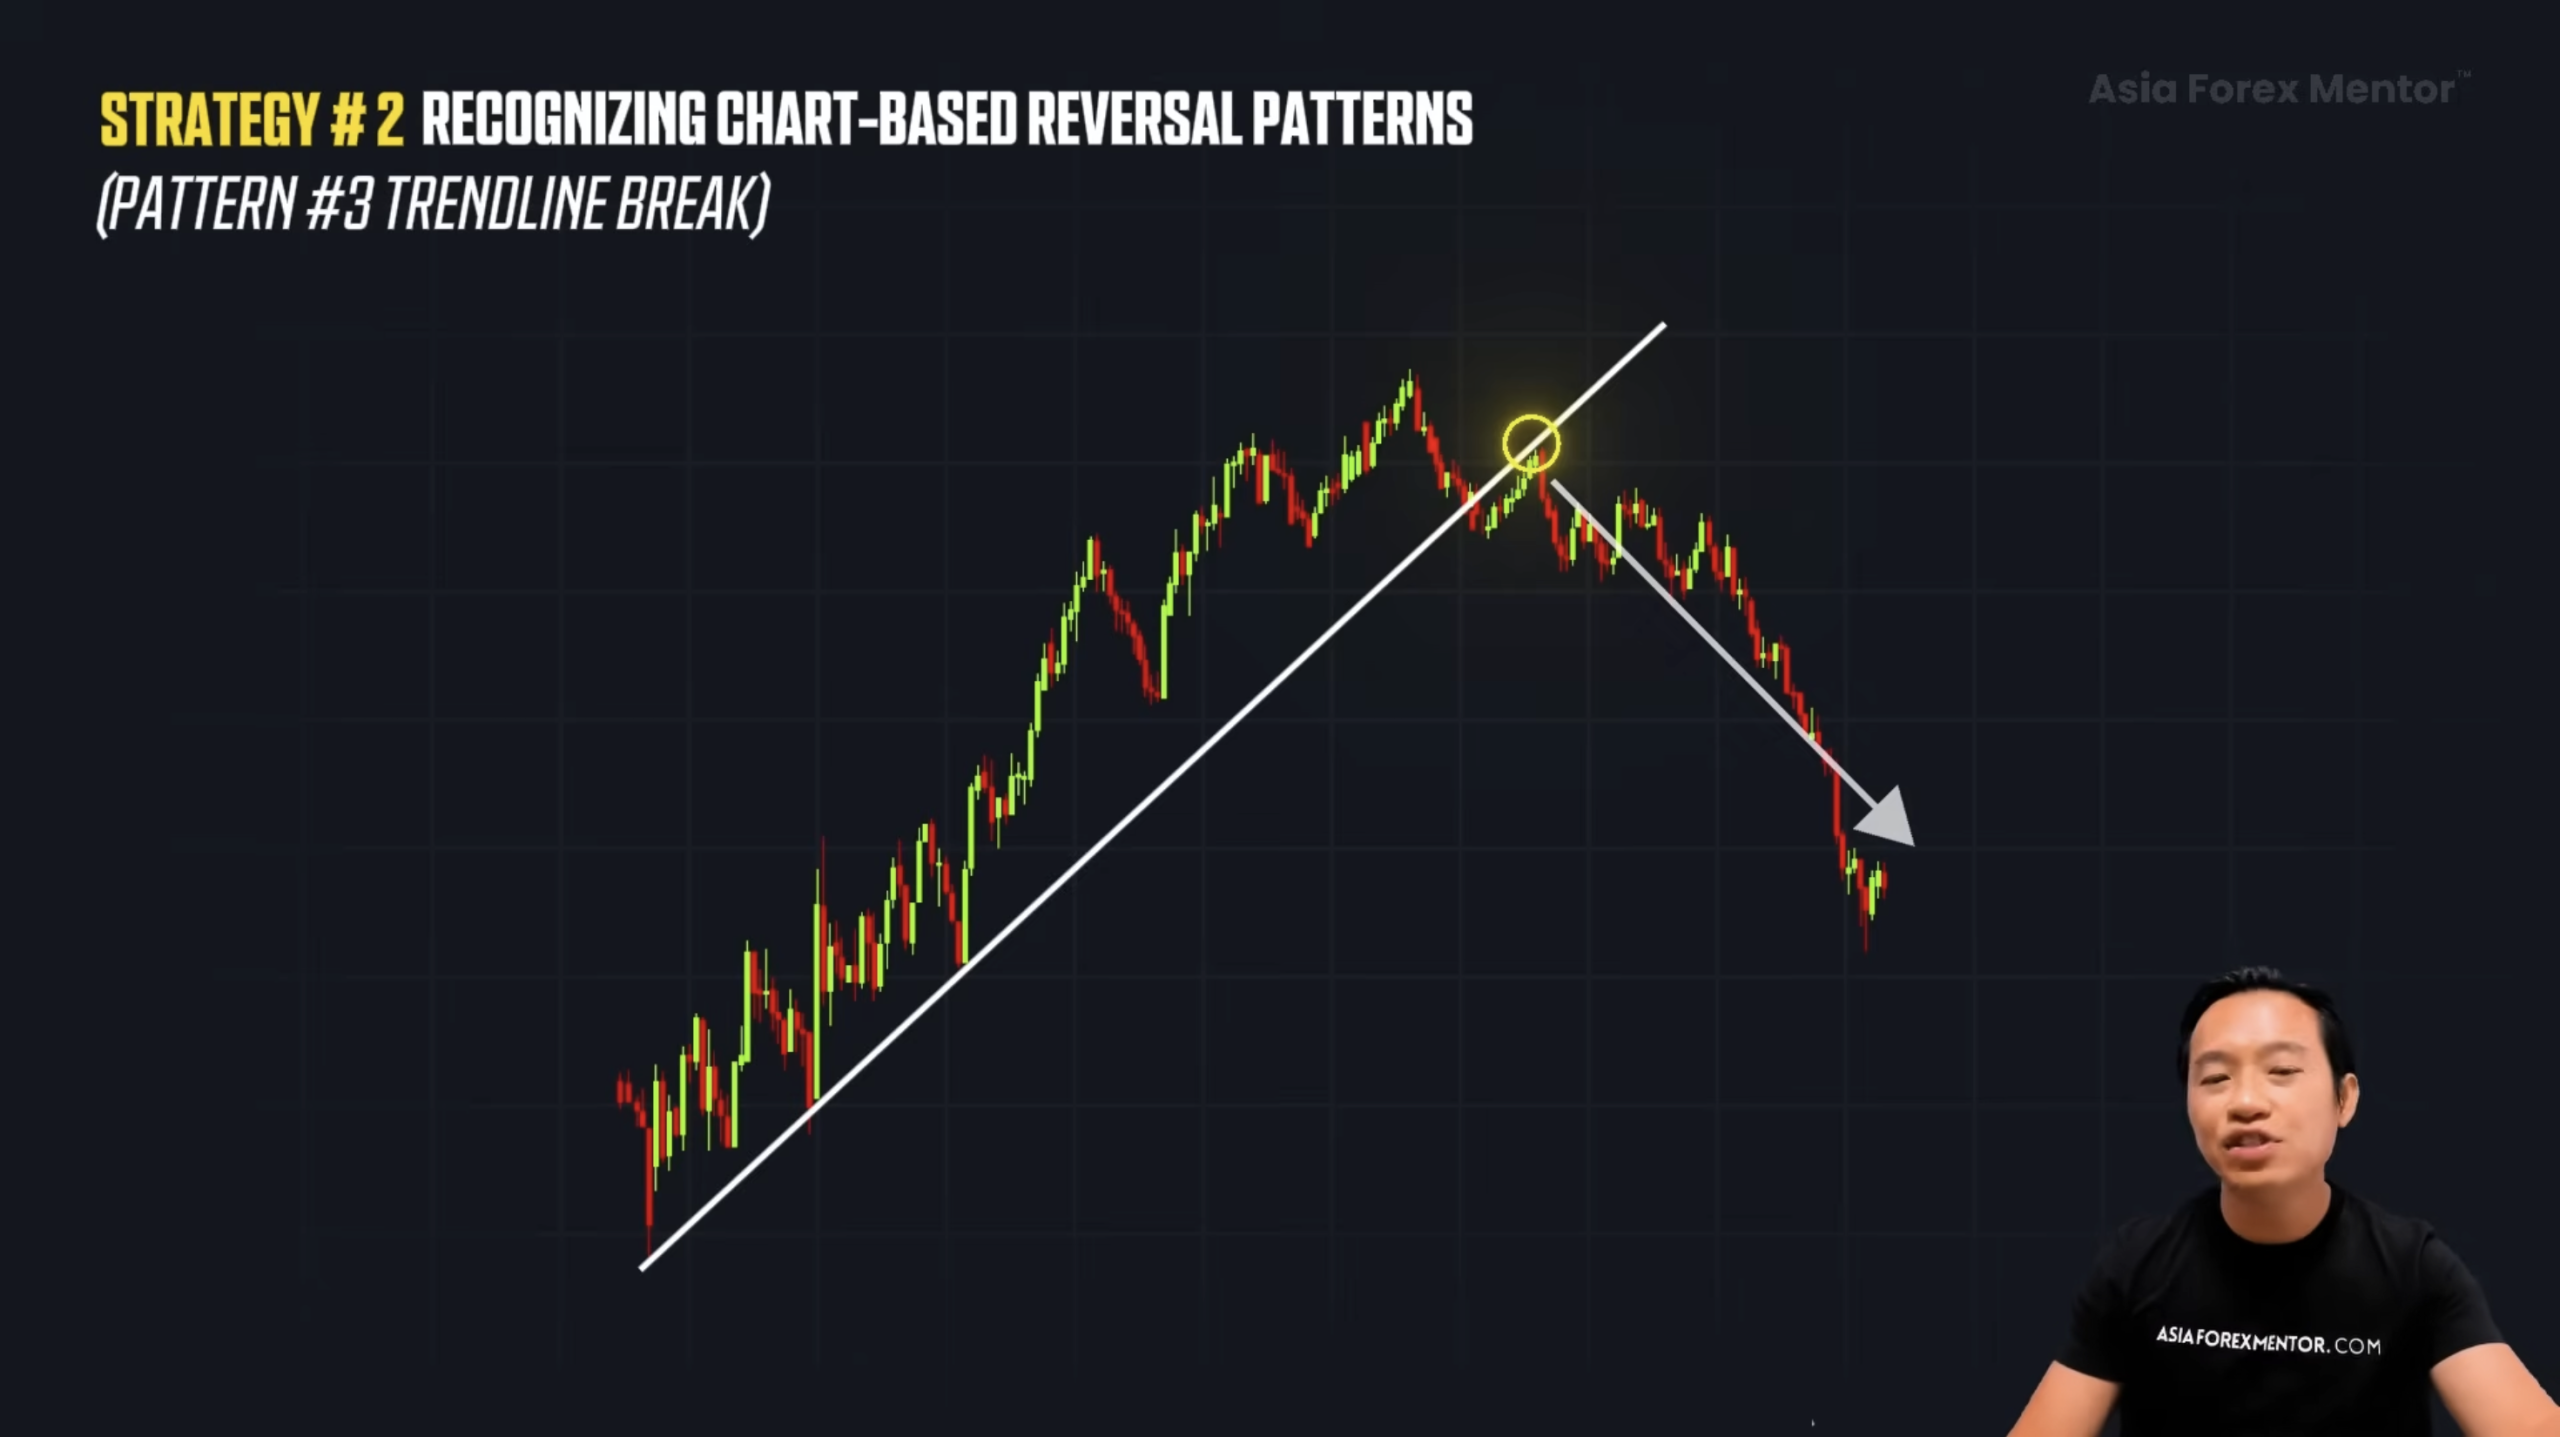
That retest offers a cleaner and safer entry. If it aligns with another pattern, like a head and shoulder patterns, that is high confidence.
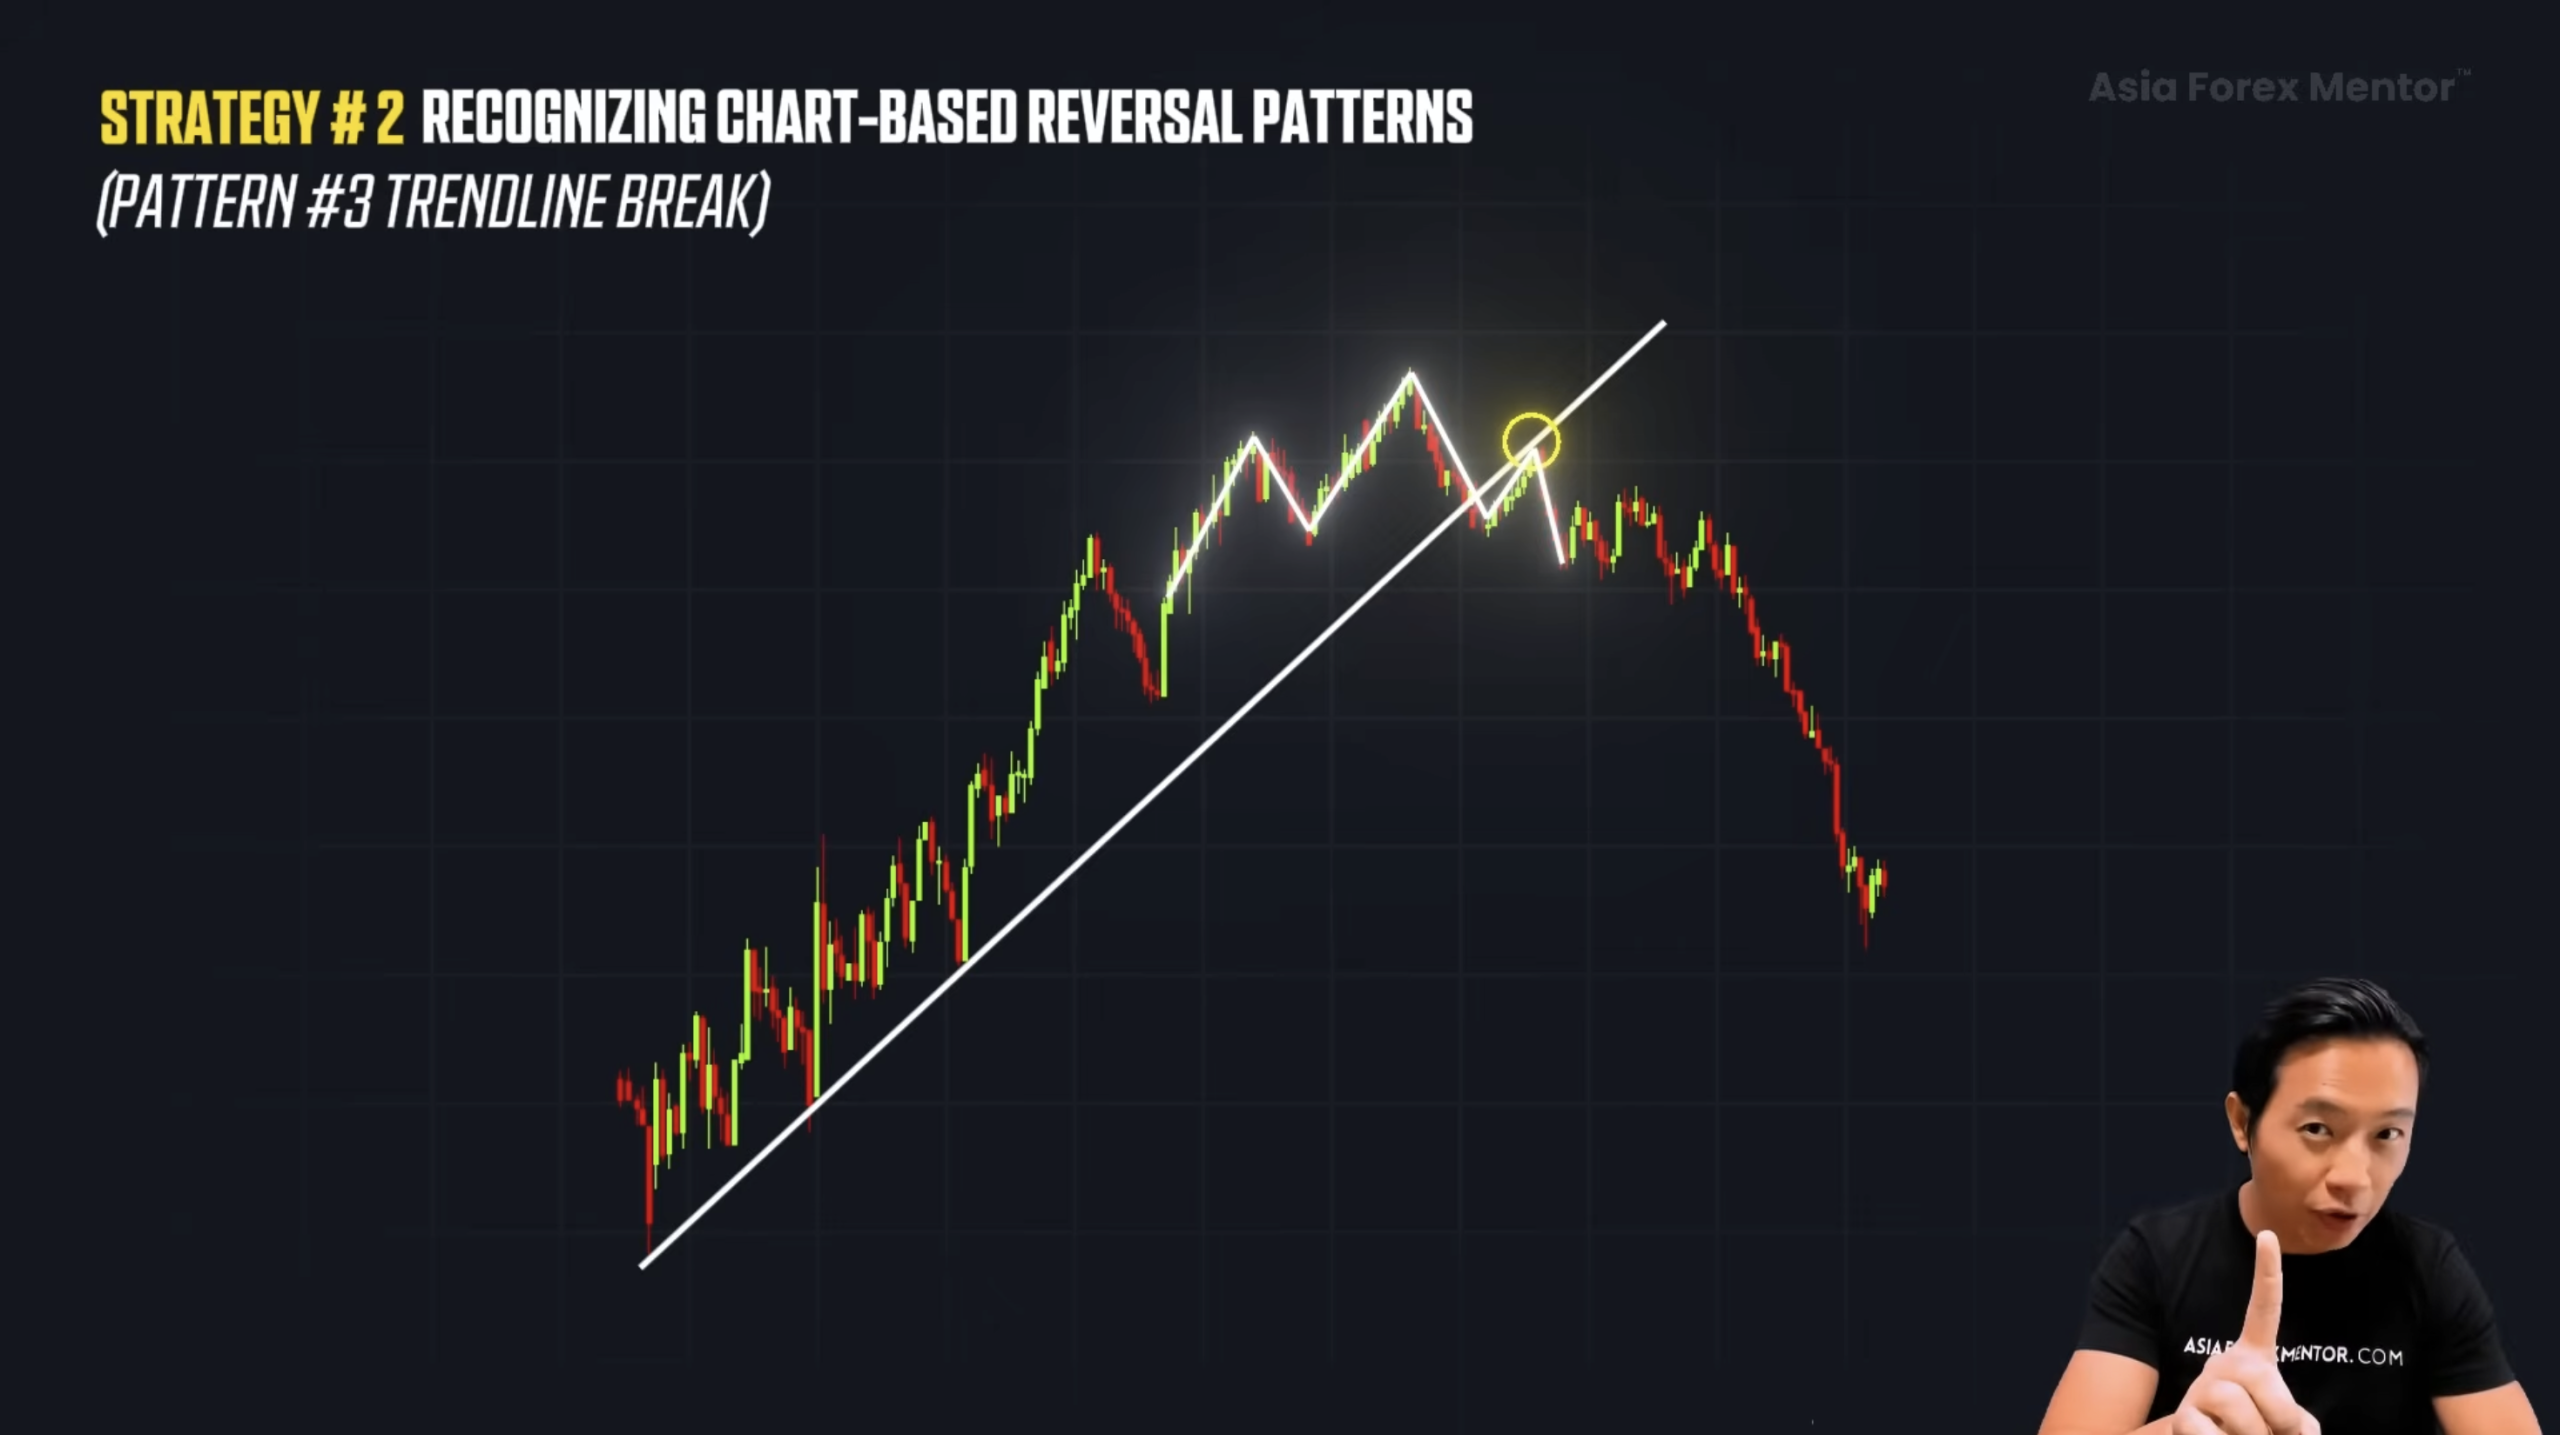
When multiple patterns appear together, that is confluence. The entire market bias is rotating.

Strategy 3: Combining Momentum and Confirmation Tools

When price, structure, and momentum align, that is your green light.

Reversals do not always come from breakdowns. Sometimes they come from rejections.

Start with a clean key level. Do not assume it will reverse immediately. That is where the Stochastic comes in. When Stochastic shows overbought at resistance, that is your first clue.
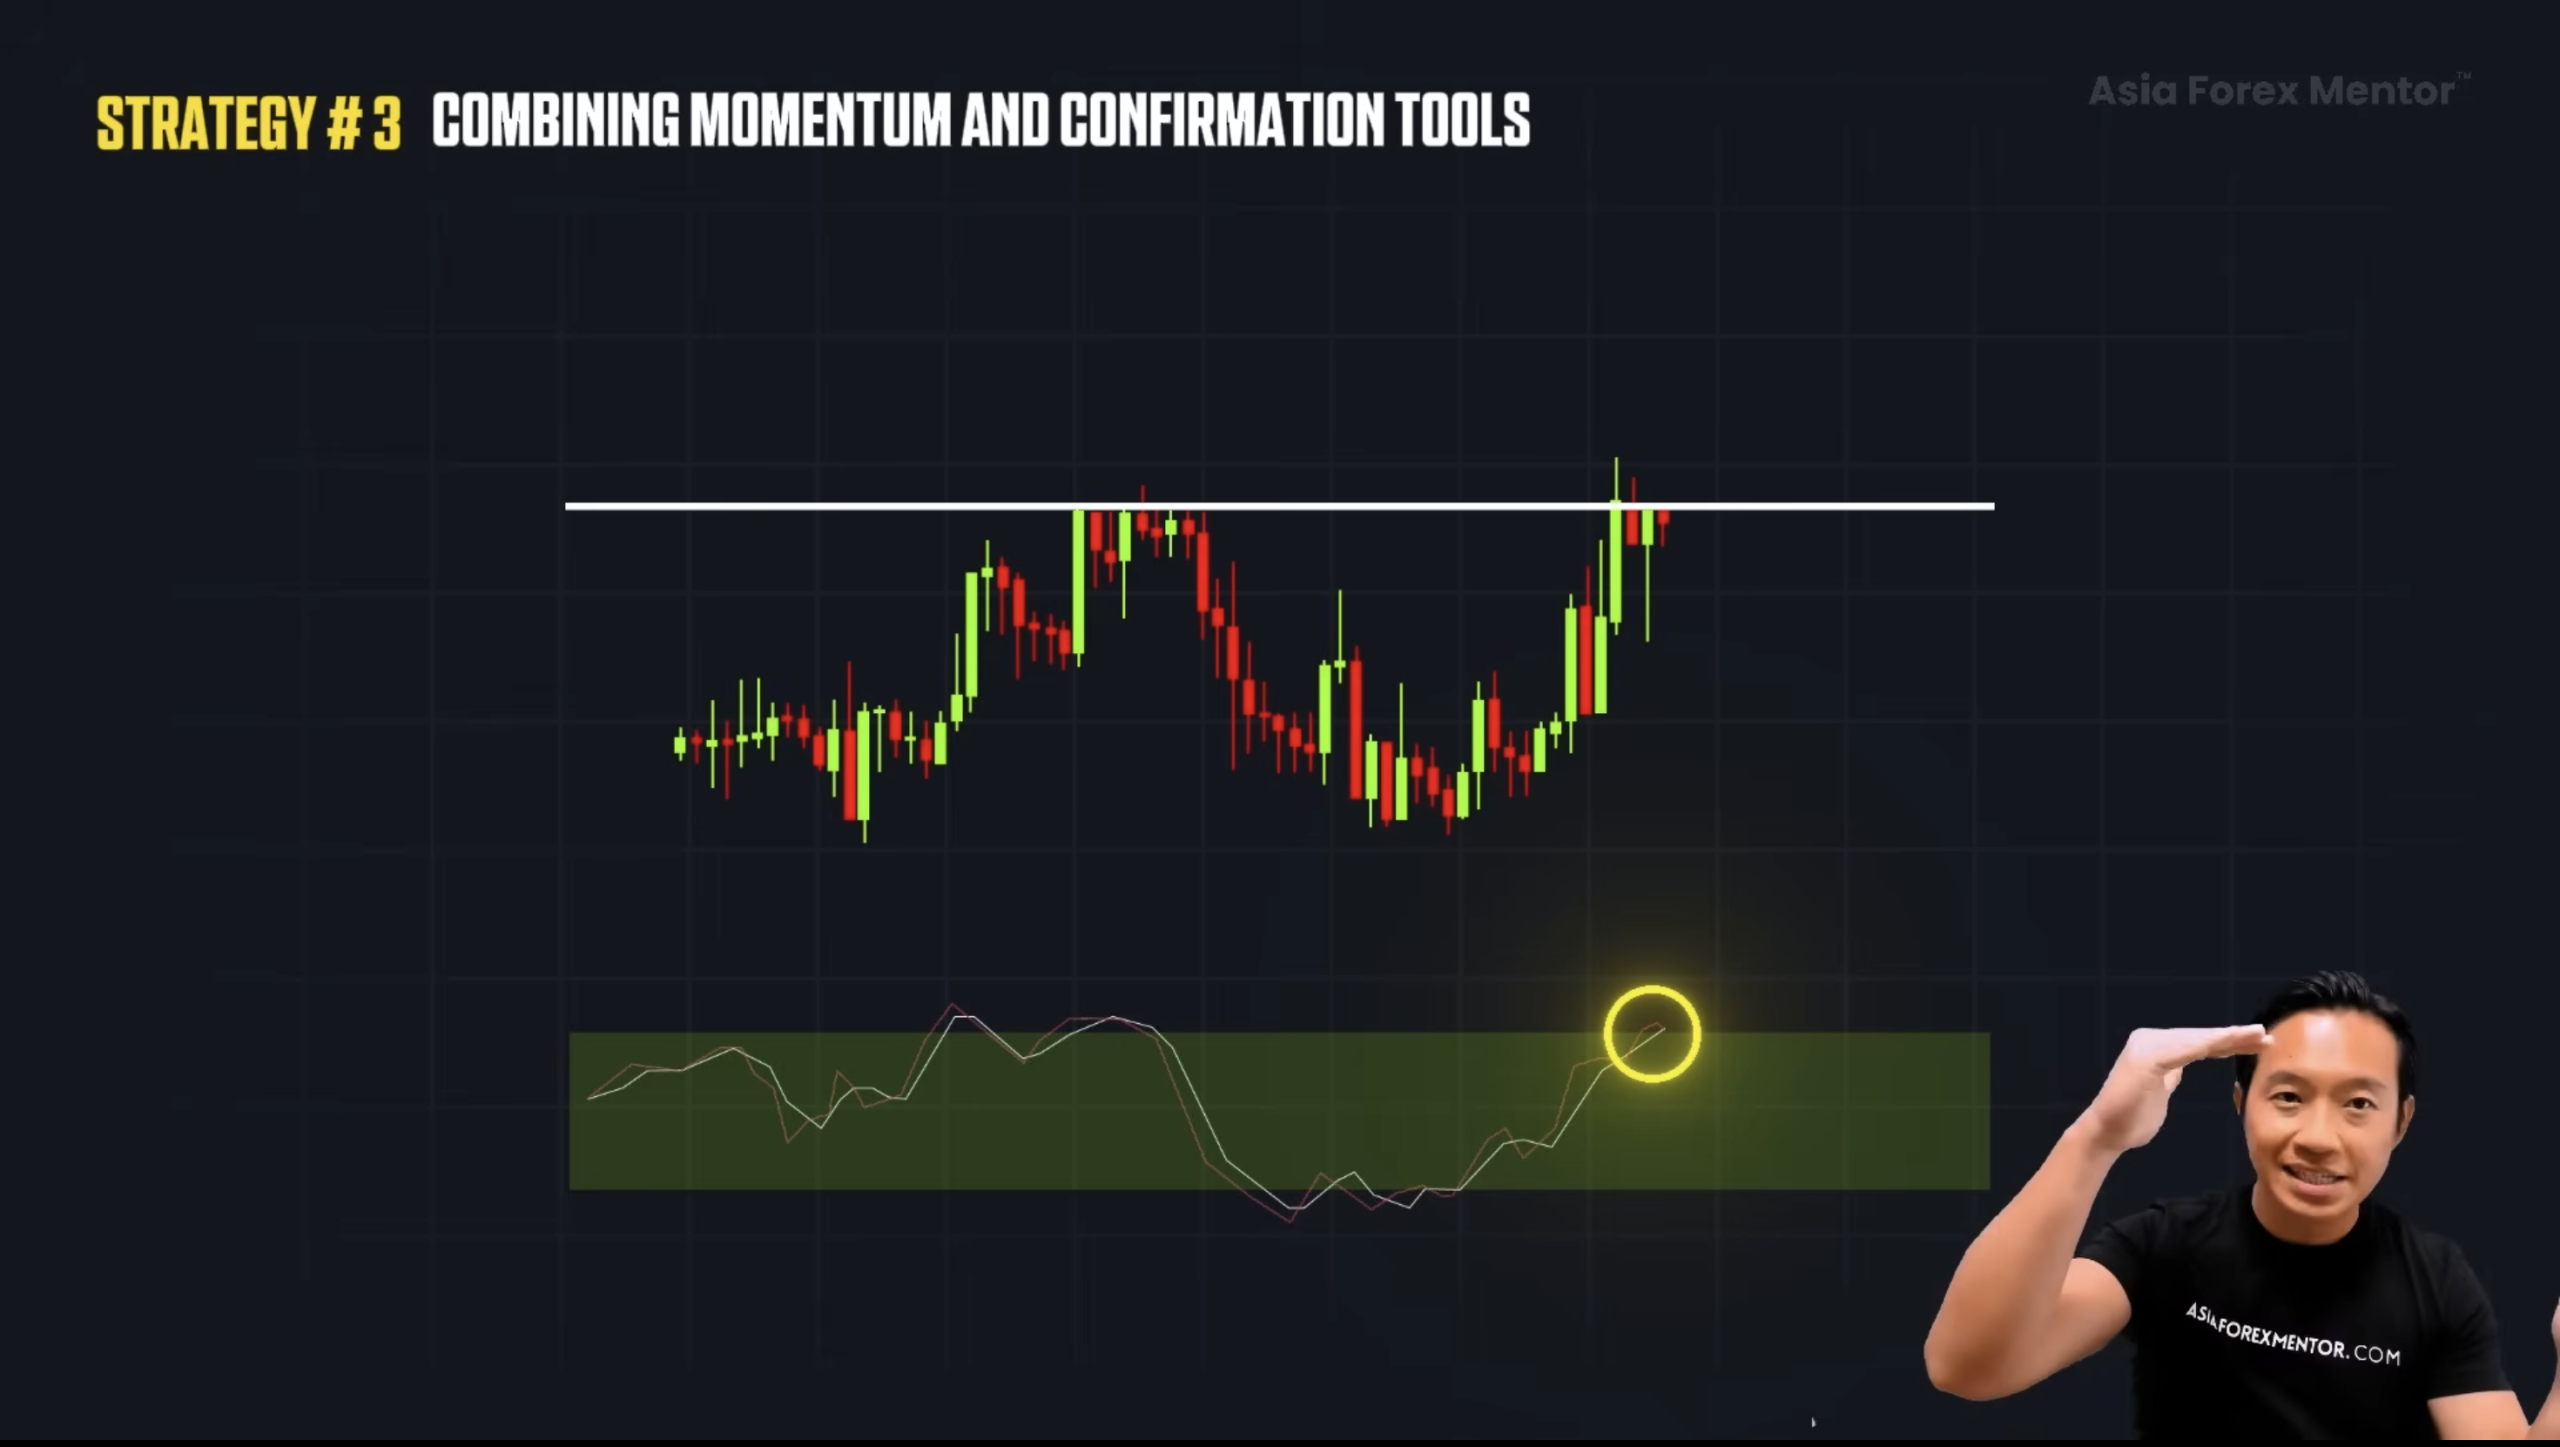
Not your entry yet.

Wait for the Stochastic lines to cross back down. That cross confirms momentum has shifted. If you short, keep it clean. Stop loss just above the level. Target the next rejection with at least 1:2 risk-to-reward.
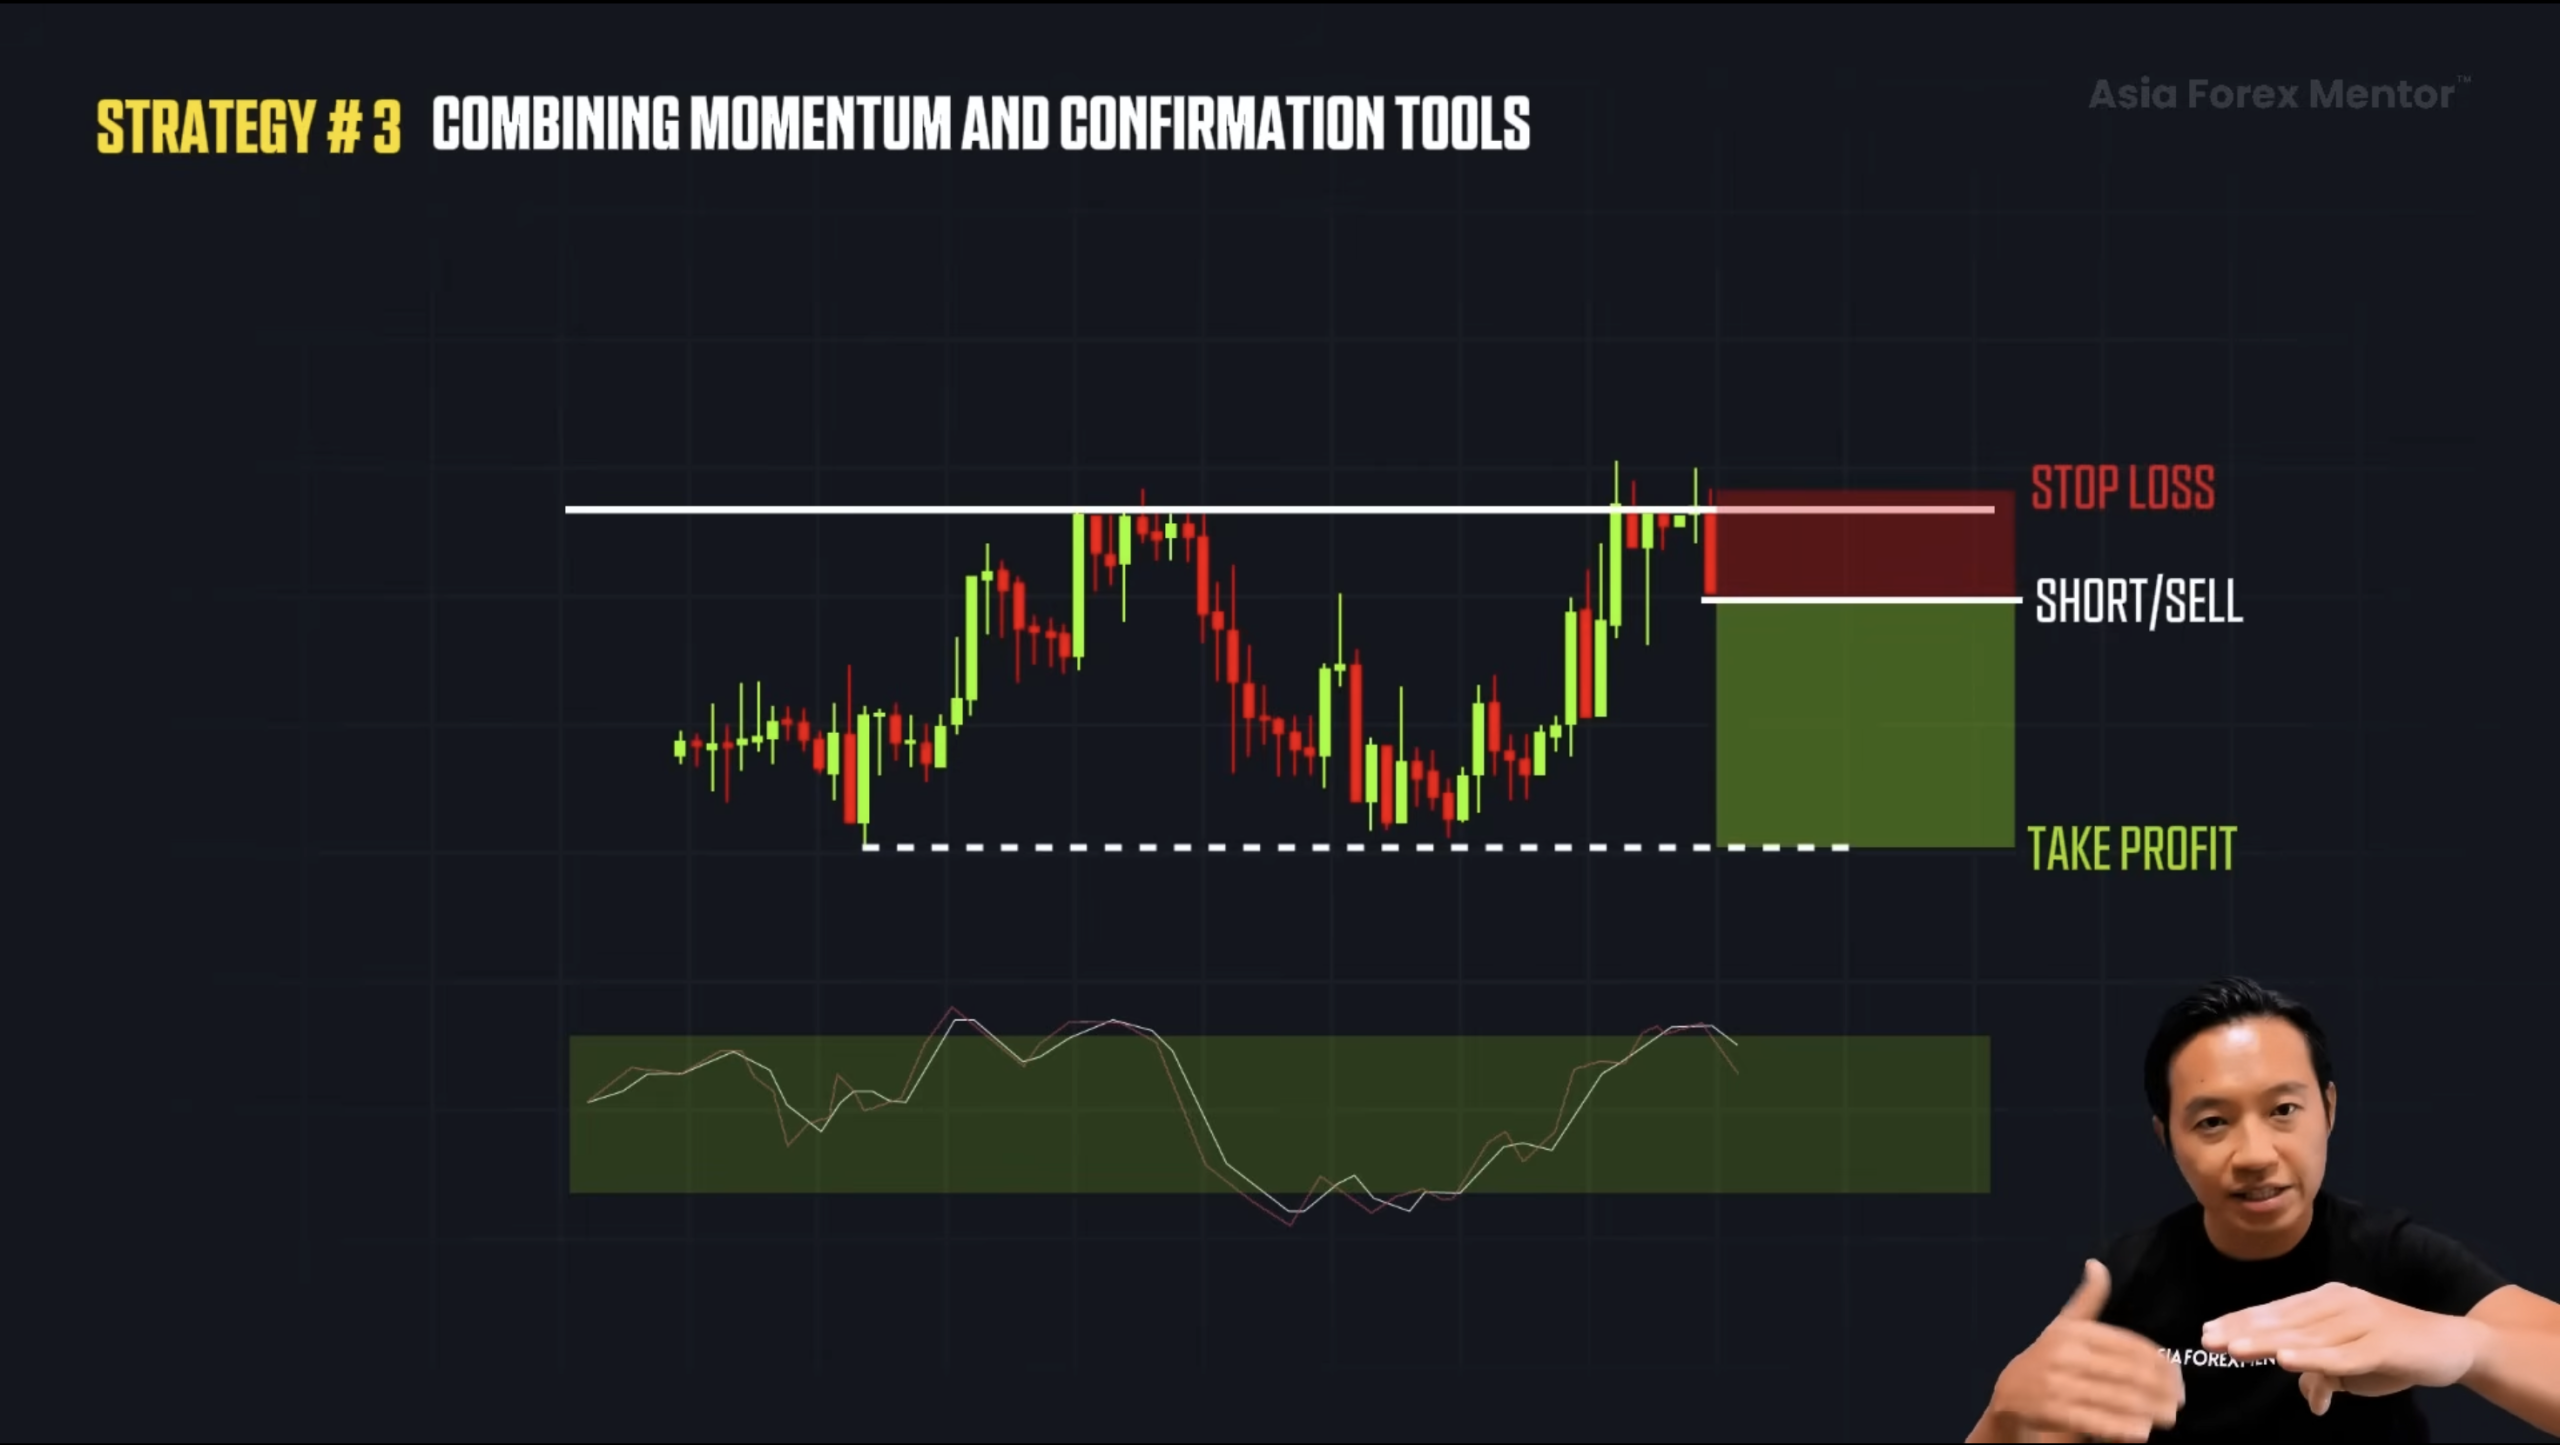
Now add the EMA layer. Use the 10 and 20 EMA as a visual filter.
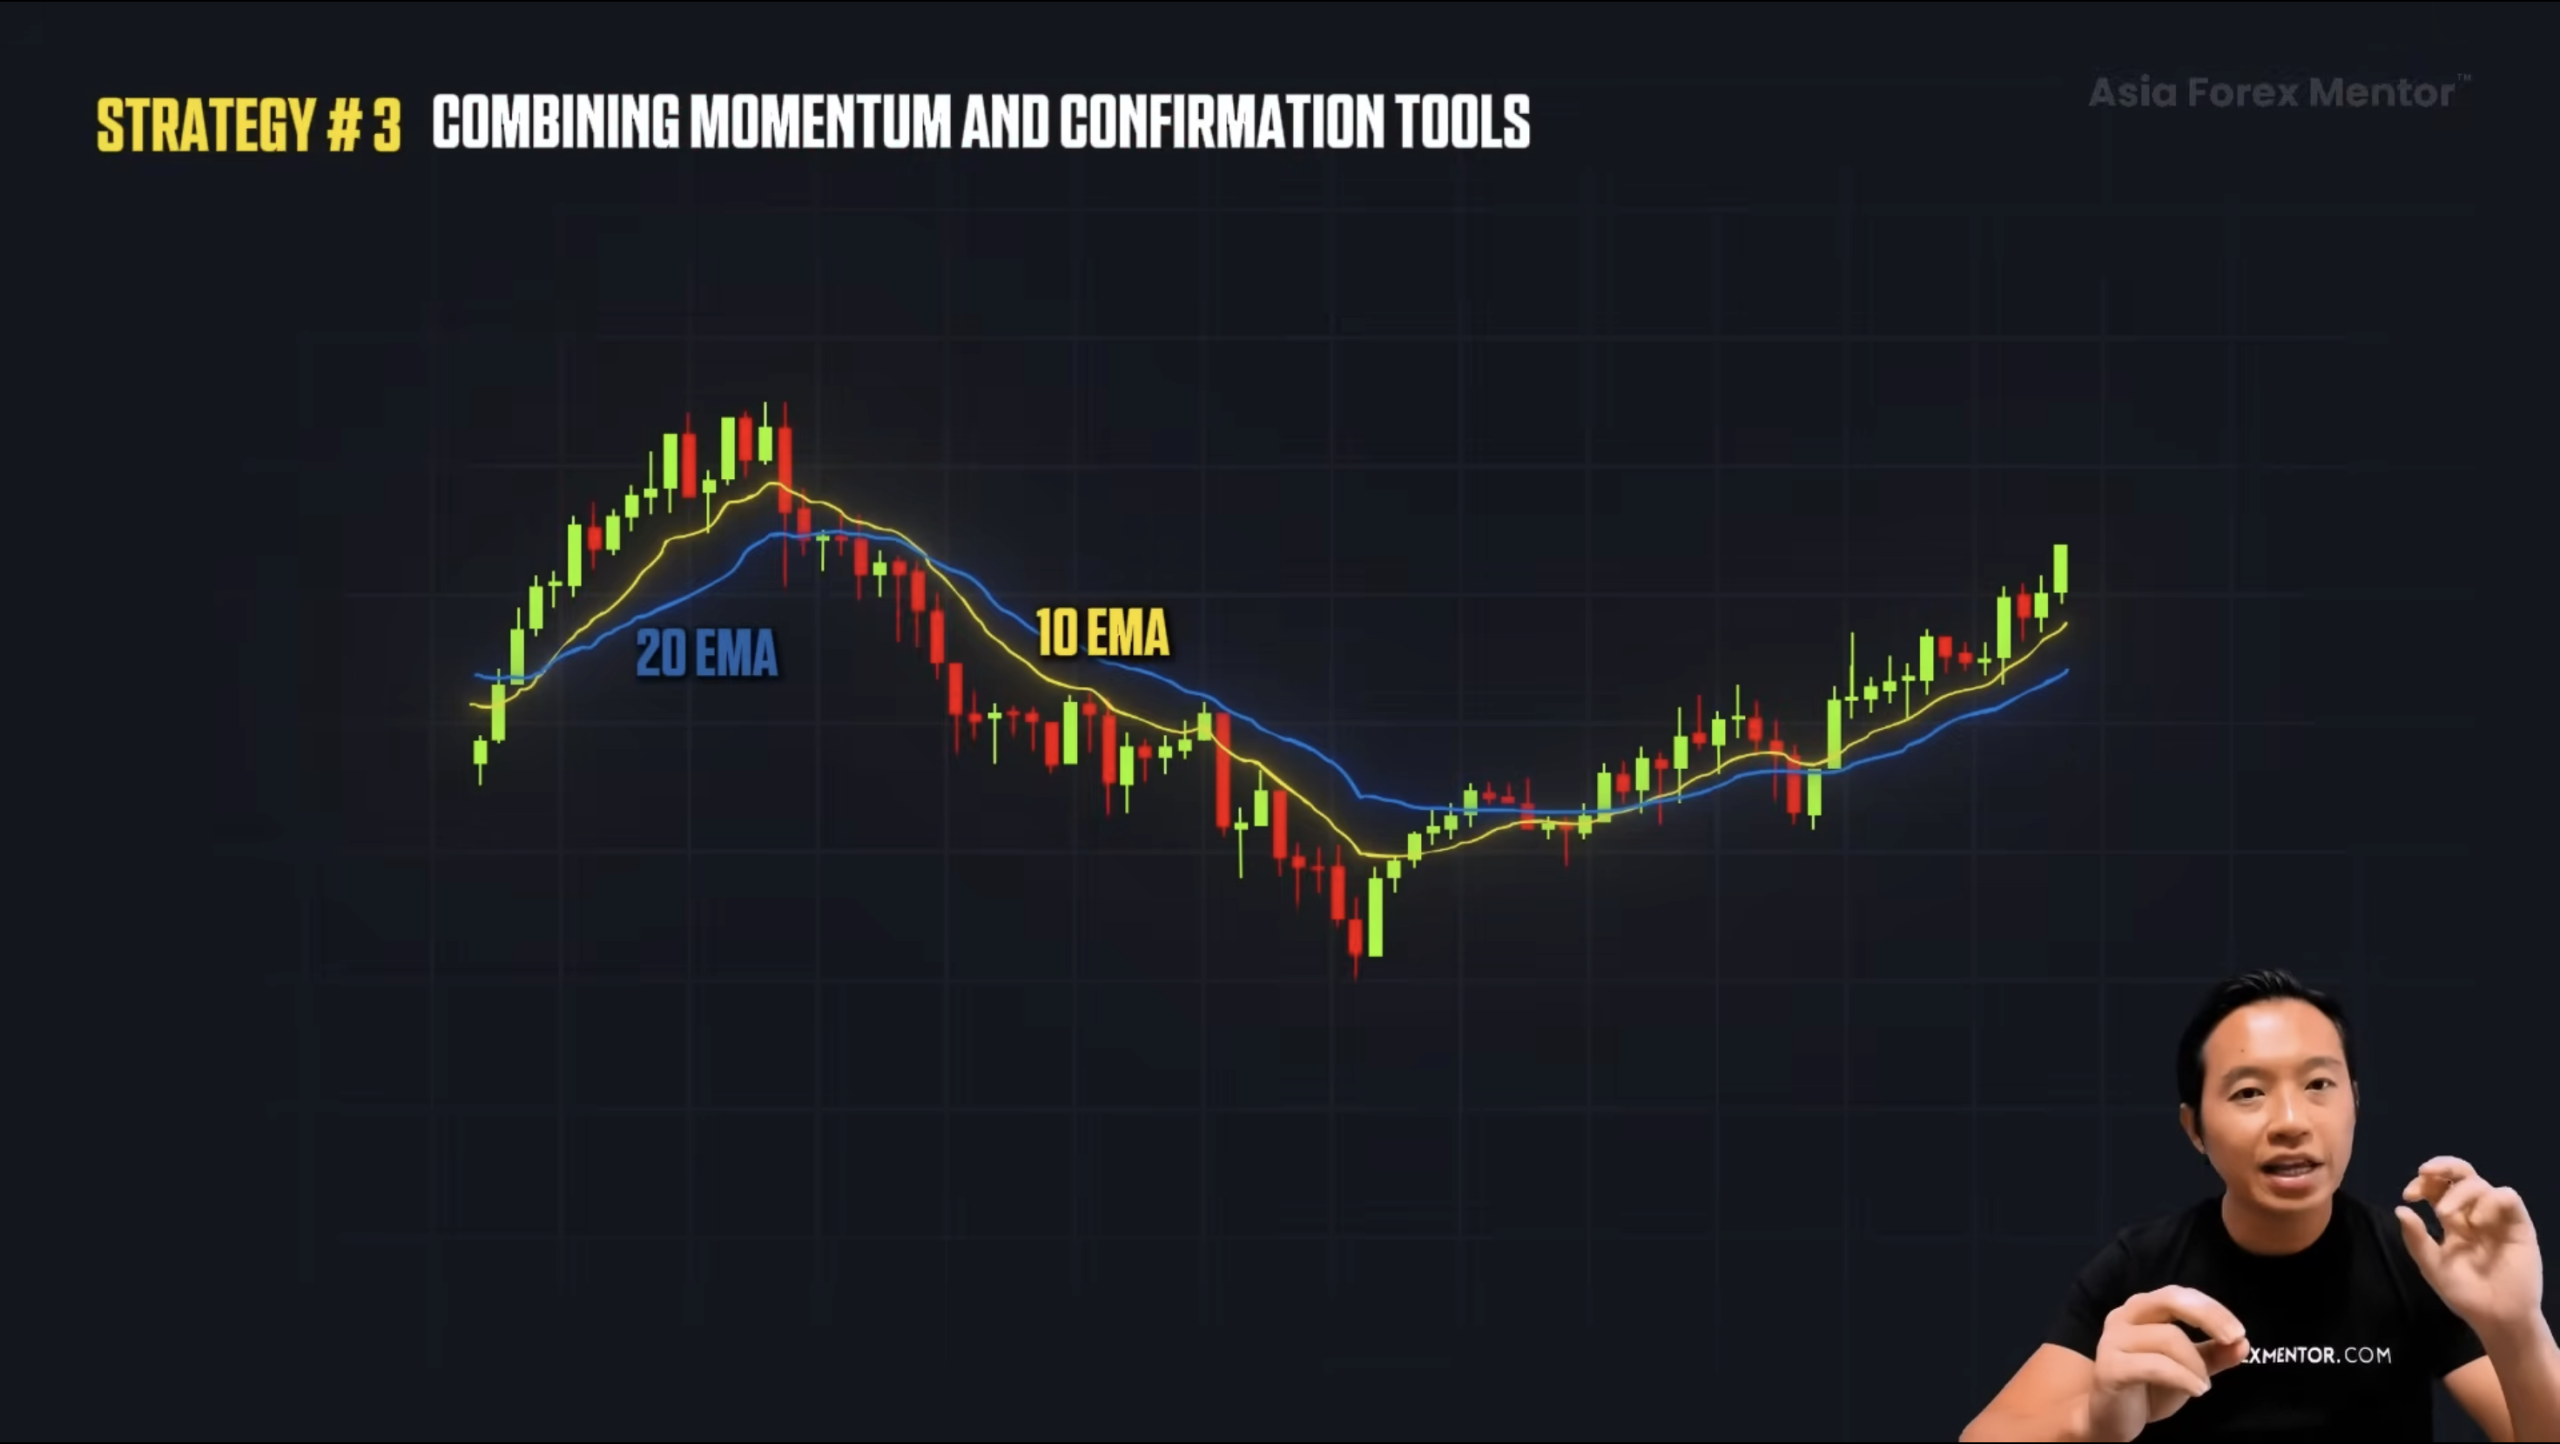
When the 10 crosses below the 20 near resistance, structure and momentum agree.
This filters false reversals.
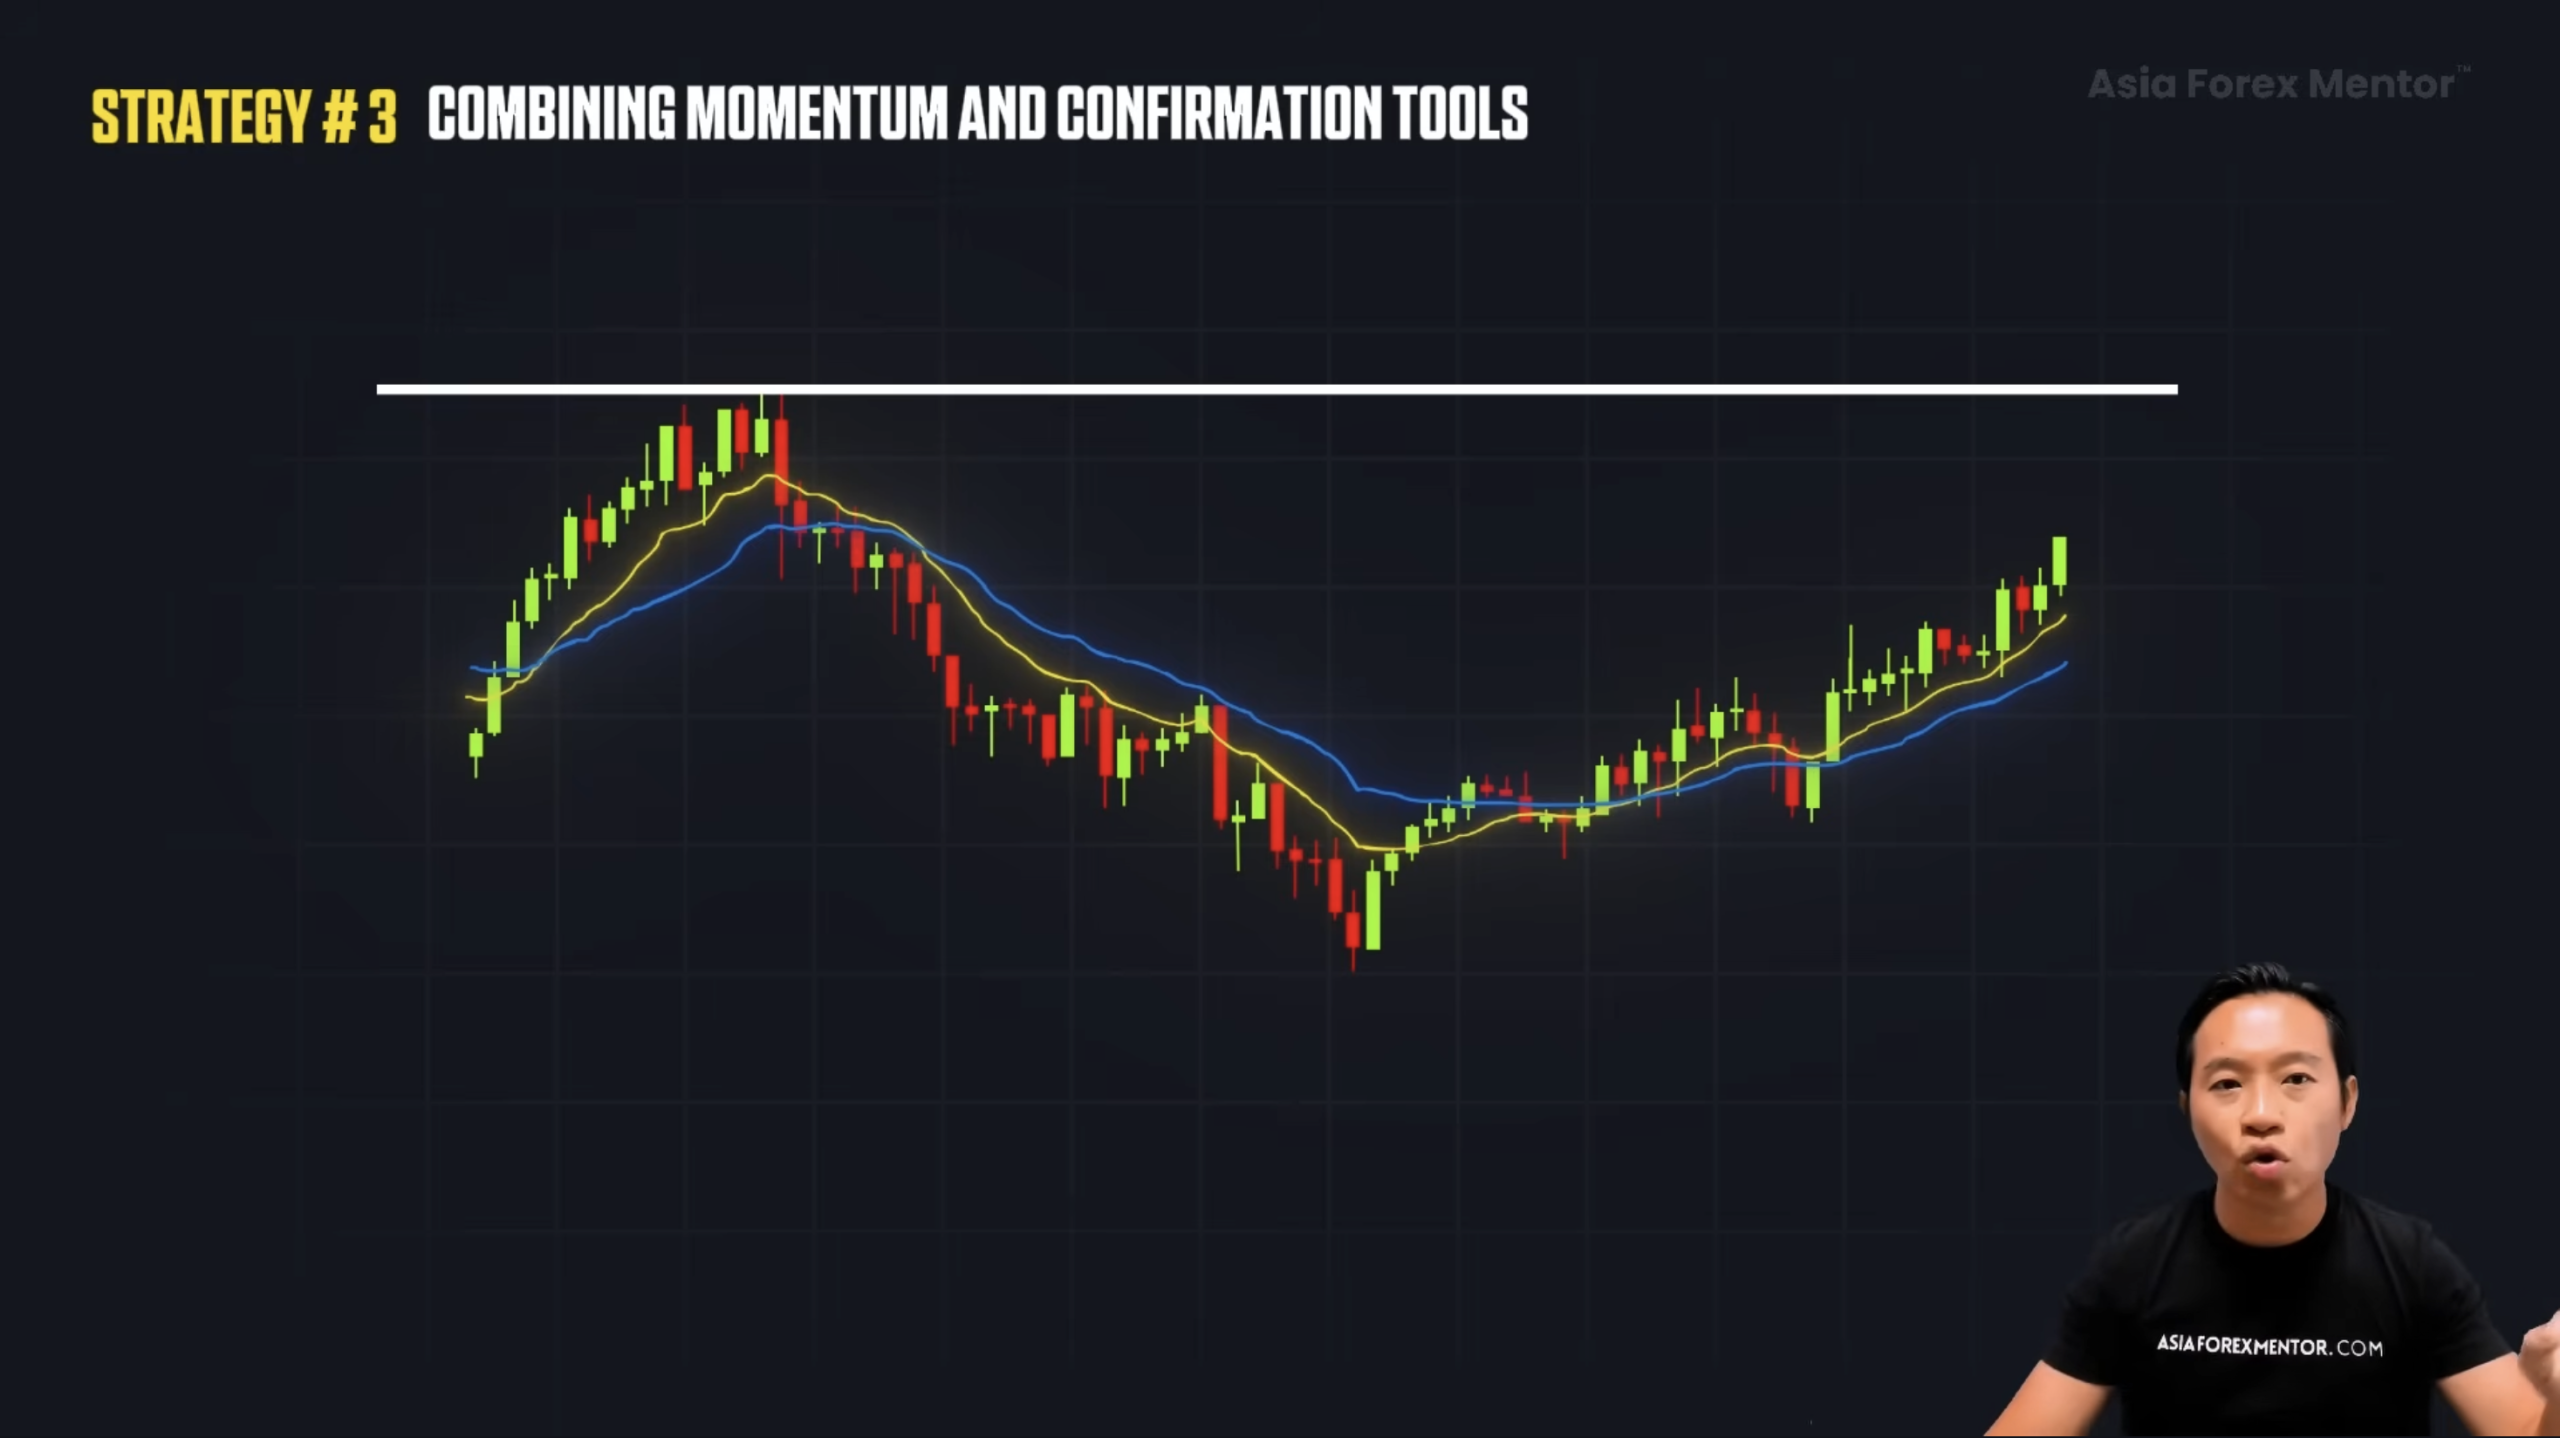
So then you identify resistance and wait for price to return and for the EMA cross.
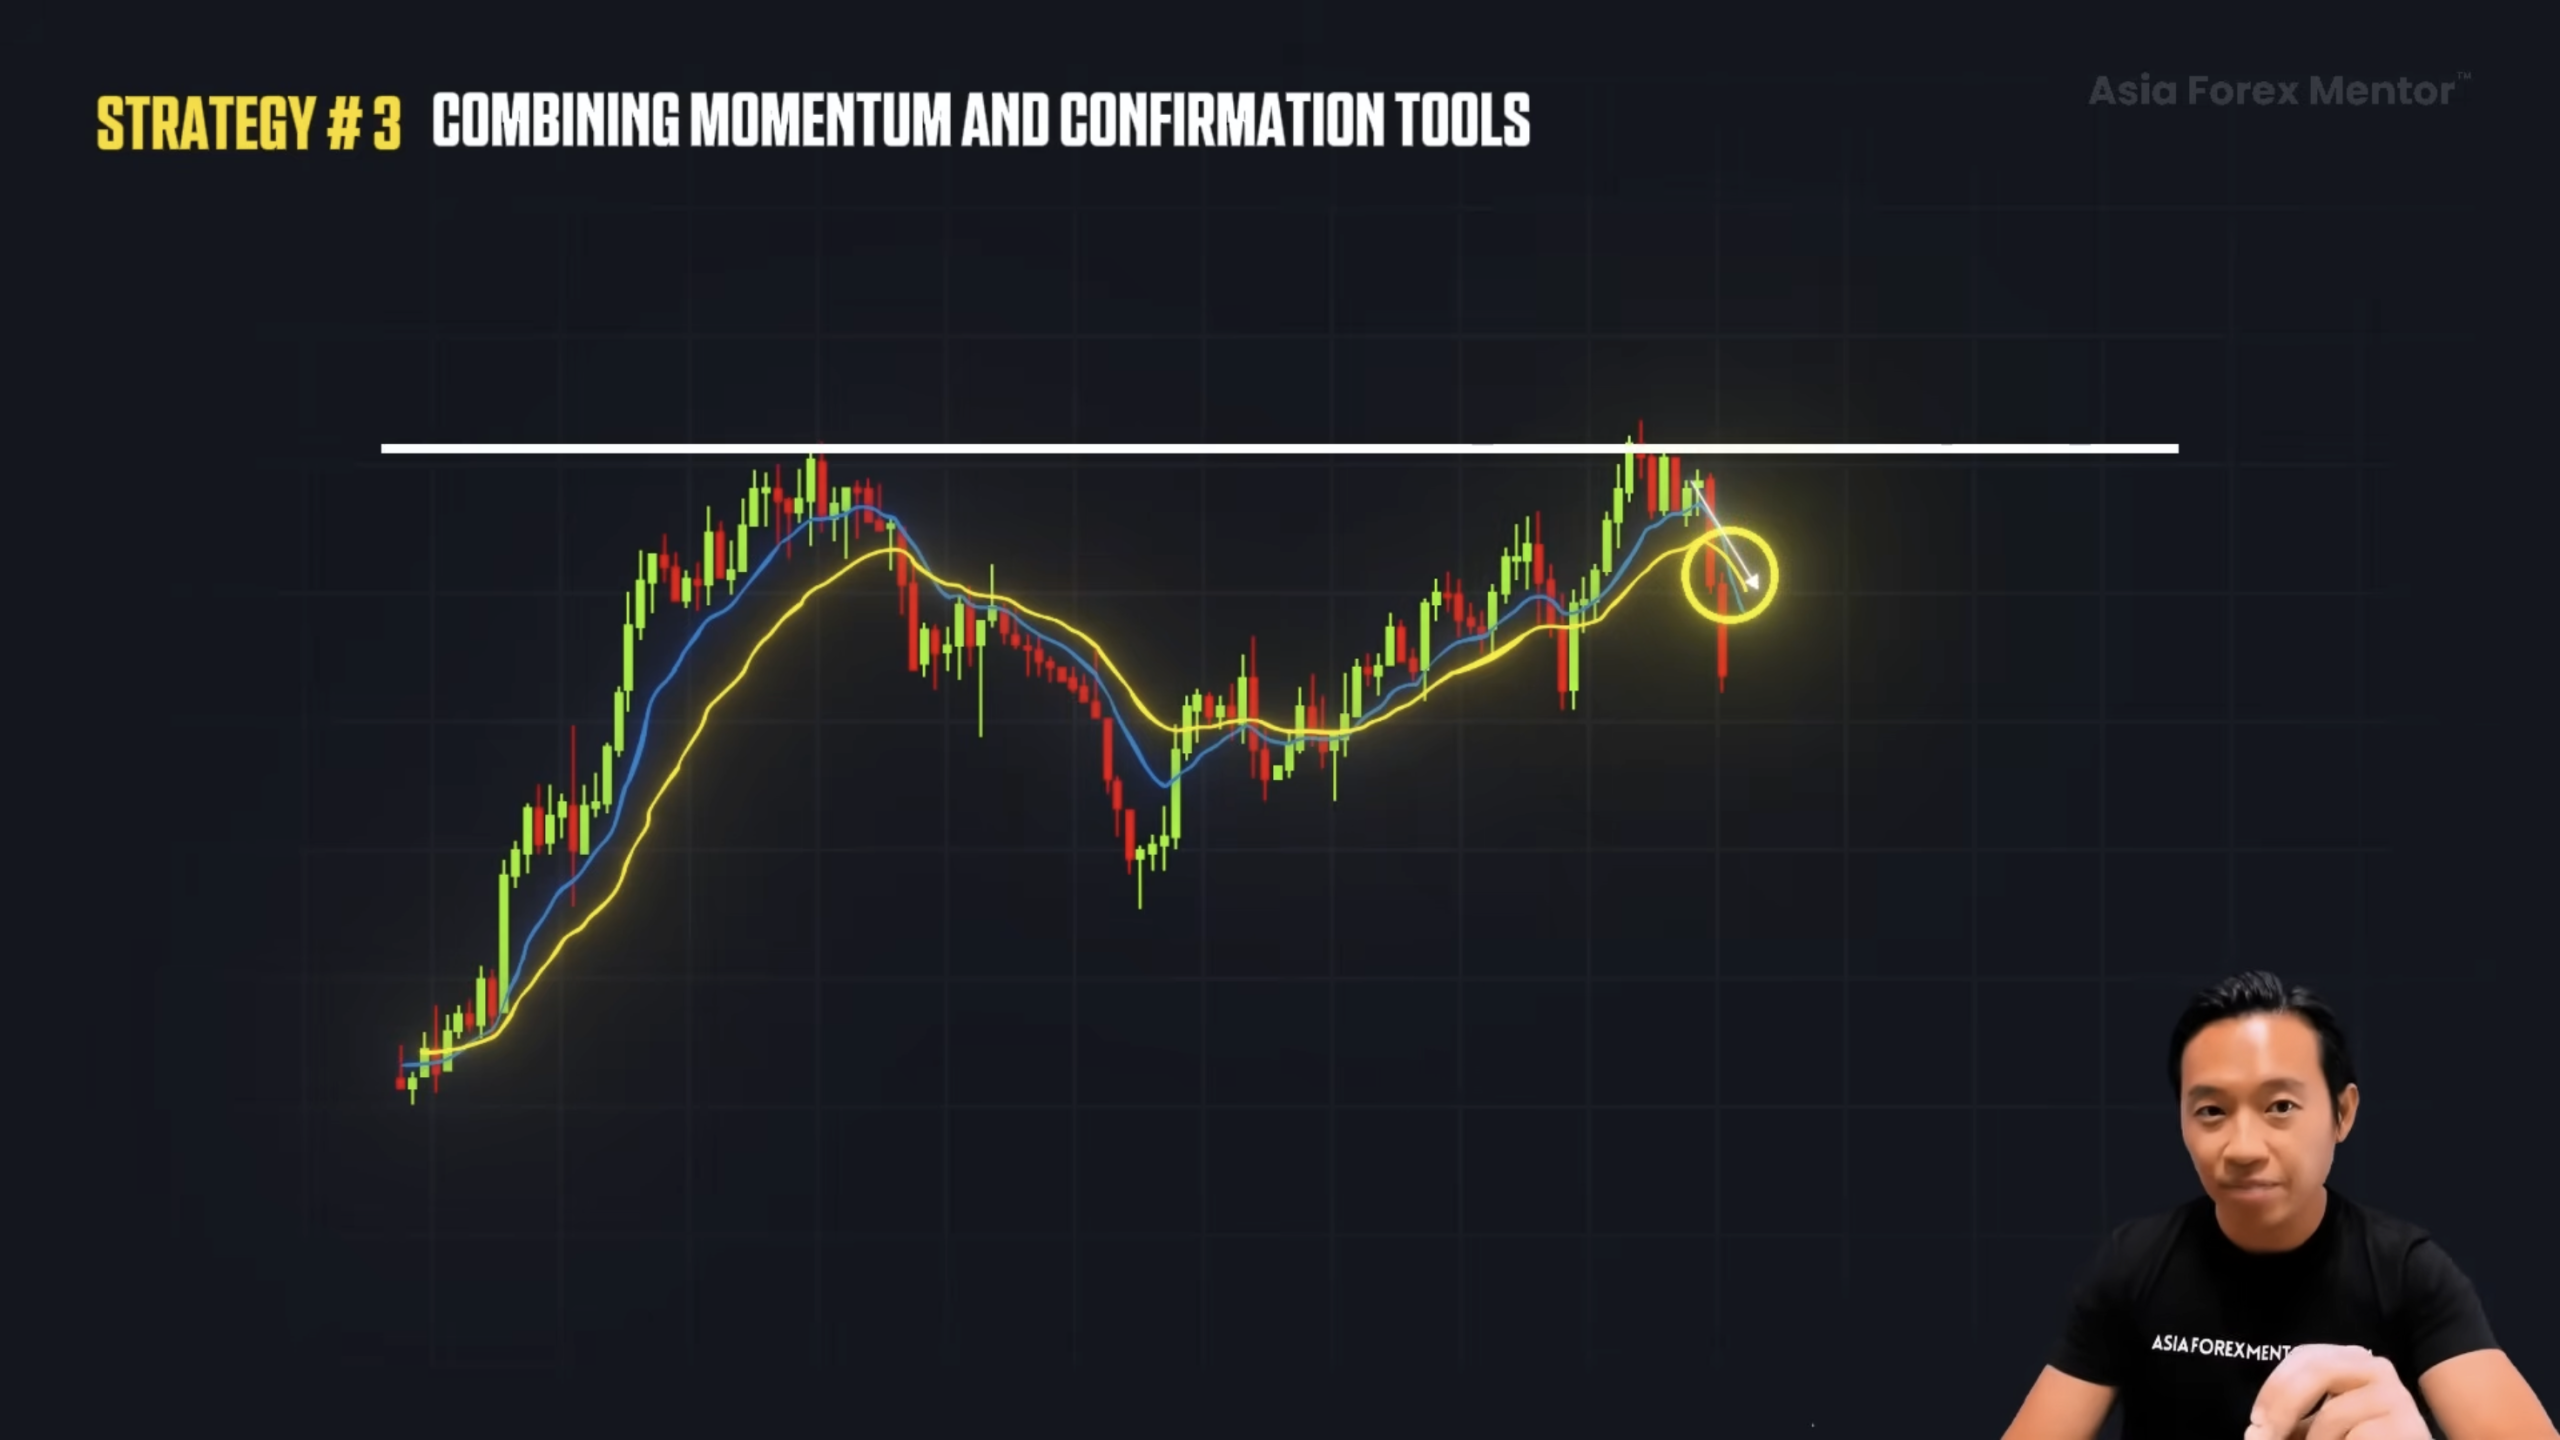
Once the signal prints, look for a short entry, and keep the stop tight near the crossover area. From there, the target naturally sits at the next rejection level, where price has already shown hesitation.
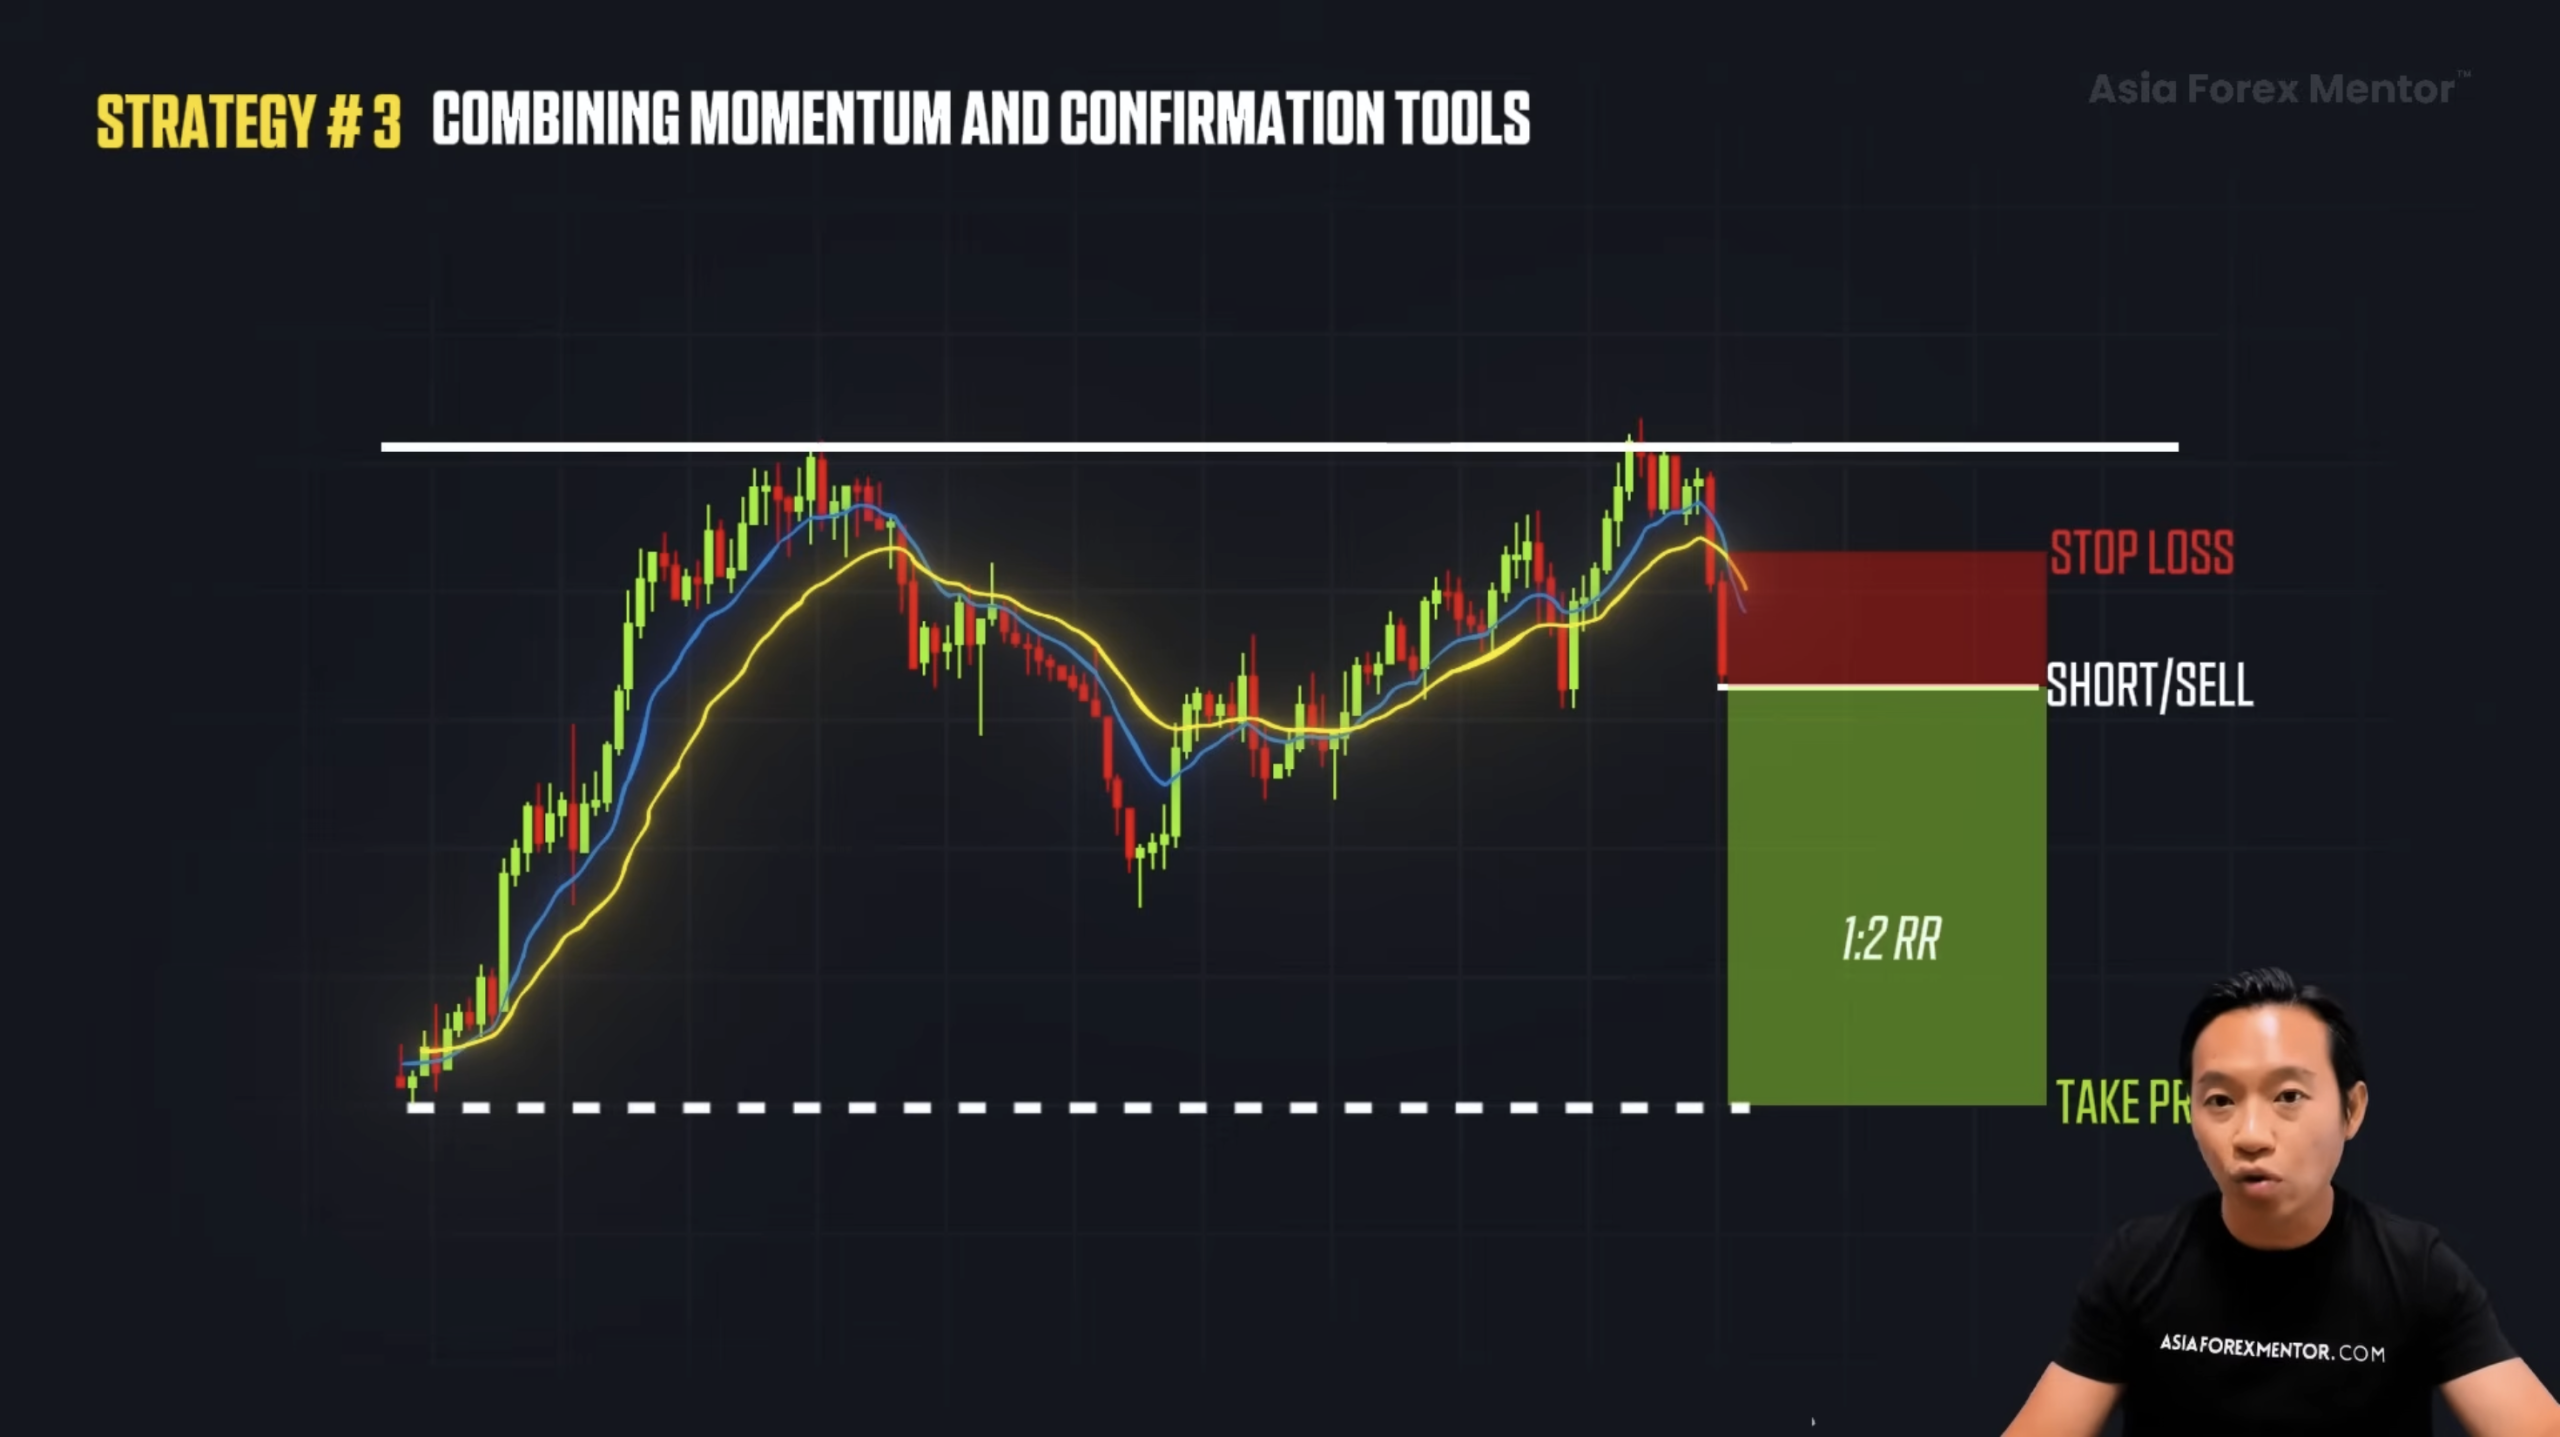
When structure, stochastic, and the EMAs all align like this, the setup becomes high-probability. That combination is the trifecta.

Reversal Strategy Summary

What makes a reversal powerful is not simply spotting it, but understanding why price turns in the first place.

First, liquidity gets swept. Then structure begins to bend, and eventually momentum gives in. Each step builds on the last, telling a clear story of exhaustion.

Strategy one highlights the liquidity grab. Strategy two layers in chart patterns and confluence to give that move context. Finally, strategy three confirms the entire idea using momentum tools.

This is not about perfection. It is about clarity.

And once those signs are read before the crowd reacts, reversals stop looking like noise.
They start becoming opportunity.

FAQ's

What is a liquidity grab?

A liquidity grab happens when price breaks a level just to trigger stop losses and orders. Once that liquidity is collected, price has no reason to continue and often reverses hard. This is why fake breakouts feel sudden and aggressive.

Why do reversals fail?

Most reversals fail because traders try to predict instead of waiting for confirmation. They enter based on feeling, not structure, liquidity, or momentum. When you wait for clear signals, losses become smaller and trades become easier to manage.

Is this strategy beginner-friendly?

Yes, because it follows clear rules instead of guessing. Each step tells you exactly what to wait for and when not to trade. As long as you stay patient and follow the confirmations, it keeps decision-making simple.


About Ezekiel Chew​

Ezekiel Chew, founder and head of training at Asia Forex Mentor, is a renowned forex expert, frequently invited to speak at major industry events. Known for his deep market insights, Ezekiel is one of the top traders committed to supporting the trading community. Making six figures per trade, he also trains traders working in banks, fund management, and prop trading firms.

10 Trading Discipline Every Forex Trader Needs

ABOUT THIS GUIDE Written by Ezekiel Chew, founder of Asia Forex Mentor and a former bank trader with over 20 years of experience. He has coached more than 100,000 students across 50+ countries through the AFM One Core Program. Trading discipline is the one trait he sees in every profitable

Read More

Leverage in Forex and Why Most Traders Abuse It

Leverage in forex is the most powerful tool available to retail traders, and the most dangerous one when used without understanding what it actually does. It allows traders to control positions far larger than their initial deposit. A $1,000 account with 100:1 leverage controls a $100,000 position. That amplifies every

Read More

Is Forex Trading Profitable for Most Traders

Is forex trading profitable? The honest answer is yes, but not in the way most people entering the market expect it to be. Forex trading is profitable for a minority of traders. Most retail traders lose money. That is not a secret. Brokers in the European Union must disclose the

Read More

Understanding What Is Price Action Trading in 2026

What is price action trading and why do institutional traders rely on it while most retail traders still lose money with indicators? Price action trading is the method of making trading decisions based entirely on the market’s price chart. No lagging indicators, moving averages. No RSI or MACD cluttering the

Read More

AFM Trading Summit Live

Date: Coming Soon

Join us at the AFM Trading Summit Live and learn from top industry experts through live trading sessions, market insights, and actionable strategies.

Reversal Trading Strategy: How Market Reversals Really Happen

4.0
Overall Trust Index

Written by:

Updated:

January 9, 2026
Hey, what’s up guys, traders. It’s Ezekiel Chew here. Let me hit you with this. Most traders think they are catching reversals, but in reality, they are catching traps. The market does not reverse randomly. It reverses when smart money sweeps liquidity, traps traders, and flips the move while retail gets destroyed. But here is the truth. A real reversal actually leaves clues. And if you know how to read them, you can spot the turn before it happens. In this guide, I’m breaking down the three reversal strategies I use, and inside each one, the exact patterns, triggers, and conditions that make them work. 📺 Watch the full breakdown in this video: https://youtu.be/zpqn39ACIFo?si=5Dwxz5S1jznDEKBZ Alright, so first things first. A reversal simply means a change in the market’s direction. It is the market’s way of showing exhaustion in real time. Price moves in one trend, then shifts to the opposite side. That shift is what traders call a reversal. It can happen in an uptrend turning down, or a downtrend turning up. Simple as that. But here is where many traders get it wrong.They assume that just because the price has gone too high or too low, it is bound to turn around. That is not how the market works. A market can keep going higher even when everyone thinks it is overbought. And it can keep falling even when it already looks cheap. So instead of guessing where it might flip, we focus on what actually signals a turn. The structure, the behavior, and the energy within the move. Once you understand that, reversals stop feeling random. That is where the real work begins, identifying where the shift starts to form.

Strategy 1: Identifying Liquidity-Based Reversals

Why does price break through a level, look like it is running, and then instantly flip the other way?

That is not a random move. That is structure telling us something important.

A reversal starts when price breaks a clear level, support or resistance, but fails to continue. That failure creates what we call a liquidity grab.

Technically, it is a stop sweep. Price goes beyond a key level just enough to trigger pending orders and stop losses, then reverses sharply in the opposite direction. What looks like a breakout is actually the market collecting liquidity before shifting bias.

Here is the structure behind it.

At resistance, breakout traders go long above the high, while sellers place their stops just above that level. When price spikes through, both orders trigger, creating buy-side liquidity.

Once that fuel is used up, there is no more order flow to push higher. Price snaps back down. That reversal often becomes the start of a new short-term trend.

This principle holds across all timeframes and instruments. Forex, stocks, commodities, crypto, it does not matter.

A liquidity grab shows the same footprint.Then a sharp wick through a level, an immediate rejection, and an impulsive move in the opposite direction.

Mark the candle that created the sweep. The one that broke the level and immediately rejected.

For a bearish reversal, that is the candle piercing above resistance before closing back below.

For a bullish reversal, it is the opposite.

Your entry point is taken from that candle. Stops go just beyond the wick that performed the grab. Because your entry is near the turning point, your risk stays tight while your reward expands. That is why liquidity-grab setups often deliver high risk-to-reward trades.

You are not chasing but rather positioning at the origin of the move.

When backtested, this structure consistently outperformed traditional breakout entries.
Moves after liquidity sweeps were cleaner, more impulsive, and easier to manage.

Even when it fails, losses are minimal because the invalidation point is clear.
That is what makes this a professional-grade setup.

Defined levels. Measurable risk. Structural precision.

Getting stopped out by fake breakouts kills most traders. This is the solution.

Strategy 2: Recognizing Chart-Based Reversal Patterns

Patterns do not predict the market. They reveal what is already happening underneath the surface.

Let us start with one of the strongest reversal formations. The Head and Shoulders pattern. This pattern is built from three swings in a trend.

In an uptrend, price makes a higher high, the head, then a lower high, forming the right shoulder. That tells you momentum is fading. Buyers no longer have enough strength to push past the previous high.

When both shoulders form around the same area and the neckline lines up evenly, that symmetry reveals hesitation. It is structure showing weakness, not emotion.

A clean Head and Shoulders usually has a final exhaustion push. Strong bullish candles try to break higher,

then a decisive bearish candle follows. That is control shifting hands.

Once the neckline breaks, the reversal is confirmed.

The same logic applies to the Inverse Head and Shoulders in downtrends. Sellers lose control, buyers start to take over.

Patterns work best when aligned with previous zones.  Head and Shoulders near a known resistance increases the probability. You are not relying on shape alone but combining structure with context.

The second pattern is the Double Top and Double Bottom. Price tests a level twice and fails to break through. A Double Top rejects at resistance. While a Double Bottom rejects at support.

These are not instant entry signals. They confirm that a zone is valid. The better entry comes from rejection candles or minor structure breaks near that level.

The third pattern is the Trendline Break. A clean trendline shows the rhythm of the trend. Higher lows or lower highs.

When that rhythm breaks, something has changed. Do not rush the entry. Price often retests the trendline before fully reversing.

That retest offers a cleaner and safer entry. If it aligns with another pattern, like a head and shoulder patterns, that is high confidence.

When multiple patterns appear together, that is confluence. The entire market bias is rotating.

Strategy 3: Combining Momentum and Confirmation Tools

When price, structure, and momentum align, that is your green light.

Reversals do not always come from breakdowns. Sometimes they come from rejections.

Start with a clean key level. Do not assume it will reverse immediately. That is where the Stochastic comes in. When Stochastic shows overbought at resistance, that is your first clue.

Not your entry yet.

Wait for the Stochastic lines to cross back down. That cross confirms momentum has shifted. If you short, keep it clean. Stop loss just above the level. Target the next rejection with at least 1:2 risk-to-reward.

Now add the EMA layer. Use the 10 and 20 EMA as a visual filter.

When the 10 crosses below the 20 near resistance, structure and momentum agree.
This filters false reversals.

So then you identify resistance and wait for price to return and for the EMA cross.

Once the signal prints, look for a short entry, and keep the stop tight near the crossover area. From there, the target naturally sits at the next rejection level, where price has already shown hesitation.

When structure, stochastic, and the EMAs all align like this, the setup becomes high-probability. That combination is the trifecta.

Reversal Strategy Summary

What makes a reversal powerful is not simply spotting it, but understanding why price turns in the first place.

First, liquidity gets swept. Then structure begins to bend, and eventually momentum gives in. Each step builds on the last, telling a clear story of exhaustion.

Strategy one highlights the liquidity grab. Strategy two layers in chart patterns and confluence to give that move context. Finally, strategy three confirms the entire idea using momentum tools.

This is not about perfection. It is about clarity.

And once those signs are read before the crowd reacts, reversals stop looking like noise.
They start becoming opportunity.

FAQ's

What is a liquidity grab?

A liquidity grab happens when price breaks a level just to trigger stop losses and orders. Once that liquidity is collected, price has no reason to continue and often reverses hard. This is why fake breakouts feel sudden and aggressive.

Why do reversals fail?

Most reversals fail because traders try to predict instead of waiting for confirmation. They enter based on feeling, not structure, liquidity, or momentum. When you wait for clear signals, losses become smaller and trades become easier to manage.

Is this strategy beginner-friendly?

Yes, because it follows clear rules instead of guessing. Each step tells you exactly what to wait for and when not to trade. As long as you stay patient and follow the confirmations, it keeps decision-making simple.

ezekiel chew asiaforexmentor

About Ezekiel Chew

Ezekiel Chew, founder and head of training at Asia Forex Mentor, is a renowned forex expert, frequently invited to speak at major industry events. Known for his deep market insights, Ezekiel is one of the top traders committed to supporting the trading community. Making six figures per trade, he also trains traders working in banks, fund management, and prop trading firms.

RELATED ARTICLES

Reversal Trading Strategy: How Market Reversals Really Happen

4.0
Overall Trust Index

Written by:

Updated:

January 9, 2026
Hey, what’s up guys, traders. It’s Ezekiel Chew here. Let me hit you with this. Most traders think they are catching reversals, but in reality, they are catching traps. The market does not reverse randomly. It reverses when smart money sweeps liquidity, traps traders, and flips the move while retail gets destroyed. But here is the truth. A real reversal actually leaves clues. And if you know how to read them, you can spot the turn before it happens. In this guide, I’m breaking down the three reversal strategies I use, and inside each one, the exact patterns, triggers, and conditions that make them work. 📺 Watch the full breakdown in this video: https://youtu.be/zpqn39ACIFo?si=5Dwxz5S1jznDEKBZ Alright, so first things first. A reversal simply means a change in the market’s direction. It is the market’s way of showing exhaustion in real time. Price moves in one trend, then shifts to the opposite side. That shift is what traders call a reversal. It can happen in an uptrend turning down, or a downtrend turning up. Simple as that. But here is where many traders get it wrong.They assume that just because the price has gone too high or too low, it is bound to turn around. That is not how the market works. A market can keep going higher even when everyone thinks it is overbought. And it can keep falling even when it already looks cheap. So instead of guessing where it might flip, we focus on what actually signals a turn. The structure, the behavior, and the energy within the move. Once you understand that, reversals stop feeling random. That is where the real work begins, identifying where the shift starts to form.

Strategy 1: Identifying Liquidity-Based Reversals

Why does price break through a level, look like it is running, and then instantly flip the other way?

That is not a random move. That is structure telling us something important.

A reversal starts when price breaks a clear level, support or resistance, but fails to continue. That failure creates what we call a liquidity grab.

Technically, it is a stop sweep. Price goes beyond a key level just enough to trigger pending orders and stop losses, then reverses sharply in the opposite direction. What looks like a breakout is actually the market collecting liquidity before shifting bias.

Here is the structure behind it.

At resistance, breakout traders go long above the high, while sellers place their stops just above that level. When price spikes through, both orders trigger, creating buy-side liquidity.

Once that fuel is used up, there is no more order flow to push higher. Price snaps back down. That reversal often becomes the start of a new short-term trend.

This principle holds across all timeframes and instruments. Forex, stocks, commodities, crypto, it does not matter.

A liquidity grab shows the same footprint.Then a sharp wick through a level, an immediate rejection, and an impulsive move in the opposite direction.

Mark the candle that created the sweep. The one that broke the level and immediately rejected.

For a bearish reversal, that is the candle piercing above resistance before closing back below.

For a bullish reversal, it is the opposite.

Your entry point is taken from that candle. Stops go just beyond the wick that performed the grab. Because your entry is near the turning point, your risk stays tight while your reward expands. That is why liquidity-grab setups often deliver high risk-to-reward trades.

You are not chasing but rather positioning at the origin of the move.

When backtested, this structure consistently outperformed traditional breakout entries.
Moves after liquidity sweeps were cleaner, more impulsive, and easier to manage.

Even when it fails, losses are minimal because the invalidation point is clear.
That is what makes this a professional-grade setup.

Defined levels. Measurable risk. Structural precision.

Getting stopped out by fake breakouts kills most traders. This is the solution.

Strategy 2: Recognizing Chart-Based Reversal Patterns

Patterns do not predict the market. They reveal what is already happening underneath the surface.

Let us start with one of the strongest reversal formations. The Head and Shoulders pattern. This pattern is built from three swings in a trend.

In an uptrend, price makes a higher high, the head, then a lower high, forming the right shoulder. That tells you momentum is fading. Buyers no longer have enough strength to push past the previous high.

When both shoulders form around the same area and the neckline lines up evenly, that symmetry reveals hesitation. It is structure showing weakness, not emotion.

A clean Head and Shoulders usually has a final exhaustion push. Strong bullish candles try to break higher,

then a decisive bearish candle follows. That is control shifting hands.

Once the neckline breaks, the reversal is confirmed.

The same logic applies to the Inverse Head and Shoulders in downtrends. Sellers lose control, buyers start to take over.

Patterns work best when aligned with previous zones.  Head and Shoulders near a known resistance increases the probability. You are not relying on shape alone but combining structure with context.

The second pattern is the Double Top and Double Bottom. Price tests a level twice and fails to break through. A Double Top rejects at resistance. While a Double Bottom rejects at support.

These are not instant entry signals. They confirm that a zone is valid. The better entry comes from rejection candles or minor structure breaks near that level.

The third pattern is the Trendline Break. A clean trendline shows the rhythm of the trend. Higher lows or lower highs.

When that rhythm breaks, something has changed. Do not rush the entry. Price often retests the trendline before fully reversing.

That retest offers a cleaner and safer entry. If it aligns with another pattern, like a head and shoulder patterns, that is high confidence.

When multiple patterns appear together, that is confluence. The entire market bias is rotating.

Strategy 3: Combining Momentum and Confirmation Tools

When price, structure, and momentum align, that is your green light.

Reversals do not always come from breakdowns. Sometimes they come from rejections.

Start with a clean key level. Do not assume it will reverse immediately. That is where the Stochastic comes in. When Stochastic shows overbought at resistance, that is your first clue.

Not your entry yet.

Wait for the Stochastic lines to cross back down. That cross confirms momentum has shifted. If you short, keep it clean. Stop loss just above the level. Target the next rejection with at least 1:2 risk-to-reward.

Now add the EMA layer. Use the 10 and 20 EMA as a visual filter.

When the 10 crosses below the 20 near resistance, structure and momentum agree.
This filters false reversals.

So then you identify resistance and wait for price to return and for the EMA cross.

Once the signal prints, look for a short entry, and keep the stop tight near the crossover area. From there, the target naturally sits at the next rejection level, where price has already shown hesitation.

When structure, stochastic, and the EMAs all align like this, the setup becomes high-probability. That combination is the trifecta.

Reversal Strategy Summary

What makes a reversal powerful is not simply spotting it, but understanding why price turns in the first place.

First, liquidity gets swept. Then structure begins to bend, and eventually momentum gives in. Each step builds on the last, telling a clear story of exhaustion.

Strategy one highlights the liquidity grab. Strategy two layers in chart patterns and confluence to give that move context. Finally, strategy three confirms the entire idea using momentum tools.

This is not about perfection. It is about clarity.

And once those signs are read before the crowd reacts, reversals stop looking like noise.
They start becoming opportunity.

FAQ's

What is a liquidity grab?

A liquidity grab happens when price breaks a level just to trigger stop losses and orders. Once that liquidity is collected, price has no reason to continue and often reverses hard. This is why fake breakouts feel sudden and aggressive.

Why do reversals fail?

Most reversals fail because traders try to predict instead of waiting for confirmation. They enter based on feeling, not structure, liquidity, or momentum. When you wait for clear signals, losses become smaller and trades become easier to manage.

Is this strategy beginner-friendly?

Yes, because it follows clear rules instead of guessing. Each step tells you exactly what to wait for and when not to trade. As long as you stay patient and follow the confirmations, it keeps decision-making simple.

ezekiel chew asiaforexmentor

About Ezekiel Chew

Ezekiel Chew, founder and head of training at Asia Forex Mentor, is a renowned forex expert, frequently invited to speak at major industry events. Known for his deep market insights, Ezekiel is one of the top traders committed to supporting the trading community. Making six figures per trade, he also trains traders working in banks, fund management, and prop trading firms.

RELATED ARTICLES

Join the Live Event
Get Your Free Ticket Now

I consent to receiving emails and/or text message reminders for this event.

REGISTER FOR THE MASTERCLASS!