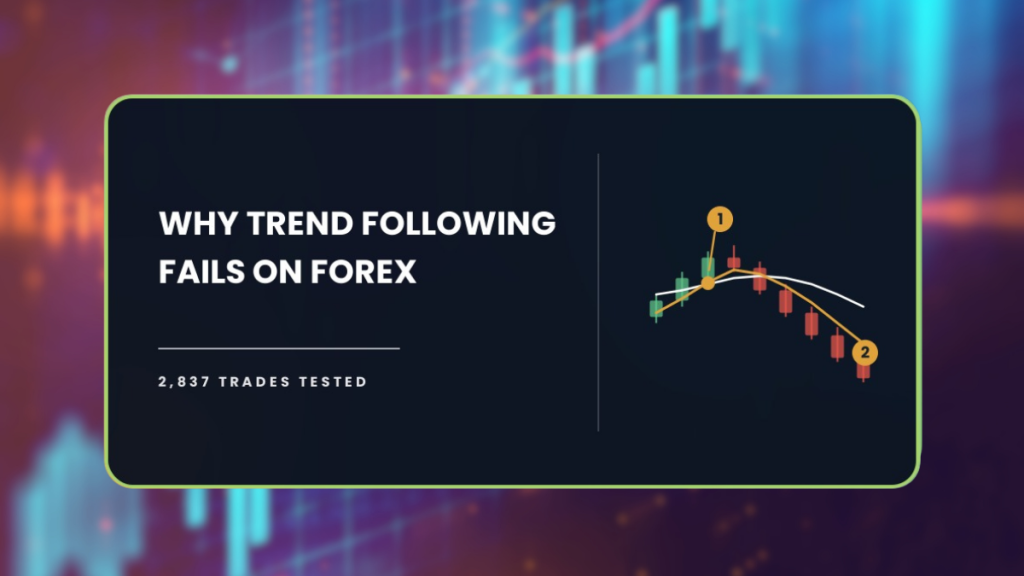
Trend following has the best reputation in trading. It is the approach behind the Turtles, behind most managed futures funds, and behind the advice to cut your losses and let your winners run. So I had the AFM Research Lab run it properly on forex, 2,837 trades across 28 pairs and ten years of Daily data, and a $10,000 account finished at $2,417. The version I tightened afterwards lost less, and the reason it lost less is the most useful thing in this test.
| About This Guide |
|---|
| This guide explains what a trend following strategy is, the exact entry, stop and target rules we put through the AFM Research Lab, and what happened across 28 forex pairs and ten years of Daily data. You will finish knowing what the tested results say and why the reputation and the results do not match. |
| Quick Answer |
|---|
| A trend following strategy waits for a trend to establish itself, then buys in its direction. In the AFM Research Lab the textbook rules turned $10,000 into $2,417 across 28 pairs on the Daily chart, with an 80.5 percent worst fall. A tightened version lost less and still lost. |
What Happened When We Tested The Trend Following Strategy
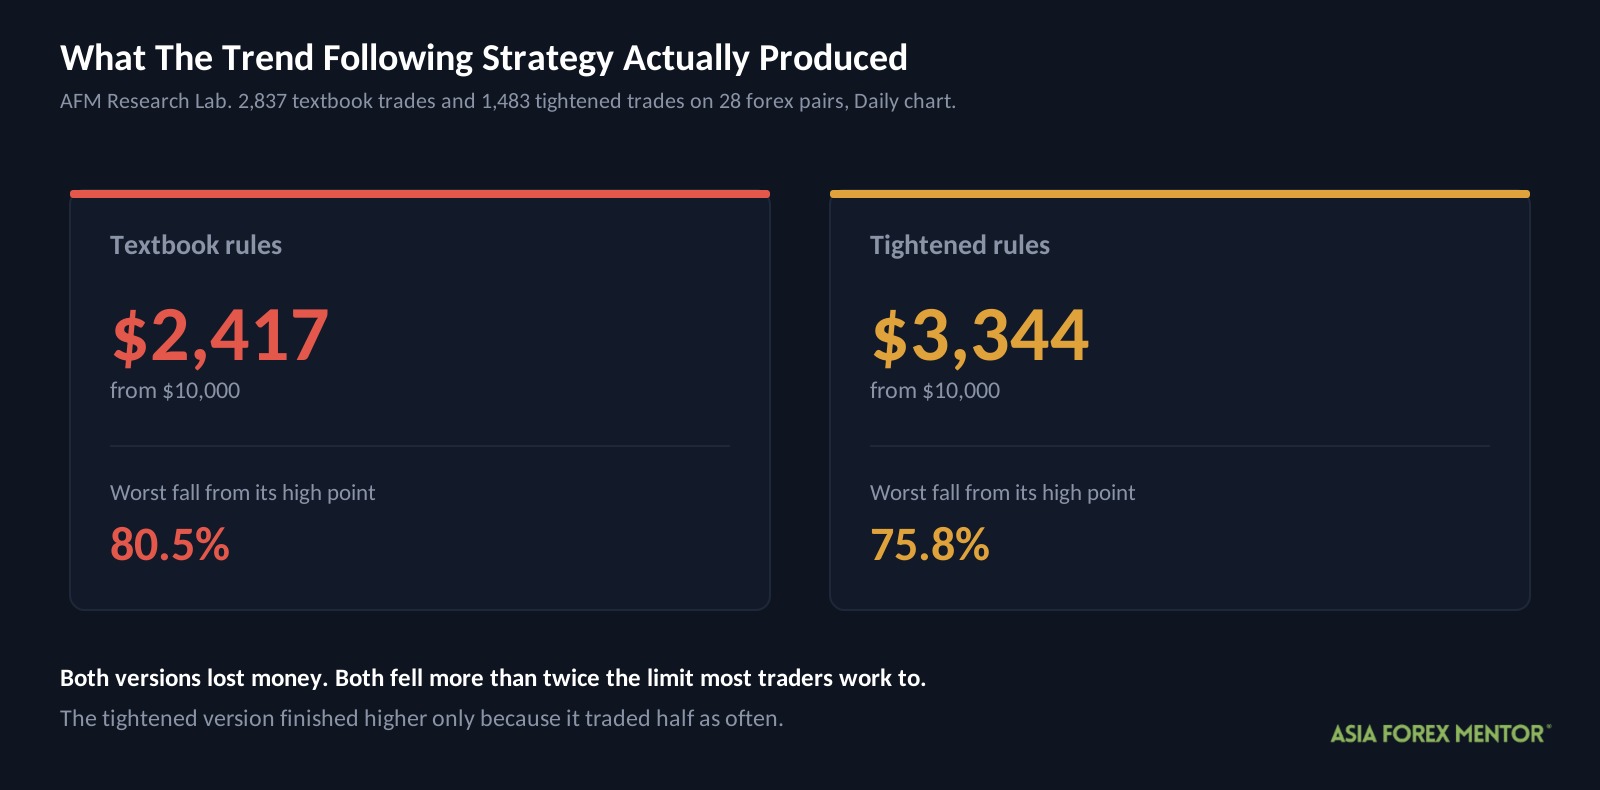
Two accounts, both starting at $10,000. One traded the rules you will find in most tutorials. The other traded a tightened version the AFM Research Lab built after the first one failed.
Both finished well below where they started.
| Version | Start | End | Max drawdown |
|---|---|---|---|
| Textbook | $10,000 | $2,417 | 80.5% |
| Tightened | $10,000 | $3,344 | 75.8% |
That last column needs explaining before the rest makes sense.
Drawdown is how far an account falls from its highest point. It is not how far you are up or down overall, it is the size of the worst slide from a peak to the low that followed.
An 80.5 percent drawdown means four fifths of the account’s peak value disappeared. The textbook version finished at $2,417, so $7,583 of the original $10,000 was gone by the end.
The test ran from June 23, 2016 to September 23, 2026, across 28 currency pairs on the Daily chart. Each trade risked 1 percent of the account, and trading costs were charged at 0.05 percent of the entry price per round trip.
These are backtest results. Backtesting is not live trading, and past results do not guarantee future performance.
Key Takeaways
- The textbook rules lost 76 percent of the account over 2,837 trades and ten years, finishing at $2,417.
- The worst fall was 80.5 percent, which is nearly triple the 30 percent limit most traders work to.
- The tightened version finished higher at $3,344, but every per trade measure in it got worse rather than better.
- It lost less only because it traded half as often, which is the single most useful lesson in this test.
- One of the four time periods made money, returning 2.5 percent. The other three lost between 5.9 and 22.5 percent a year.
What Is A Trend Following Strategy And How Does It Work?
A trend following strategy does not try to predict anything. It waits until a move is already underway, confirms that it is real, and then joins it in the same direction, holding until the move runs out.
The logic is that most price action goes nowhere, but occasionally a market moves a long way in one direction. Trend following accepts many small losses in exchange for catching those few large moves.
That is why the win rate is expected to be low. A trend following system that wins 35 percent of the time can still make money, provided the winners are several times the size of the losers.
Everything depends on whether the market in question actually produces long sustained moves. That assumption is the one this test puts under pressure.
How Do Most Traders Trade Trends?
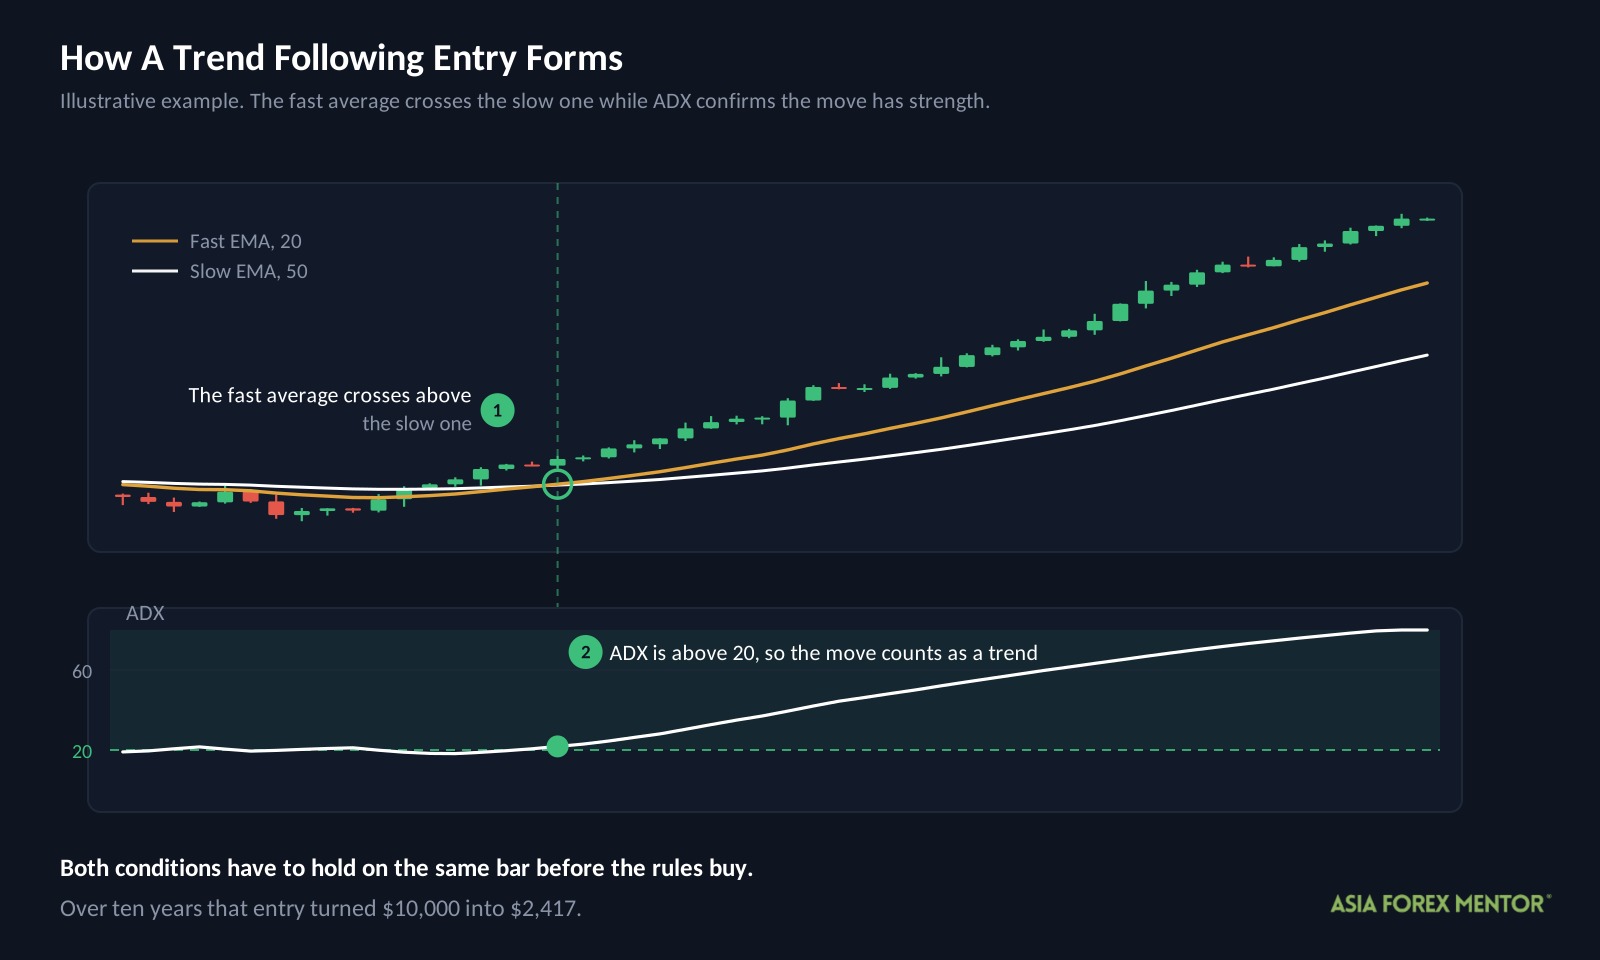
They use two moving averages to define the direction and one more indicator to confirm the move has strength.
Four terms you need first.
EMA means exponential moving average, which is the average price over a set number of bars with the most recent bars weighted more heavily. When a faster EMA crosses above a slower one, recent prices are rising faster than older ones, which is read as an uptrend starting.
ADX means Average Directional Index, a number from 0 to 100 that measures how strong a trend is without saying which way it points. Readings above 20 are usually treated as a trend worth trading, and readings below as a market going sideways.
ATR means Average True Range. It is how much a pair usually moves in a day, so a stop set in ATR sizes itself to each pair instead of using the same pip distance everywhere.
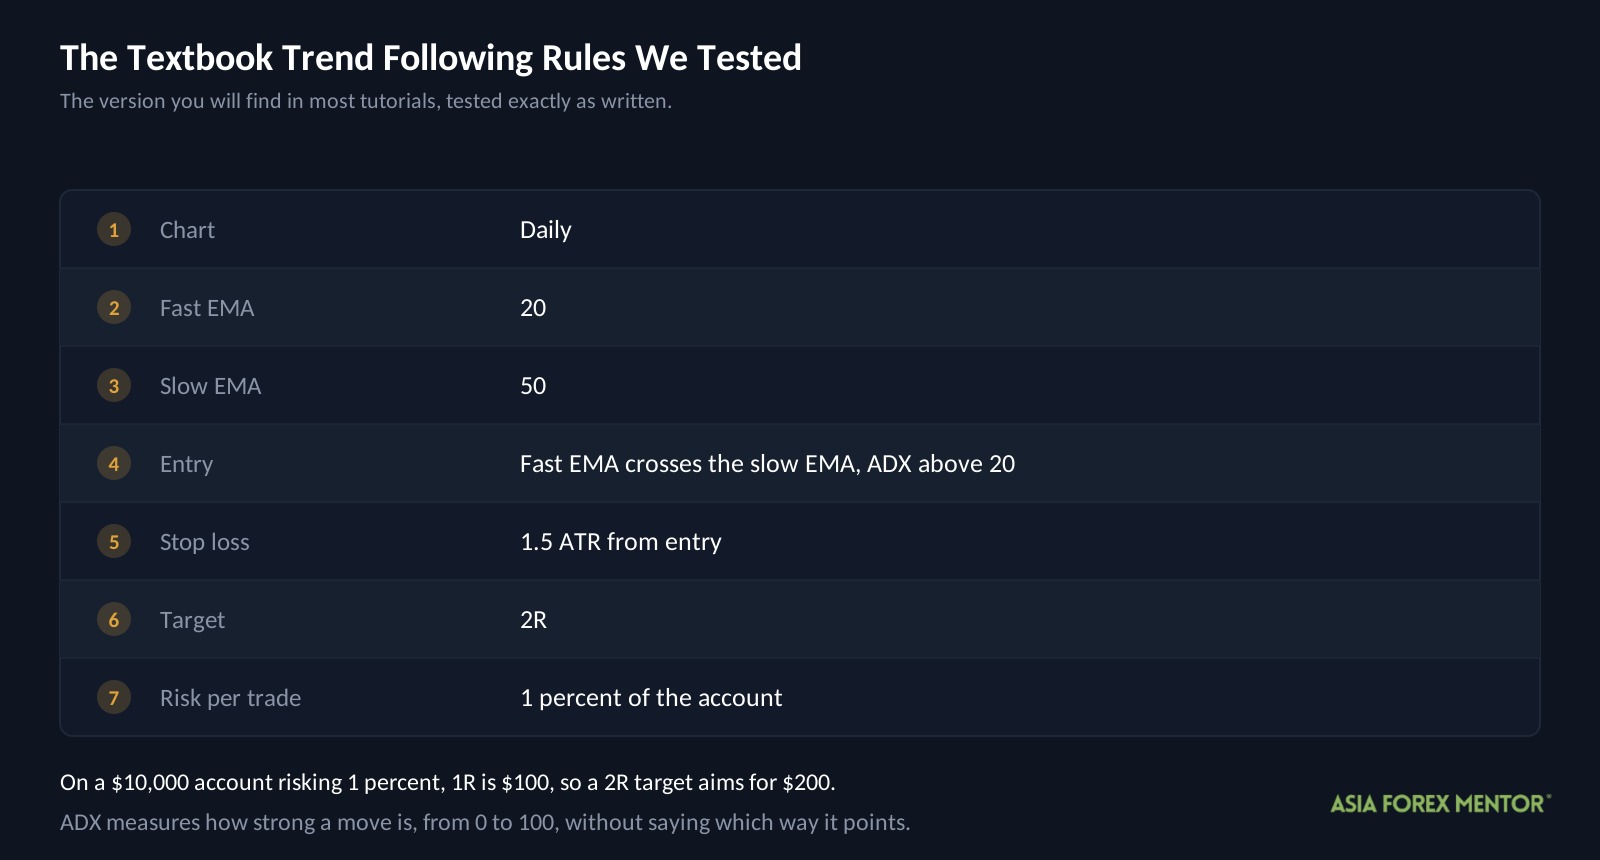
R is what you risk on one trade, measured from entry to stop. On a $10,000 account risking 1 percent, 1R is $100, so a 2R target aims for $200.
Here are the rules exactly as we tested them.
| Rule | Setting |
|---|---|
| Chart | Daily |
| Fast EMA | 20 |
| Slow EMA | 50 |
| Entry | Fast EMA crosses the slow EMA, with ADX above 20 |
| RSI period | 14 |
| Stop loss | 1.5 ATR from entry |
| Target | 2R |
| Risk per trade | 1 percent of the account |
The ADX filter is the part that is supposed to do the heavy lifting. Moving average crossovers fire constantly in sideways markets, and requiring ADX above 20 is meant to keep you out of those.
Does The Textbook Version Make Money?
No. Over 2,837 trades and ten years it lost about three quarters of the account.
| Metric | Textbook |
|---|---|
| Trades | 2,837 |
| Win rate | 34% |
| Expectancy | -0.04R |
| Profit factor | 0.94 |
| Yearly growth rate | -12.9% |
| Max drawdown | 80.5% |
| Ending balance from $10,000 | $2,417 |
Three of those need defining.
Expectancy is what the average trade earns or loses, measured in R. At negative 0.04R, every trade gave back about a twenty fifth of what it risked, and 2,837 of those is what empties an account.
Profit factor is total winnings divided by total losses. Above 1 means the strategy made money, so 0.94 says it paid out 94 cents for every dollar it took in.
Yearly growth rate, often written as CAGR, is the rate the account changed each year on average. At negative 12.9 percent a year, compounding over a decade, $10,000 shrinks to $2,417.
Here is the part worth sitting with. A profit factor of 0.94 is not a collapse, it is a near miss. The strategy recovered 94 cents of every dollar it put at risk, and the missing six cents, repeated 2,837 times, is the entire distance between this result and breaking even.
What Settings Did We Change And Why?
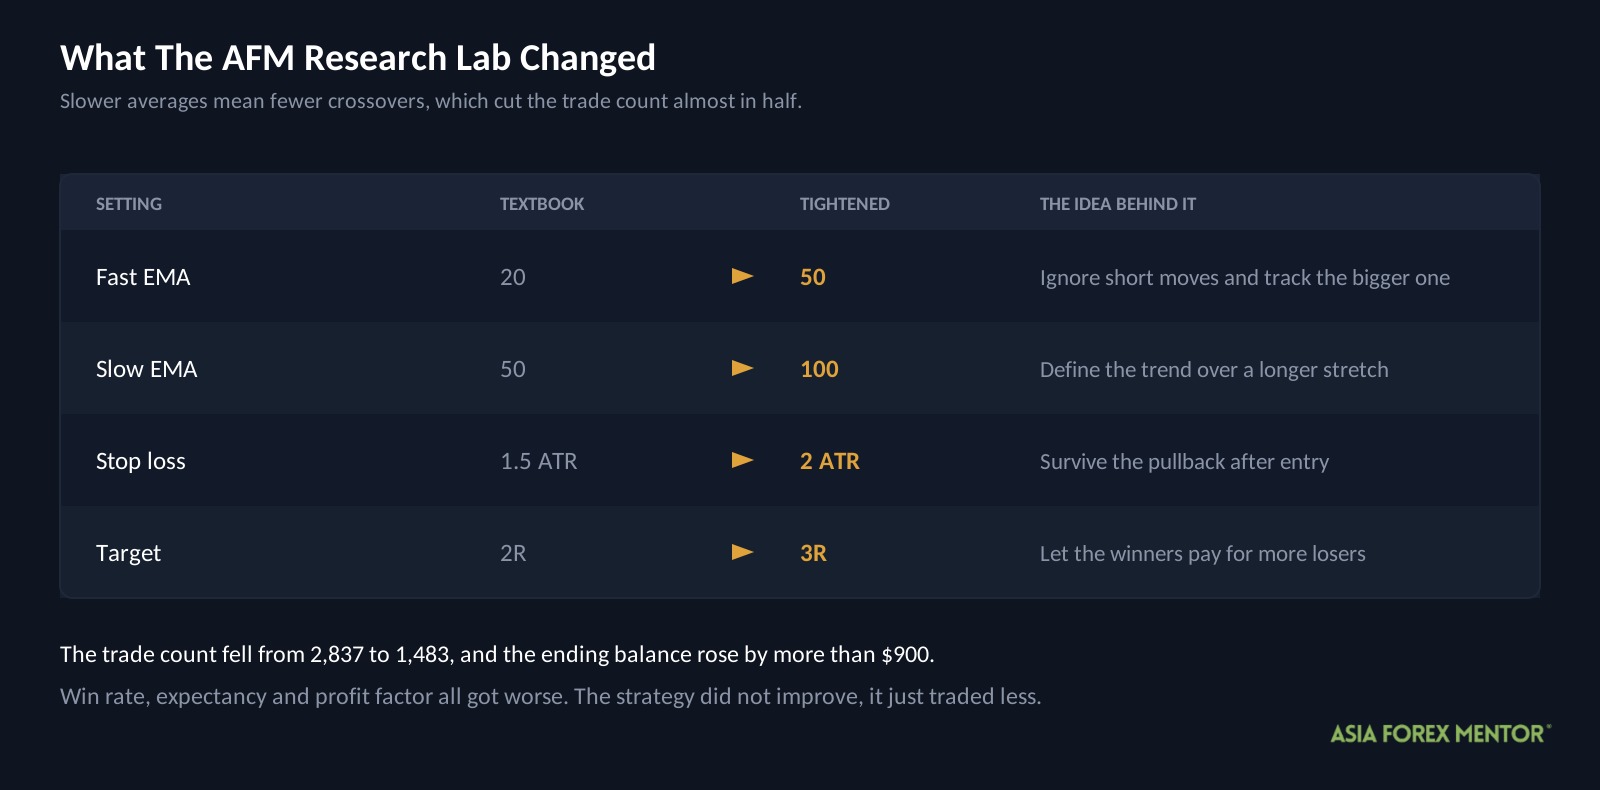
A crossover on a 20 and 50 EMA pair reacts quickly, which means it reacts to a lot of noise. The obvious fix is to slow it down and ask for more before committing.
| Setting | Textbook | Tightened | The idea behind it |
|---|---|---|---|
| Fast EMA | 20 | 50 | Ignore short moves and track the bigger one |
| Slow EMA | 50 | 100 | Define the trend over a longer stretch |
| Stop loss | 1.5 ATR | 2 ATR | Survive the pullback after entry |
| Target | 2R | 3R | Let the winners pay for more losers |
Slower averages mean fewer crossovers, and fewer crossovers mean fewer trades. The trade count fell from 2,837 to 1,483, close to half.
These settings were chosen by testing combinations against the full history and keeping what scored best. That has a name, in sample optimization, and it means the test already knew the answers, so live results are usually worse.
Did The New Settings Work?
The account finished higher. Every measure of how well the strategy actually traded finished lower.
| Metric | Textbook | Tightened |
|---|---|---|
| Trades | 2,837 | 1,483 |
| Win rate | 34% | 32% |
| Expectancy | -0.04R | -0.06R |
| Profit factor | 0.94 | 0.91 |
| Yearly growth rate | -12.9% | -10.1% |
| Max drawdown | 80.5% | 75.8% |
| Ending balance from $10,000 | $2,417 | $3,344 |
Read those two columns against each other slowly, because this is the finding.
The win rate fell. Expectancy got worse. Profit factor got worse. And the ending balance went up by more than $900.
The explanation is arithmetic rather than skill. A losing strategy applied 2,837 times loses more than the same strategy applied 1,483 times, even when each individual trade is slightly worse. Trading less often did not improve anything, it just slowed the bleeding.
This is the trap in every optimization table you will ever read. A higher ending balance can mean a better strategy, or it can mean the same broken strategy running at half speed, and only the per trade numbers tell you which.
Did The Result Hold In Every Time Period?
A single ten year number can hide a lot. To check, the AFM Research Lab split the decade into four periods and scored the tightened rules separately in each. This is called walk forward testing, and it answers whether a result holds up in every era or only in one.
| Period | Win rate | Expectancy | Yearly growth rate | Max drawdown |
|---|---|---|---|---|
| 1 | 29% | -0.17R | -22.5% | 49.3% |
| 2 | 32% | -0.03R | -5.9% | 30.6% |
| 3 | 32% | -0.09R | -12.9% | 48.4% |
| 4 | 35% | +0.03R | +2.5% | 29.3% |
One period made money. It returned 2.5 percent, which is less than a savings account paid over the same stretch.
The other three lost between 5.9 and 22.5 percent a year, and two of them fell nearly half from their high point along the way.
What the table does show is a pattern. The two periods with the smallest losses are also the two with the smallest drawdowns, around 30 percent, while the two worst periods both fell close to 50 percent. The strategy did not fail evenly, it failed in bursts.
What Does A Winning Trade Look Like?
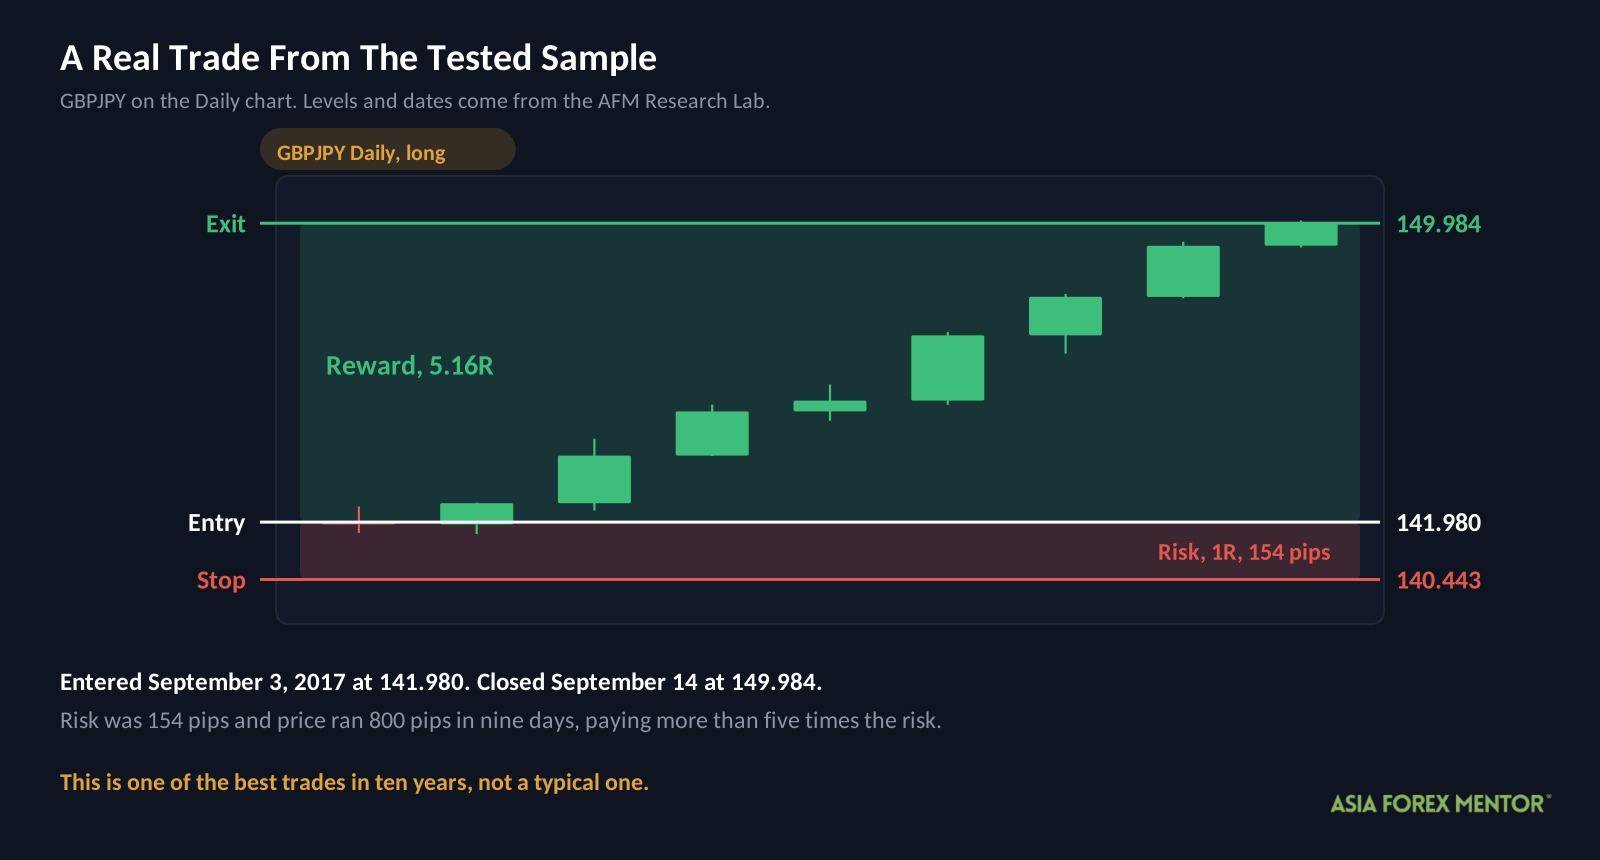
This is a real trade from the tested sample, and it is one of the best in ten years rather than a typical week.
| Detail | Value |
|---|---|
| Pair and chart | GBPJPY, Daily |
| Direction | Long, meaning a buy |
| Entry | September 3, 2017 at 141.980 |
| Stop | 140.443 |
| Exit | September 14, 2017 at 149.984 |
| Result | +5.16R in 9 bars |
The risk on this trade was 154 pips, the distance from 141.980 down to the stop at 140.443. Price then ran 800 pips in nine days, which is why it paid more than five times what it risked.
This is trend following working exactly as advertised. A move started, the rules joined it, and a nine day hold paid for a long run of small losses.
The problem is the ratio of trades like this to everything else. Across 1,483 tightened trades, enough of them went the other way that the account still ended at $3,344.
Why Trend Following Struggles On Forex Dailies
Trend following earned its reputation in markets that produce long one way moves, and currencies are not reliably one of them.
A currency pair is a comparison between two economies rather than the price of a thing. When one side strengthens, the move tends to find a level and sit there, instead of extending the way a commodity in short supply can.
There is also a timing cost built into the method. A crossover confirms a trend only after a meaningful part of the move has already happened, so you are buying later and with a wider stop than someone who entered at the start.
That combination is what the numbers show. Not a broken idea, but an idea borrowed from markets that behave differently, applied where the moves are shorter and the entry arrives late.
How Should You Practice Trend Following?
I would not trade these rules with real money. Recognizing a trend is still worth learning, so here is how I would build the skill.
- Open a Daily chart on one pair and plot a 50 and a 100 EMA.
- Scroll back two years and mark every point where the faster line crossed the slower one.
- For each crossing, check whether ADX was above 20 on that bar.
- Where it was, write down the entry, a 2 ATR stop and a 3R target.
- Walk the chart forward one bar at a time and record whether the stop or the target came first.
- Do at least 30 of them by hand before trusting any automated version.
- Count how many of your winners came from a handful of large moves rather than spread evenly.
- Split your results into four date ranges and check whether each made money on its own.
That seventh step is the one that teaches the most. Trend following depends entirely on a few outsized winners, and seeing how few there are changes how you think about the method.
Position sizing is what makes this survivable either way. Sound risk management is the difference between a long losing run being uncomfortable and being fatal.
Is Trend Following Worth Your Time?
As a mechanical system on forex dailies, the test says no.
- The textbook rules turned $10,000 into $2,417 across 2,837 trades, with an 80.5 percent max drawdown.
- The tightened rules finished higher at $3,344 while scoring worse on win rate, expectancy and profit factor.
- Three of four periods lost money, and the best returned 2.5 percent.
What I would take from this is not that trend following is a myth. It is that a method only works where the market supplies what the method needs, and ten years of currency pairs did not supply enough sustained moves.
The second thing I would take is the one that applies everywhere. When a change makes your ending balance better and your per trade numbers worse, you have not improved the strategy, you have just reduced how much of it you are doing.
Also Read: The Market Structure In Forex
Frequently Asked Questions
Does Trend Following Work In Forex?
Not in this test. The AFM Research Lab ran it across 2,837 trades and ten years of Daily data and a $10,000 account finished at $2,417, falling 80.5 percent from its high point along the way.
What Is The Best EMA Setting For Trend Following?
A 50 and 100 pair performed better than 20 and 50 here, but that is not the same as being the best setting. Any value tested on past data can look good by chance, and the slower pair mainly helped by producing fewer trades.
Why Did The Account End Higher With Worse Numbers?
Because it traded half as often. A strategy that loses a small amount per trade loses less in total across 1,483 trades than across 2,837, even when each individual trade is slightly worse.
What Does ADX Above 20 Mean?
ADX measures how strong a move is, on a scale of 0 to 100, without indicating direction. Above 20 is commonly read as a market that is trending rather than drifting sideways, which is when trend rules are meant to apply.
Is An 80 Percent Drawdown Recoverable?
Barely, in theory. An account down 80.5 percent needs a gain of more than 400 percent just to return to its starting point, and almost nobody stays with a system long enough to find out.
Why Is The Win Rate So Low?
Low win rates are normal and expected in trend following, because the method takes many small losses while waiting for a few large winners. The problem here was not the 34 percent win rate, it was that the winners were not large enough to pay for the losses.
Why Does Walk Forward Testing Matter?
Because an average hides the shape of a result. Splitting ten years into four periods showed that one made 2.5 percent while another lost 22.5 percent a year, which is a very different picture from a single ten year number.