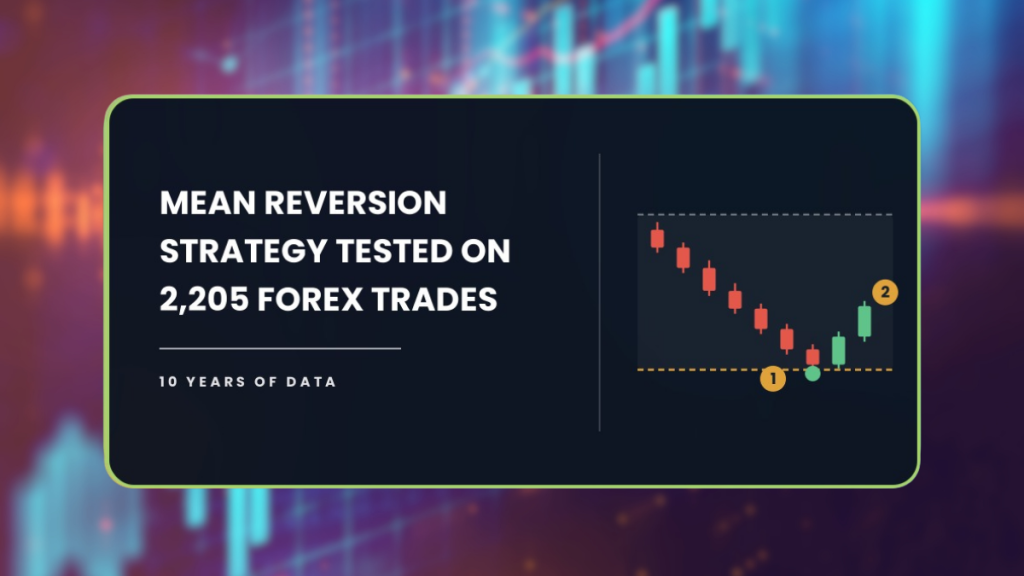
The mean reversion strategy turned $10,000 into $2,643. Not in a bad year, not on one pair, but across 28 forex pairs and ten years of Daily data, traded exactly the way every course teaches it. I had the AFM Research Lab tighten every rule in the setup to try to save it, and it still finished below where it started. Here is what 2,205 trades actually did.
| About This Guide |
|---|
| This guide explains what mean reversion is, the exact entry, stop and target rules we put through the AFM Research Lab, and what happened across 28 forex pairs and ten years of Daily data. You will finish knowing what the tested results say and what would have to change before the setup is worth real money. |
| Quick Answer |
|---|
| Mean reversion means buying when price stretches below its average and selling when it stretches above, betting the move snaps back. In the AFM Research Lab, the textbook rules turned $10,000 into $2,643 across 28 pairs on the Daily chart. A tightened version lost less and still lost. Treat reversion as a condition to look for, not a system to trade. |
What Happened When We Tested The Mean Reversion Strategy
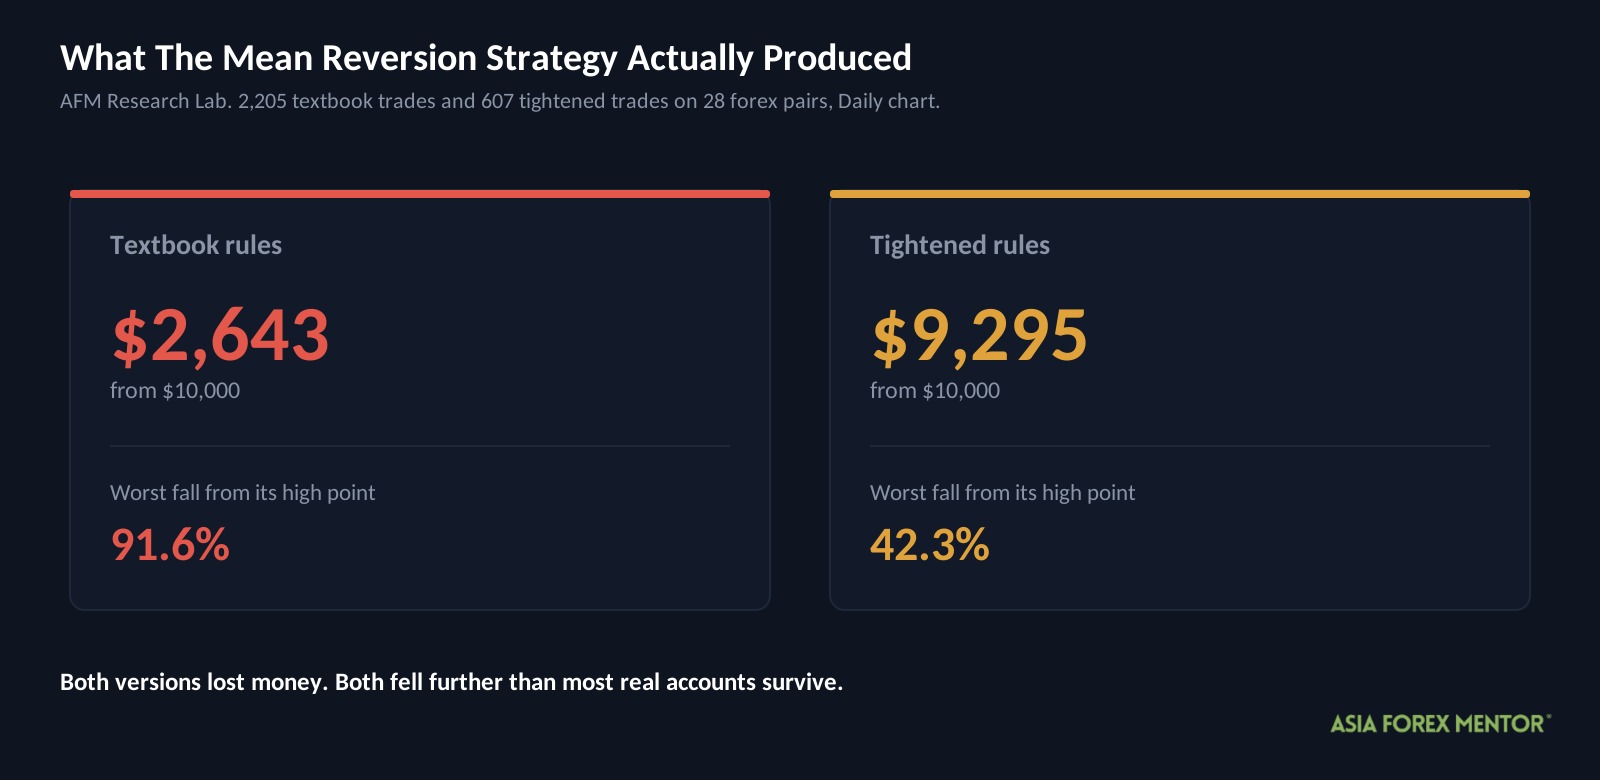
Two accounts, both starting at $10,000. One traded the rules you will find in most tutorials. The other traded a tightened version the AFM Research Lab built after the first one failed.
Both finished below where they started.
| Version | Start | End | Max drawdown |
|---|---|---|---|
| Textbook | $10,000 | $2,643 | 91.6% |
| Tightened | $10,000 | $9,295 | 42.3% |
That last column needs explaining before the rest makes sense.
Drawdown is how far an account falls from its highest point. It is not how far you are up or down overall, it is the size of the worst slide from a peak to the low that followed.
A 91.6 percent drawdown means that at one stage, more than nine tenths of the account’s peak value was gone. Getting back from there needs a gain of over 1,000 percent.
The test ran from June 14, 2016 to September 16, 2026, across 28 currency pairs on the Daily chart. Results are internal to the AFM Research Lab and the dataset is not published.
These are backtest results. Backtesting is not live trading, and past results do not guarantee future performance.
Key Takeaways
- The textbook rules lost 73.6 percent of the account over ten years, finishing at $2,643.
- The tightened rules lost less, ending at $9,295, but still fell 42.3 percent from their high point along the way.
- Tightening the entries removed 1,598 trades, which is 72 percent of everything the textbook version took.
- Two of the four time periods made money and two lost, and the best of them returned only 4.2 percent.
- The single best trade returned almost seven times its risk, which inside a 607 trade sample that merely broke even means the rest were worse than the average suggests.
What Is Mean Reversion Trading And How Does It Work?
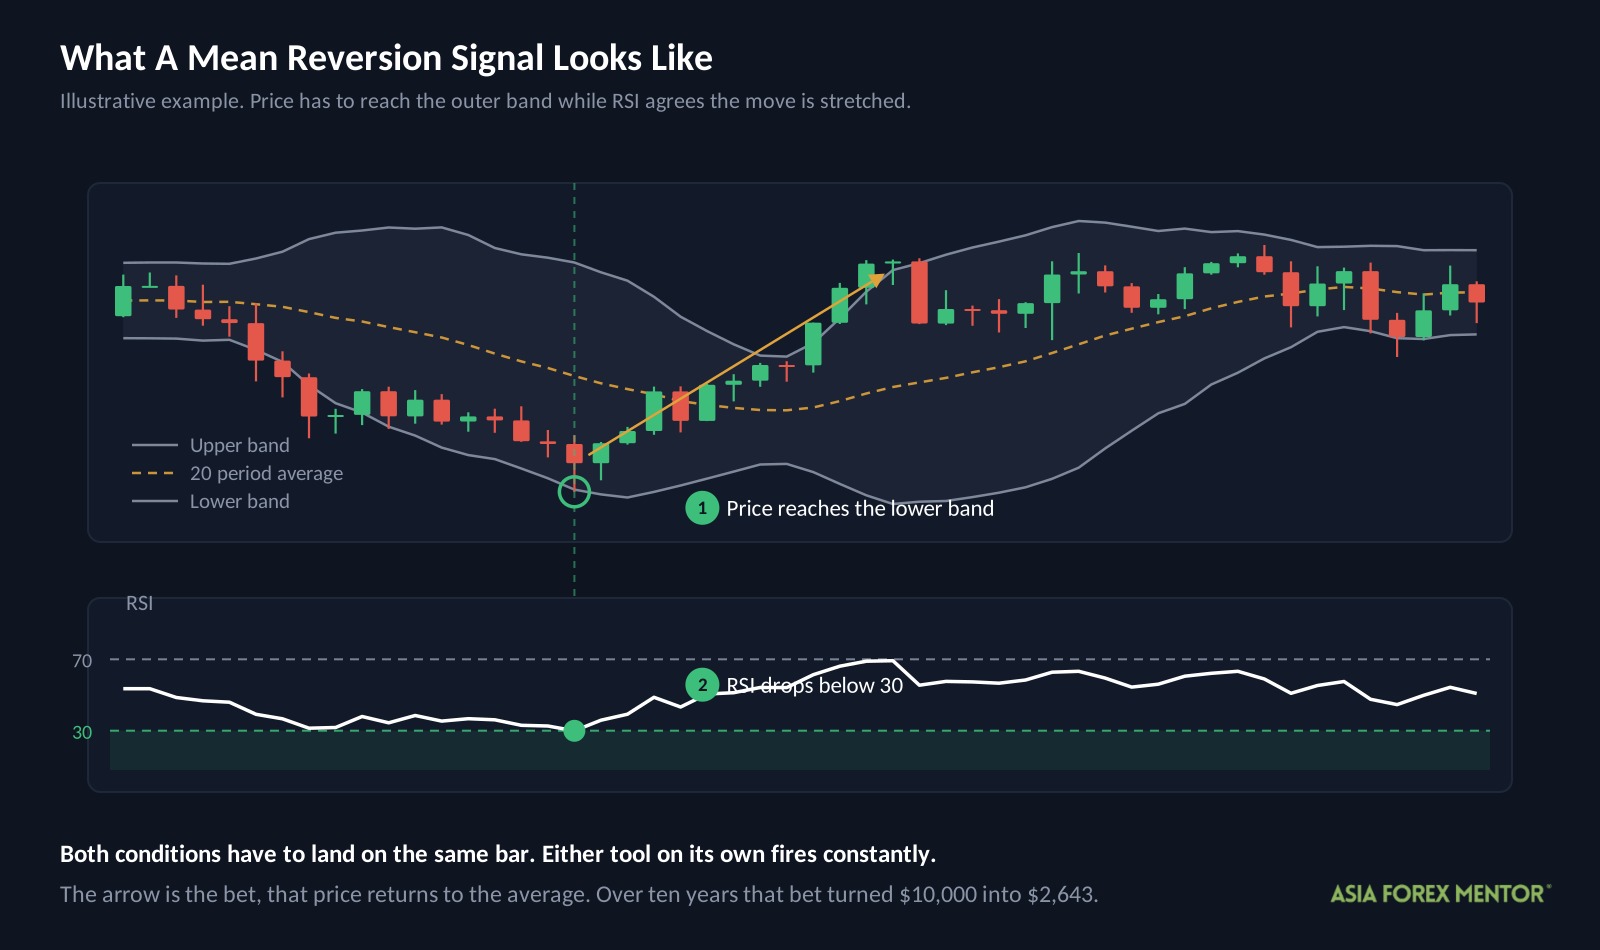
Mean reversion trading means reading how far price has stretched from its own average, then betting that the stretch closes rather than continues.
Start with the two building blocks.
Bollinger Bands are three lines on a chart. The middle one is a 20 period moving average, and the outer two sit a set distance above and below it, measured in standard deviations. A standard deviation is a way of asking how unusual a move is compared with recent history, so at 2 standard deviations the outer band marks a move bigger than roughly 95 percent of recent moves.
RSI, the Relative Strength Index, is a number between 0 and 100 that compares recent up closes against recent down closes. Below 30 is usually called oversold and above 70 overbought.
A signal forms when both agree. Price has to reach the outer band and RSI has to confirm the move is stretched, because either tool on its own fires constantly.
The appeal is obvious. Buy low, sell high, with two indicators telling you when. That simplicity is also why it is the first strategy most traders meet.
How Do Most Traders Trade Mean Reversion?
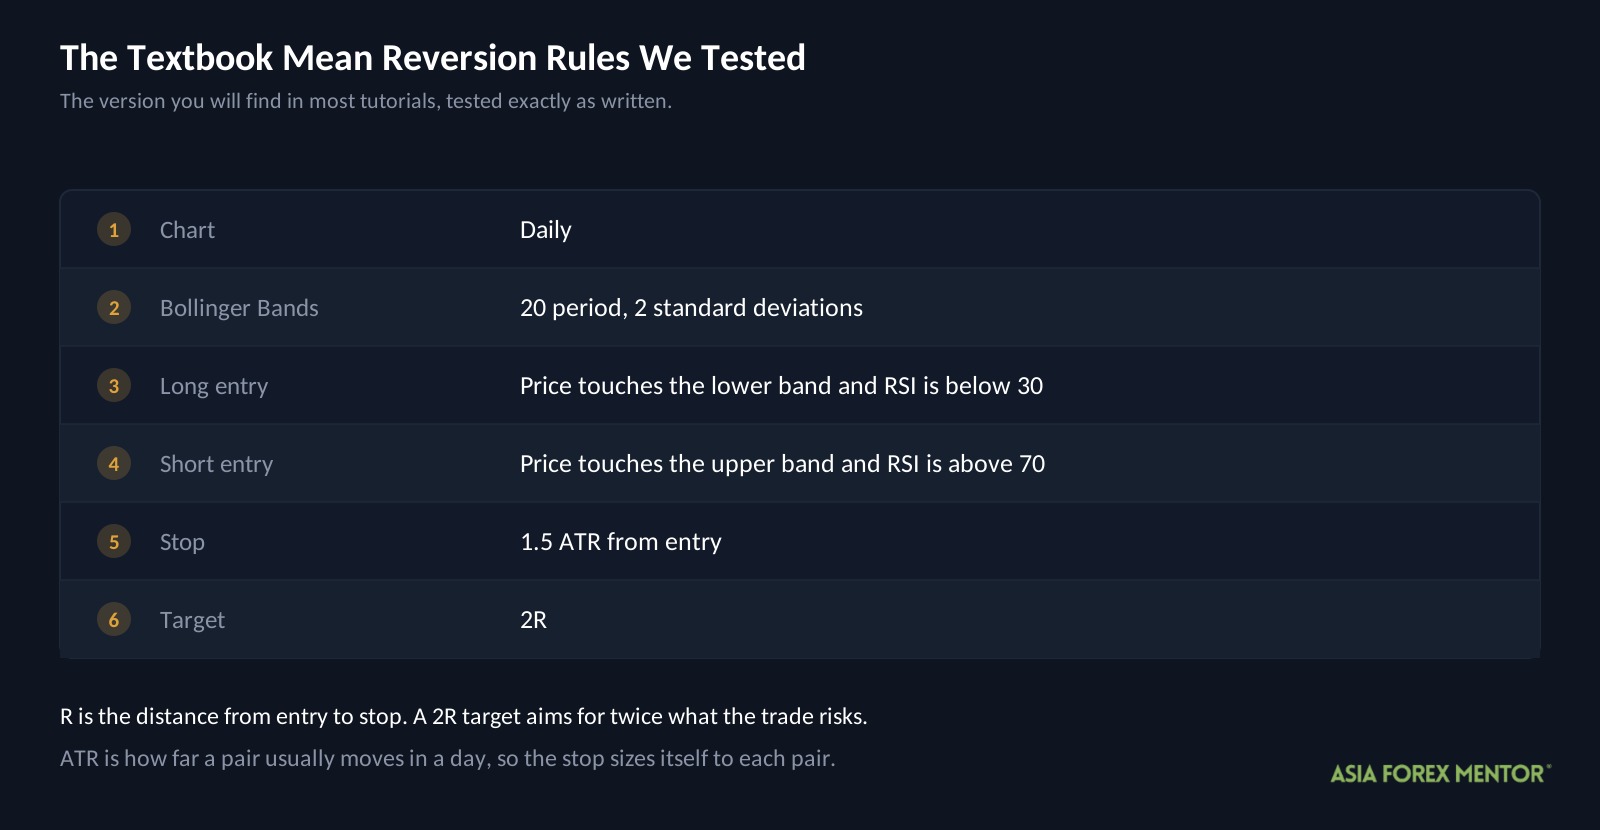
They wait for the band touch, check RSI, and let a stop and a fixed target handle the rest.
Two terms you need first.
ATR means Average True Range. It is how much a pair usually moves in a day, so a stop set in ATR sizes itself to each pair instead of using the same number of pips everywhere.
R is what you risk on one trade, measured from entry to stop. If your stop sits 50 pips away then 1R is 50 pips, and a 2R target sits 100 pips from entry.
Here are the rules exactly as we tested them.
- Add Bollinger Bands set to 2 standard deviations on the Daily chart, alongside RSI.
- Go long when price touches the lower band and RSI is below 30.
- Go short when price touches the upper band and RSI is above 70.
- Place the stop 1.5 ATR from entry.
- Set the target at 2R.
Does The Textbook Version Make Money?
No. Over 2,205 trades and ten years, it lost nearly three quarters of the account.
| Metric | Textbook |
|---|---|
| Trades | 2,205 |
| Win rate | 34% |
| Expectancy | -0.05R |
| Profit factor | 0.93 |
| Max drawdown | 91.6% |
| Ending balance from $10,000 | $2,643 |
Two of those need defining.
Expectancy is what the average trade earns or loses, measured in R. At negative 0.05R, every trade gave back roughly a twentieth of what it risked, and 2,205 of those is what empties an account.
Profit factor is total winnings divided by total losses. Above 1 means the strategy made money. At 0.93, it paid out 93 cents for every dollar it took in.
A 34 percent win rate is not the problem on its own. A 2R target only needs about 34 percent of trades to win just to break even, so the strategy was landing almost exactly where it needed to be and still bleeding out on costs and near misses.
Cutting your risk per trade would shrink that 91.6 percent drawdown. It would not fix anything. You cannot risk manage your way out of a strategy that loses on average, you can only lose more slowly.
What Settings Did We Change And Why?
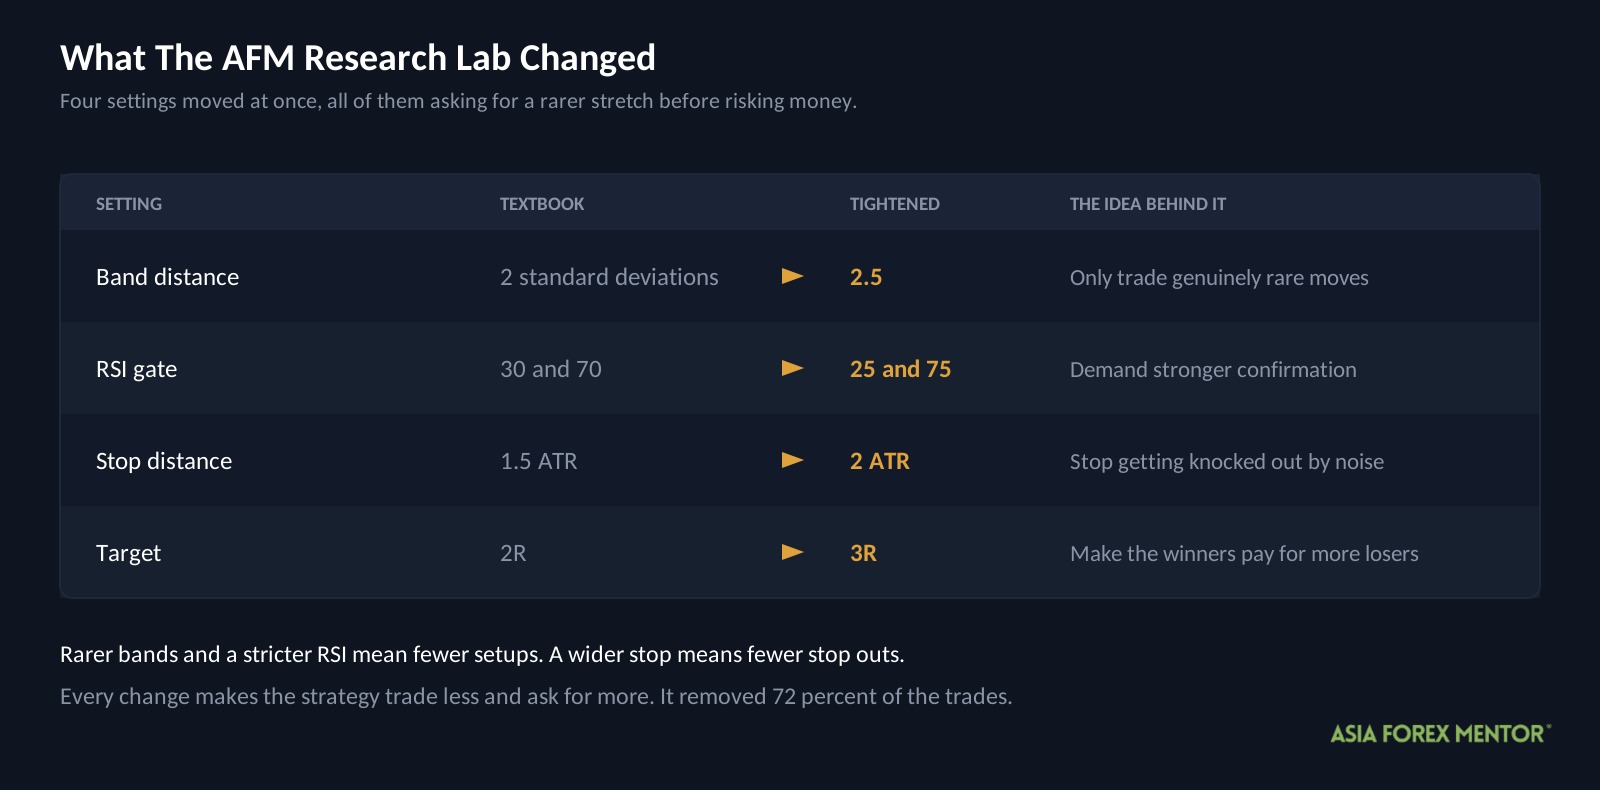
The logic behind mean reversion is not stupid. Stretched prices really do snap back sometimes, so the question was whether the signal was simply too loose.
The AFM Research Lab tightened four things at once, all with the same purpose, which was to demand a rarer stretch before risking money.
| Setting | Textbook | Tightened | The idea behind it |
|---|---|---|---|
| Band distance | 2 standard deviations | 2.5 | Only trade genuinely rare moves |
| RSI gate | 30 and 70 | 25 and 75 | Demand stronger confirmation |
| Stop distance | 1.5 ATR | 2 ATR | Stop getting knocked out by noise |
| Target | 2R | 3R | Make the winners pay for more losers |
Notice what the four changes have in common. Rarer bands and a stricter RSI mean fewer setups. A wider stop means fewer stop outs. A bigger target means fewer winners are needed to come out ahead.
Every change makes the strategy trade less and ask for more. That is the opposite of what most traders do when a system stops working.
Did The New Settings Work?
They cut the losses. They did not produce a profit.
| Metric | Textbook | Tightened |
|---|---|---|
| Trades | 2,205 | 607 |
| Win rate | 34% | 31% |
| Expectancy | -0.05R | 0.00R |
| Profit factor | 0.93 | 1.00 |
| Max drawdown | 91.6% | 42.3% |
| Ending balance from $10,000 | $2,643 | $9,295 |
The filters removed 1,598 trades, which is 72 percent of everything the textbook version took. That alone tells you how much of the original signal was noise.
What survived broke even. A profit factor of exactly 1.00 and an expectancy of 0.00R mean the strategy won back almost precisely what it lost, and the shortfall to $9,295 is what trading costs took out of it.
Look at the win rate though. It went down, not up. Tighter entries did not make the strategy more accurate, they made the losses smaller relative to the wins, which is a different thing entirely.
And a 42.3 percent drawdown is not a repair. The limit most traders work to is 30 percent. This version is still well past it.
Did The Result Hold In Every Time Period?
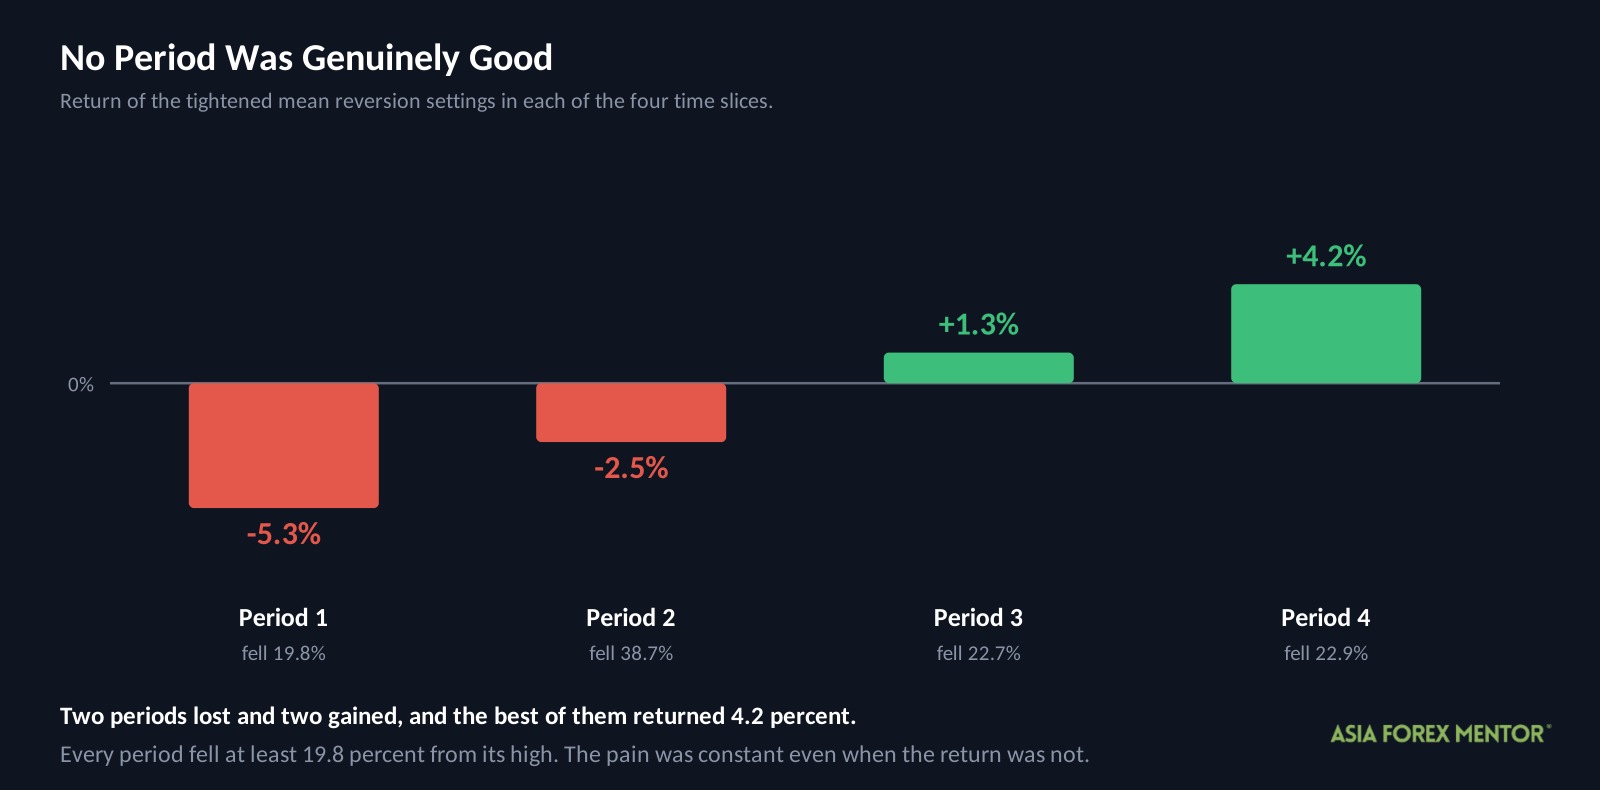
We split the tightened trades into four slices by date and scored each one on its own. This is walk forward testing, and it is the difference between a student’s year end average and their report card term by term.
| Period | Return | Max drawdown |
|---|---|---|
| 1 | -5.3% | 19.8% |
| 2 | -2.5% | 38.7% |
| 3 | +1.3% | 22.7% |
| 4 | +4.2% | 22.9% |
Two slices lost and two made money, and the best of them returned 4.2 percent. There is no stretch of the last decade where this setup was genuinely good.
The drawdown column is the more useful one. Every single period fell at least 19.8 percent from its high, and one fell 38.7 percent while losing money overall. The pain was constant even when the return was not.
What Does A Winning Trade Look Like?
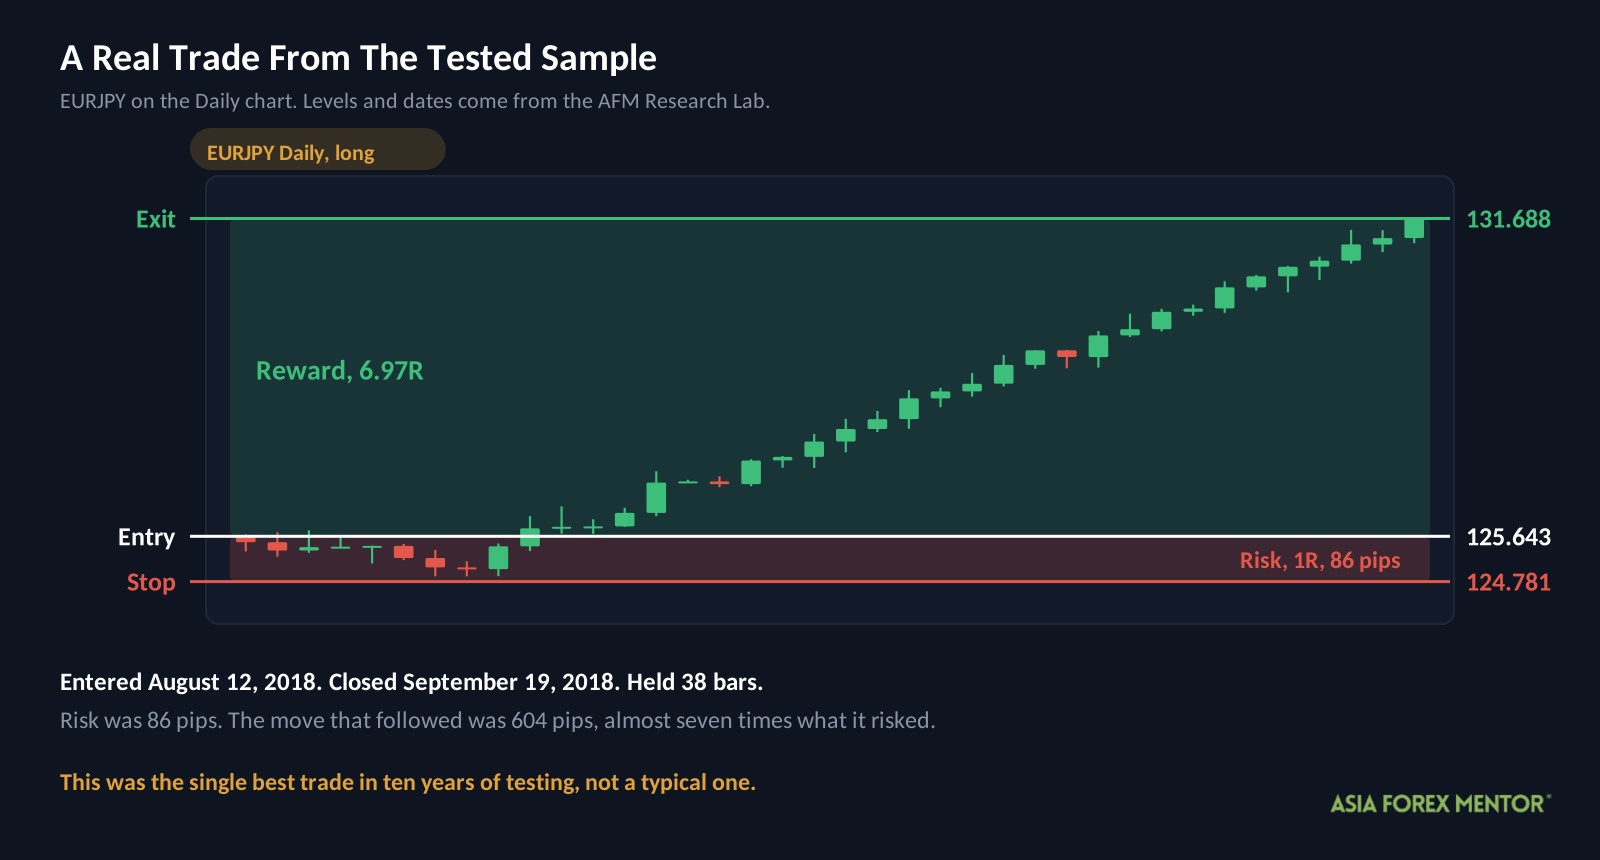
This is a real trade from the tested sample. It is also the best one in ten years, so read it as the rules working rather than a typical month.
| Detail | Value |
|---|---|
| Pair and chart | EURJPY, Daily |
| Direction | Long, meaning a buy |
| Entry | August 12, 2018 at 125.643 |
| Stop | 124.781 |
| Exit | September 19, 2018 at 131.688 |
| Result | +6.97R in 38 bars |
Price stretched below the lower band with RSI oversold, the rules bought at 125.643, and the stop went 86 pips below at 124.781.
Then it took five weeks. Price climbed 604 pips and the trade closed on September 19, 2018, returning almost seven times what it risked.
Here is the uncomfortable part. One trade returning 6.97R inside a 607 trade sample that still only broke even means everything else was worse than the headline numbers feel. A strategy that leans on rare outliers is fragile, because missing one leaves you holding the losses without the payoff.
What About The Losing Trades?
Almost seven out of ten trades in the tightened version lost.
That is survivable if the winners are large enough, and here they were not large enough by any margin worth trading. An expectancy of 0.00R across 607 trades means ten years of work for nothing.
The split by pair is just as uncomfortable. NZDUSD, AUDCAD and EURJPY held up best, while USDZAR and USDCAD were the worst of the 28.
That spread fits what the strategy is doing. The pairs that trend hardest punished it most, because a currency in a policy driven trend does not snap back when it looks stretched, it grinds on.
How Should You Practice Mean Reversion Trading?
I would not trade these rules with real money. Spotting a stretched market is still a skill worth having, so here is how I would build it.
- Open a Daily chart on one pair and add Bollinger Bands at 2.5 standard deviations plus RSI.
- Scroll back two years and mark every point where price touched an outer band with RSI past 75 or below 25.
- From each mark, write down the entry, a 2 ATR stop and a 3R target.
- Walk the chart forward one bar at a time and record whether the stop or the target came first.
- Do that for at least twenty signals by hand before you trust any automated version.
- Check your results pair by pair, because the Lab found some pairs behaved nothing like others.
- Split your results into four date ranges and check whether each one made money on its own.
- Mark which signals appeared while the pair was trending and which appeared while it was ranging, then score those two groups separately.
That last step is the one most people skip. It is also the only step that points at a fix.
Is Mean Reversion Trading Worth Your Time?
As a system, no. As a condition to recognize on a chart, yes.
- The textbook rules turned $10,000 into $2,643 across 2,205 trades, with a 91.6 percent max drawdown.
- The tightened rules removed 72 percent of those trades and still finished at $9,295, carrying a 42.3 percent max drawdown.
- Two of four time periods lost money, and the best period returned 4.2 percent.
Knowing that price has stretched tells you something real about a chart. It just does not tell you the stretch is finished, and that gap is where ten years of losses came from. Reading market structure first, so you know whether a pair is trending or ranging, is the change most likely to turn this into something worth testing again.
Also Read: Does Market Structure Trading Work? 1,402 Trades Tested
Frequently Asked Questions
Is Mean Reversion Trading Profitable On Its Own?
Not as a mechanical system, going by this test. Neither the textbook version nor the tightened version made money over ten years, and both fell further from their highs than most accounts survive.
What Do Bollinger Bands And RSI Actually Measure?
Bollinger Bands measure how far price has moved from its 20 period average, in standard deviations. RSI measures the balance between recent up closes and down closes on a scale of 0 to 100. Together they describe how stretched a move is.
What Does ATR Mean In A Stop Loss Rule?
ATR stands for Average True Range, which is how much a pair usually moves in a day. Setting a stop in ATR means the stop sizes itself to each pair, instead of using the same pip distance on a quiet pair and a wild one.
Why Did The Win Rate Fall When The Rules Got Stricter?
Stricter entries removed trades rather than removing bad trades specifically. The tightened version won 31 percent against 34 percent, but its losses shrank relative to its wins, which is why the overall result still improved.
Is A 42.3 Percent Drawdown Acceptable?
No. Thirty percent is the ceiling most traders work to. An account down 42.3 percent needs a 73 percent gain just to return to its starting point, and most people abandon a system long before they get there.
Why Does A Walk Forward Test Matter?
Because an average can hide everything. Splitting ten years into four periods showed the best stretch returned only 4.2 percent and every stretch fell at least 19.8 percent from its high. Without that split the strategy looks merely weak instead of broken.
Could Adding A Trend Filter Fix This Strategy?
It is the most promising change. The pairs that trended hardest were the worst performers, which points at trending conditions as the main source of losses. Testing these rules only while a pair is ranging would be a separate experiment.