Singapore
 Malaysia
 Indonesia
 Philippines
 Thailand
 Vietnam
 Cambodia
 Myanmar
 Brunei
 China
China Japan
Japan South Korea
 Taiwan
 India
India Australia
  New Zealand
 United Kingdom
 Switzerland
 Italy
Italy Spain
Spain UAE
UAE United States
 Mexico
 Argentina
 South Africa
 IC Markets
 Pepperstone
 AvaTrade
 XM
XM Plus500
 RoboForex
 TMGM
TMGM Exness
 JustMarkets
 Orbex
Orbex Interactive Brokers
 Saxo
Saxo Tiger Brokers
 Binance
 Coinbase
 Gemini Exchange
 Kraken
 iFunds
 IC Funded
 The 5%ers
 TopStep
 IQ Option
 Pocket Option
 RaceOption
 IQCent

Most traders learn the ICT order block from a chart that was picked after the move was over. On that kind of chart, the setup always looks perfect. So we ran the rules through the AFM Research Lab on 28 pairs and 9.9 years of Daily data.
I will show you the rules, the losses, and what each failure teaches you.
| About This Guide | |
|---|---|
| This guide explains what an ICT order block is, how to mark one on a chart, and the exact entry, stop and target rules we put through the AFM Research Lab. It then shows what happened when those rules were tested on 28 forex pairs across 9.9 years of Daily data, including the losses, the drawdowns and the trades that went wrong. You will finish knowing how to read an order block, what the tested results actually say, and what would have to change before the setup is worth real money. |
| Quick Answer | |
|---|---|
| An ICT order block is the last opposite candle before a strong move. Traders use it as a zone where price may react when it returns. In the AFM Research Lab, both the textbook rules and the tuned rules lost money on 28 pairs on the Daily chart. Treat it as a way to read price, not a system. |
What Happened When We Tested It?
We started two accounts with $10,000 each. One traded the rules most people are taught. The other traded a tuned version that we built after the first one failed.
Both accounts finished down.
| Textbook rules | Filtered rules | |
|---|---|---|
| $10,000 became | $571 | $8,018 |
| Max drawdown | 95.4% | 34.4% |
| Trades | 5,242 | 311 |
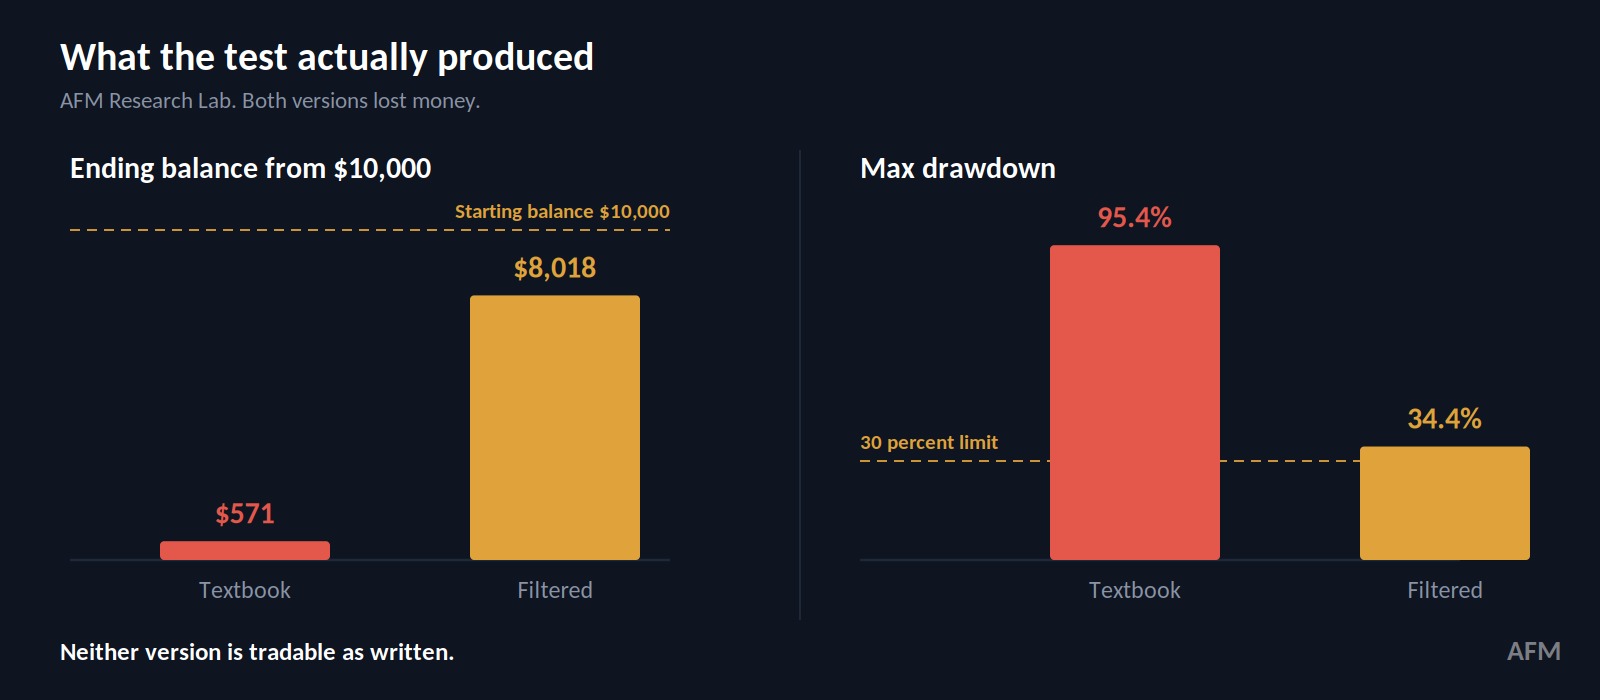
That is the whole finding in one table. The rest of this guide explains what each version was, why we changed what we changed, and what the numbers underneath those two balances actually say.
These are backtest results from the AFM Research Lab. Backtesting is not live trading, and past results do not guarantee future performance.
Key Takeaways
- Both tested versions of the ICT order block lost money on the Daily chart across 28 pairs.
- The textbook version had a profit factor of 0.93 and a max drawdown of 95.4 percent.
- The filtered version also had a profit factor of 0.93, and its max drawdown of 34.4 percent means it is not tradable as written.
- The filtered settings came from a grid search over the full history, which is in-sample optimization.
- The four time slices disagreed in sign, so the result did not hold consistently across time.
What Is An ICT Order Block?
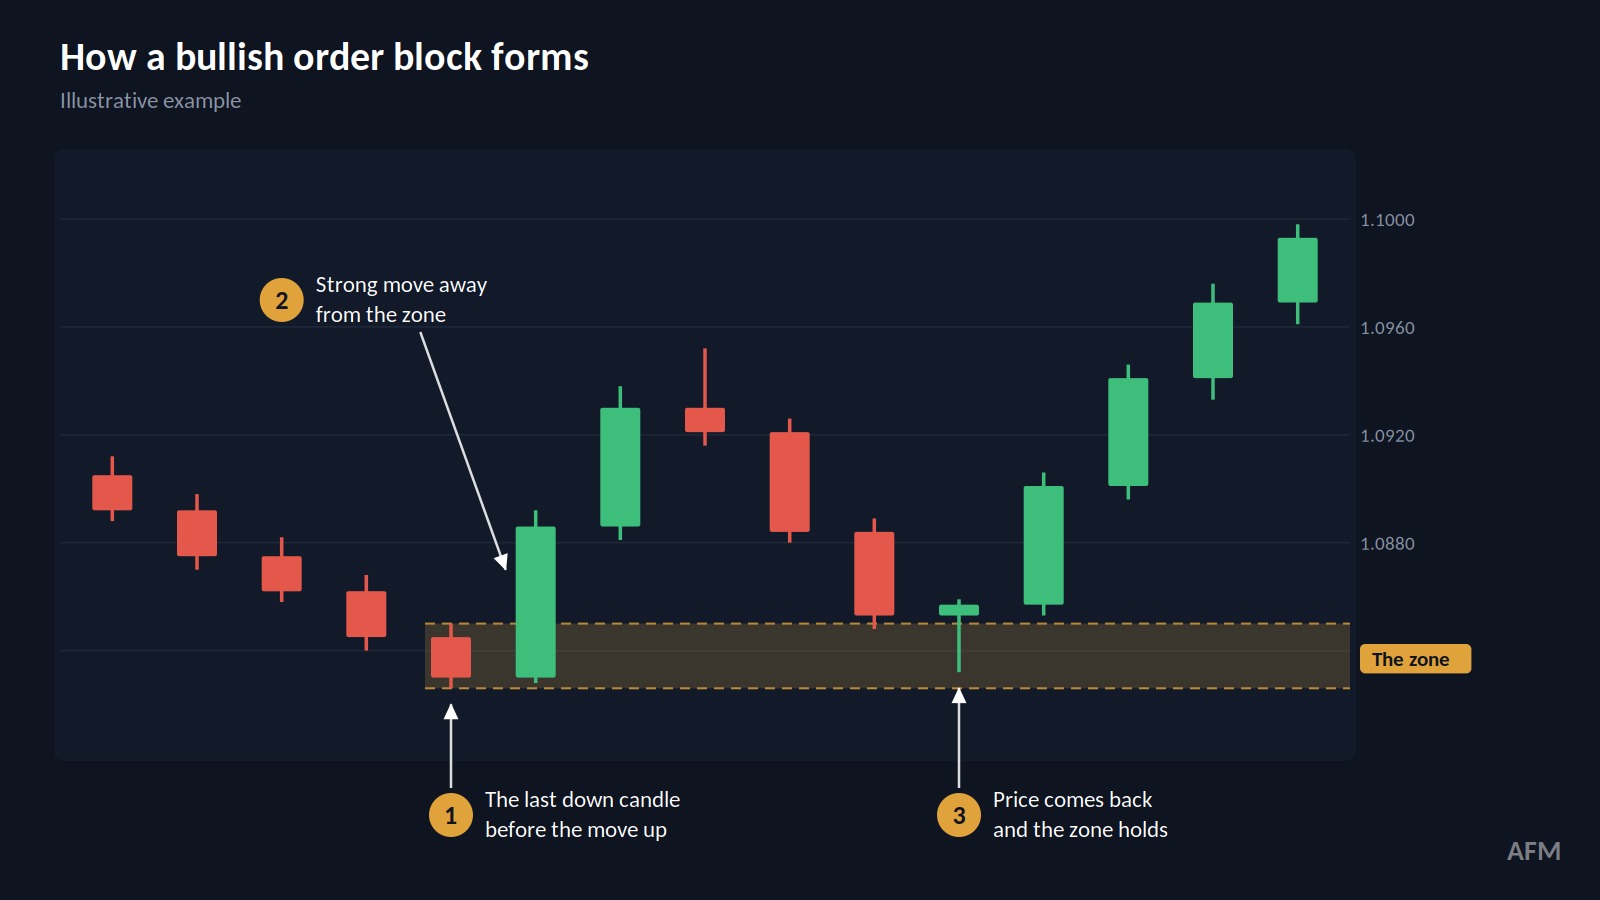
Price does not move in a straight line. It pushes, pauses, and then pushes again. An order block is the idea that a strong push leaves a footprint you can trade later.
A bullish order block is the last down candle before a strong move up. A bearish order block is the last up candle before a strong move down. The high and low of that candle mark out a zone on your chart.
The thinking behind it goes like this. Big traders could not fill all of their orders inside that one candle, so some orders may still be waiting there. When price comes back to the zone, those orders may push price away again, and that return is the trade.
How Do Most Traders Trade It?
This is the version you will find in almost every tutorial. We tested it exactly as taught.
One term first. ATR stands for average true range. It tells you how far a pair usually moves in one candle. A move that is huge on one pair can be normal on another, so ATR lets you compare pairs fairly. Our guide to the ATR indicator covers it in full.
Textbook version checklist:
- Use the Daily chart.
- Look for a move away from a candle of at least 2 ATR. That candle is your order block.
- Keep the block live for up to 50 bars, then drop it.
- Plan to enter when price returns to the block.
- Place your stop beyond the far side of the block, plus 0.2 ATR.
- Set your target at 2R.
- Use a time limit setting of 30 bars.
- Risk 1 percent of your account on each trade.
What The Textbook Version Produced
Three more terms before the table, because you need them to read it.
R is the amount of money you risk on one trade. If your stop is hit, you lose about that amount. If price reaches a 2R target, you make about twice what you risked.
Expectancy is the average result of one trade, measured in R. If it is negative, the average trade loses money.
Profit factor is the money won divided by the money lost. Above 1 means the strategy made money. Below 1 means it lost.
| Metric | Textbook rules |
|---|---|
| Trades | 5,242 |
| Win rate | 35% |
| Expectancy | -0.05R |
| Profit factor | 0.93 |
| CAGR | -25.1% |
| Max drawdown | 95.4% |
| Average win | 1.83R |
| Average loss | -1.03R |
| Ending balance from $10,000 | $571 |
The textbook version is not tradable as written. A max drawdown of 95.4 percent would wipe out almost any real account long before the ten years were up.
It also took 528.5 trades a year. That is the real problem underneath the number. Almost every small push counted as an order block, and most of those zones meant nothing.
What Did We Change And Why?
We made five changes. Each one had a reason.
| Change | From | To | Why |
|---|---|---|---|
| Move size | 2 ATR | 4 ATR | Only count a push big enough to be real |
| Block age | 50 bars | 20 bars | An old zone has had time for waiting orders to be used up |
| Stop buffer | 0.2 ATR | 0.1 ATR | Tighter stop, smaller risk per trade |
| Target | 2R | 4R | Pay for a lower win rate with bigger winners |
| Time limit | 30 bars | 10 bars | Stop holding trades that are going nowhere |
Raising the move size did the heavy lifting. It cut the strategy from 528.5 trades a year down to 31.4.
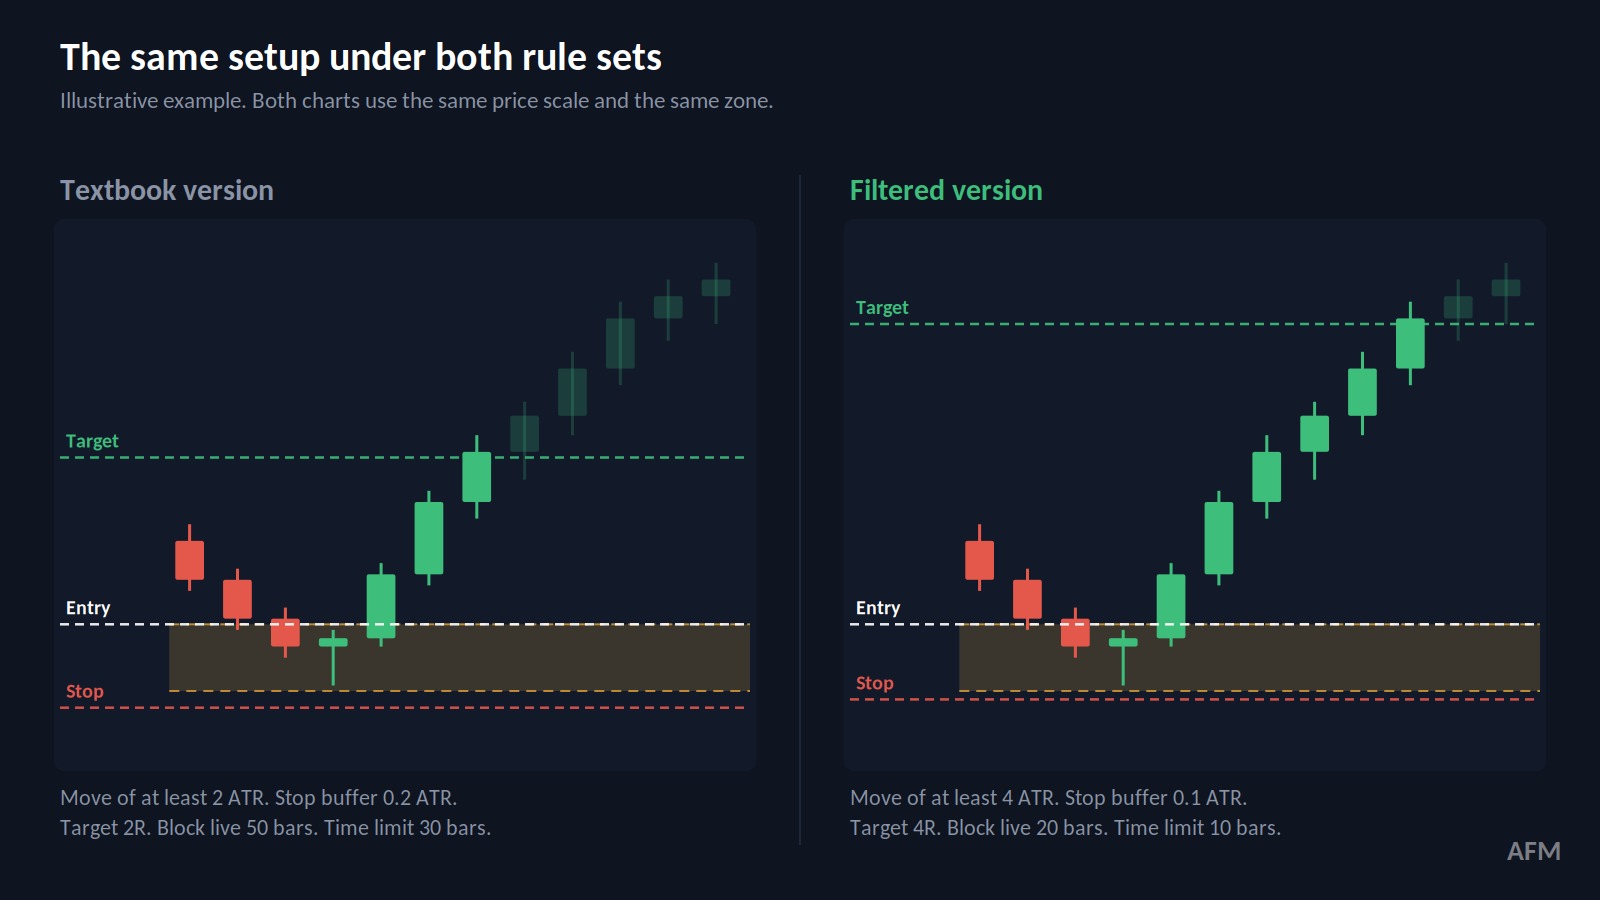
The bigger target changed the shape of the results. The win rate fell from 35 percent to 27 percent, but the average win grew from 1.83R to 2.62R.
Did The Changes Work?
They cut the damage. They did not fix the problem.
| Metric | Textbook | Filtered |
|---|---|---|
| Trades | 5,242 | 311 |
| Win rate | 35% | 27% |
| Expectancy | -0.05R | -0.06R |
| Profit factor | 0.93 | 0.93 |
| CAGR | -25.1% | -2.2% |
| Max drawdown | 95.4% | 34.4% |
| Average win | 1.83R | 2.62R |
| Average loss | -1.03R | -1.03R |
| Largest win | 1.95R | 3.95R |
| Ending balance from $10,000 | $571 | $8,018 |
Look at the profit factor row. It is 0.93 in both columns. Expectancy stayed negative too.
The edge did not get better. The filter only ran the same losing edge 311 times instead of 5,242 times, so the account bled slower. That is the finding.
The filtered version is still not tradable as written. Its 34.4 percent drawdown sits above the 30 percent line we use as a limit.
How We Ran The Test
We tested 28 forex pairs on the Daily chart, which was the only chart timeframe in this test. The textbook version took 5,242 trades. For the filtered version, we ran a grid search over 12 parameter combinations across the full test history, and the chosen settings took 311 trades.
We split the filtered trades into 4 walk-forward folds in time order. We also ran 1,000 Monte Carlo simulations that reshuffle the order of the trades. Results are internal to the AFM Research Lab and the dataset is not published.
The Settings Were Tuned On The Same Data
The filtered settings were picked because they scored best across the full history. That is in-sample optimization. The test already knew the answers, so live results are usually worse than what you see here. [EXTERNAL LINK 2 goes on “in-sample optimization”, pointing to the peer reviewed work on backtest overfitting]
The Time Slices Did Not Agree
| Fold | Period | Trades | Win rate | Expectancy | CAGR | Max drawdown |
|---|---|---|---|---|---|---|
| 1 | Jun 16, 2016 to Dec 8, 2018 | 63 | 24% | -0.50R | -12.3% | 27.4% |
| 2 | Dec 8, 2018 to May 30, 2021 | 100 | 28% | +0.03R | +0.4% | 19.4% |
| 3 | May 30, 2021 to Nov 20, 2023 | 68 | 34% | +0.38R | +10.9% | 11.0% |
| 4 | Nov 20, 2023 to May 12, 2026 | 79 | 20% | -0.18R | -6.2% | 25.9% |
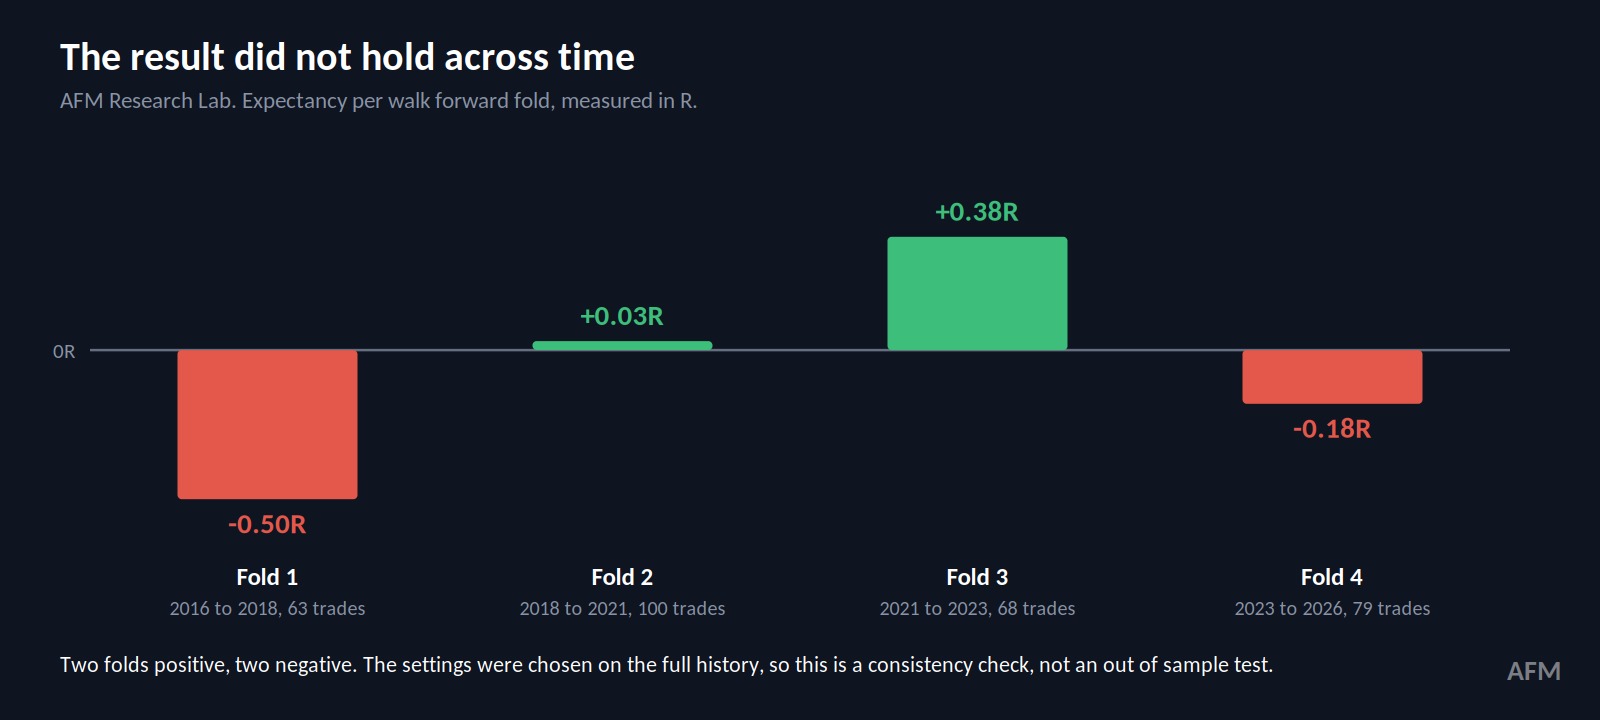
Two of the four folds had positive expectancy. Two were negative.
The strategy did not behave the same way in every period. That matters more than the average. If you only look at the overall number, you miss the fact that half the test window lost money.
There is a second catch. The settings were chosen using the full history, and that history includes all four folds. So these folds show whether the result was steady over time. They do not show how the strategy would do on data it had never seen.
The Drawdown Range Is Wide
Reshuffling the order of trades cannot change the compounded return, so every Monte Carlo run gave the same CAGR. That is how the math works, and it is not a sign of strength. The Monte Carlo only tells you about drawdowns.
The median max drawdown was 35.1 percent. The 5th percentile was 26.4 percent and the 95th percentile was 46.6 percent. The blow-up rate was 0.0 percent, but a drawdown that deep would push most traders to quit long before the account was empty.
Results By Pair Were Scattered
AUDCAD had 7 trades with an expectancy of 1.09R. EURUSD had 6 trades with a win rate of 0 percent.
Samples that small tell you very little. Picking the best pairs after the fact would just be more in-sample fitting.
What Does One Trade Look Like?
This is a real trade from the tested data. It used the filtered rules on the Daily chart.
| Pair | AUDCAD |
|---|---|
| Timeframe | Daily |
| Direction | Long |
| Setup | Bullish order block, filtered rules |
| Entry | March 16, 2022 at 0.92430 |
| Stop | 0.91940 |
| Target | 0.94390 |
| Exit | March 24, 2022 at 0.94390, hit the target |
| Result | +3.95R, held 6 bars |
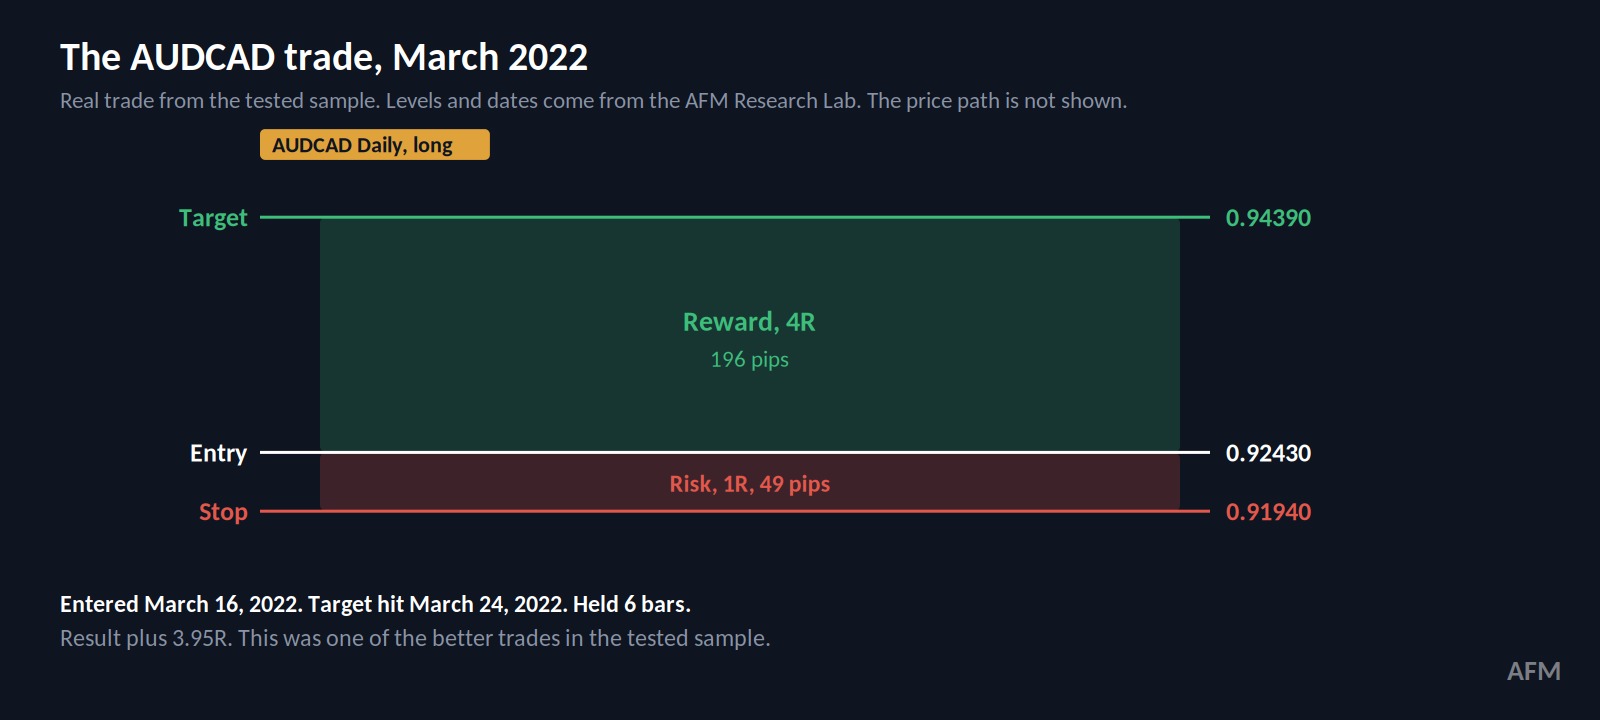
Here is how the rules played out. Price pushed up and left a block behind. Then it came back down and touched that block.
That touch was the entry. The stop went just below the block, 49 pips away. The target sat 4R above the entry, 196 pips away. Price reached it in 6 bars.
One thing to keep in mind. This was the largest win in the whole filtered sample. Most trades did not look like this, which is why the overall result still lost money.
A Loser From The Same Test
A winner like that is what gets shared online. Here is a loser from the same test.
It was a USDZAR long on the Daily chart, with entry on July 17, 2016 at 14.40326 and a stop at 14.32525. The stop was hit on the entry date for -1.05R, and the trade was held 0 bars.
All five of the worst trades in the sample were on USDZAR. A clean-looking zone does not stop price from running straight through it.
When Should You Take It And When Should You Walk Away?
Both versions lost money, so taking the trade here means taking it on a demo account or in your journal. These lines use the filtered rules.
| Check | Take it | Walk away |
|---|---|---|
| Move away from the block | At least 4 ATR | Smaller than 4 ATR |
| Block age | 20 bars or less | Older than 20 bars |
| Stop placement | You can place it 0.1 ATR beyond the block | The block edge is unclear |
| Risk | 1 percent of equity | You want to size up to win back losses |
| Time | You will respect the 10-bar limit | You plan to hold and hope |
How Should You Study This Setup?
I would not trade these rules with real money. The test says they lose. But the setup is still worth studying, so here is how I would do it.
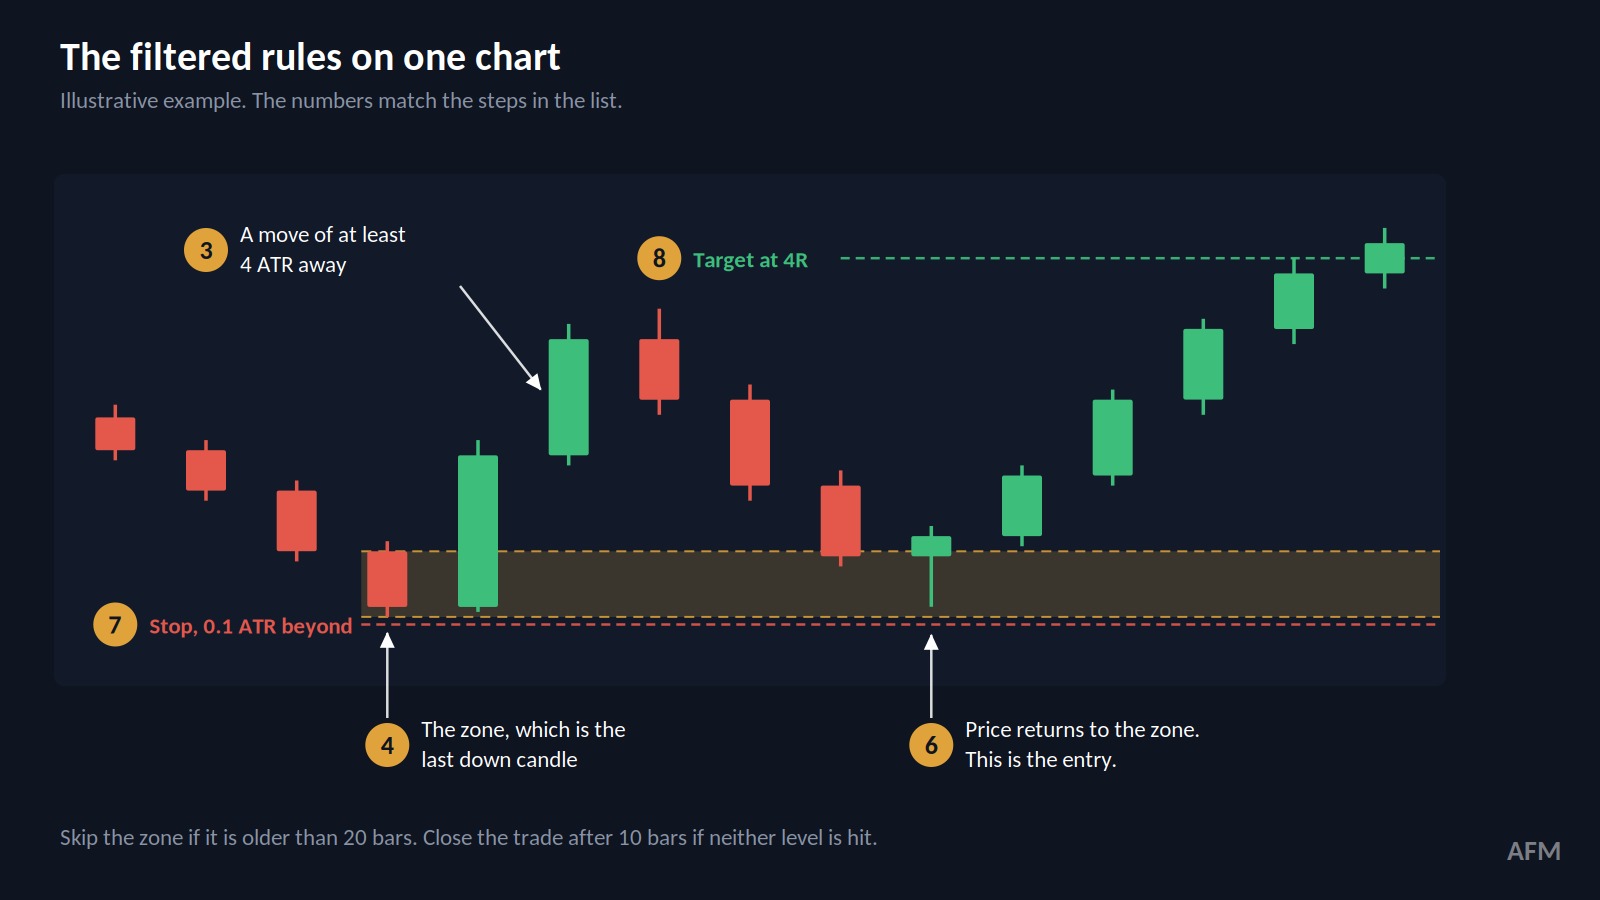
- Open a Daily chart of the pair you want to study.
- Add the ATR indicator. You need it to measure how big a move is.
- Look for a strong move away from a candle. It has to be at least 4 ATR.
- Find the last opposite candle before that move. That candle is your zone.
- Check how old the zone is. If it is older than 20 bars, skip it.
- Wait for price to come back to the zone. That is your entry.
- Put your stop 0.1 ATR past the far side of the zone.
- Put your target at 4R. Close the trade after 10 bars if nothing happens.
- Risk no more than 1 percent of your account on the trade.
- Write down every result. Log the losers too, not only the winners.
Also Read: How To Use The ATR Indicator In Forex Trading
So Is This Setup Worth Your Time?
The ICT order block gives you a clear way to mark zones on a chart. That is useful as context. But a zone you can mark is not the same as a trade that makes money, and the Lab data shows that plainly.
The textbook rules lost money with a 95.4 percent drawdown. The filtered rules lost less, but their 34.4 percent drawdown keeps them not tradable as written, and their settings were tuned on the full history. The time slices disagreed with each other, so no average from this test is a forecast.
My advice is simple. Use the order block as context for reading a chart, test any change on fresh data, and protect your account first.
Frequently Asked Questions
Is The ICT Order Block A Profitable Strategy?
Not in our tests. Both the textbook version and the filtered version lost money on the Daily chart across 28 pairs. I treat it as a way to read where price may react, not as a system.
Does This Mean Order Blocks Do Not Work?
We tested one fixed set of rules. Most traders use order blocks with judgment, and judgment cannot be backtested. So this result is about these rules, not about every way the idea gets used. What it does show is that the idea on its own, with no skill added, did not make money.
Can I Just Trade The Pairs That Did Best?
I would not. Each pair had only a handful of trades, so the good results may be luck. Choosing pairs after seeing the results is more in-sample fitting, and live results are usually worse.
Why Did The Filter Not Fix The Strategy?
It cut the damage, not the problem. Profit factor stayed at 0.93 and expectancy stayed negative. What changed was the number of trades, from 5,242 down to 311. The same losing edge simply ran fewer times, so the account bled slower.
What Would Make This Setup Tradable?
It would need a profit factor above 1 and positive expectancy in every time slice. Its max drawdown would also need to stay under 30 percent on data the settings never saw. Until then, keep it on a demo account.