Every trader who tries the opening range breakout strategy runs into the same wall. The setup looks clean. The rules look simple. Then the trades keep failing. The strategy is not broken. The version that gets taught everywhere is.
| About This Guide |
|---|
| This guide covers the opening range breakout strategy, or ORB, tested by AFM Research Lab across 2,444 trades on 28 currency pairs. It explains why the textbook version produces a 97.7 percent drawdown, and the three-step version that came back clean in testing. Every rule is mechanical. Every filter is specific. |
| Quick Answer |
|---|
| The opening range breakout strategy works when three conditions align. The daily trend has to match the trade direction. The range has to print at a level the market already respects. And the first candle to close beyond the boundary in the direction of the trend is the entry. Skip the trade if any one of these fails. |
🎥 Watch the full method explained on video:
Key Takeaways
The following points frame the strategy before each section covers it in detail:
- The textbook ORB tested across 2,444 trades produced a 97.7 percent drawdown in AFM Research Lab testing.
- Changing the timeframe from 5-minute to 15-minute to 30-minute is not the fix. Every timeframe has its own failure mode.
- The daily trend is the first filter. Trade only in the direction of higher highs and higher lows, or lower highs and lower lows.
- The range has to print at a level the market already respects. In empty space, the setup does not qualify.
- The trigger is a full body close beyond the boundary in the direction of the trend. Not a touch. Not a wick.
- One qualifying setup per session, win or lose.
If a trader had to start all over again today with a small account from scratch, this is the exact strategy to use. It is not an exciting one. It is a boring one. Because after over two decades of testing markets, the boring ones are the ones that actually survive.
And here is the part that nobody tells you. You have probably already seen this strategy. It is everywhere. The problem was not the strategy itself. It is the version that you were handed.
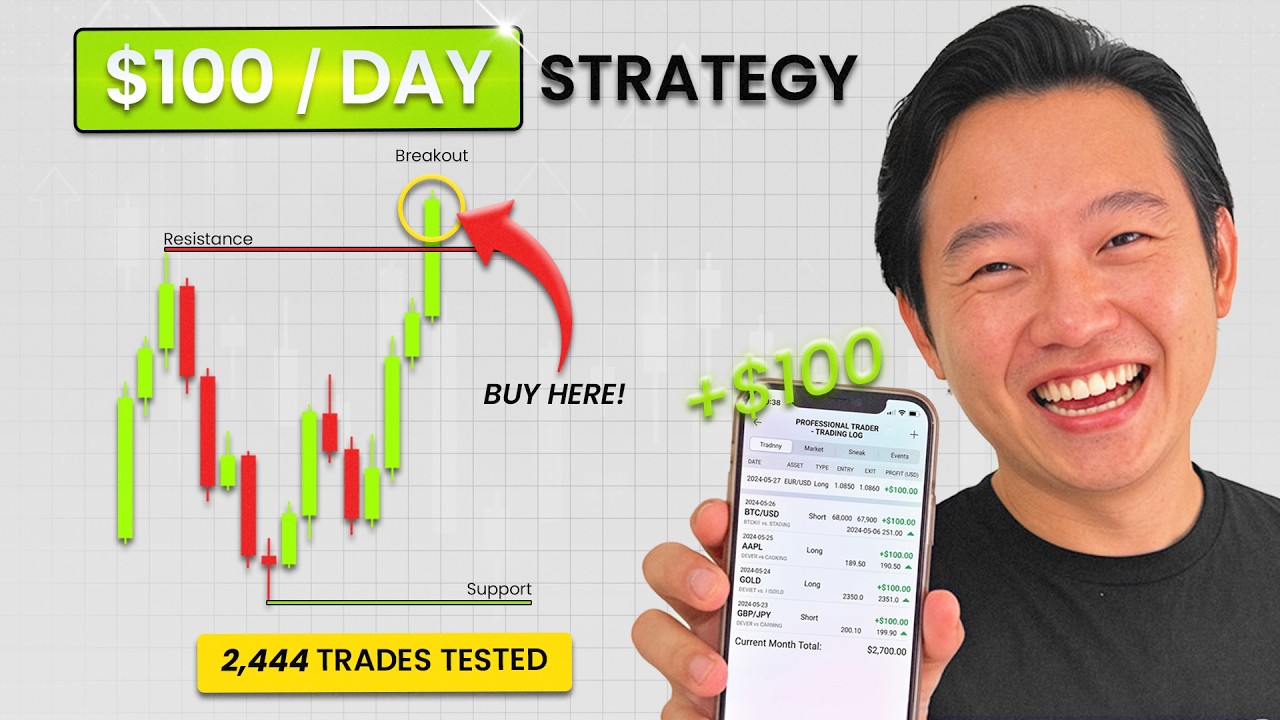
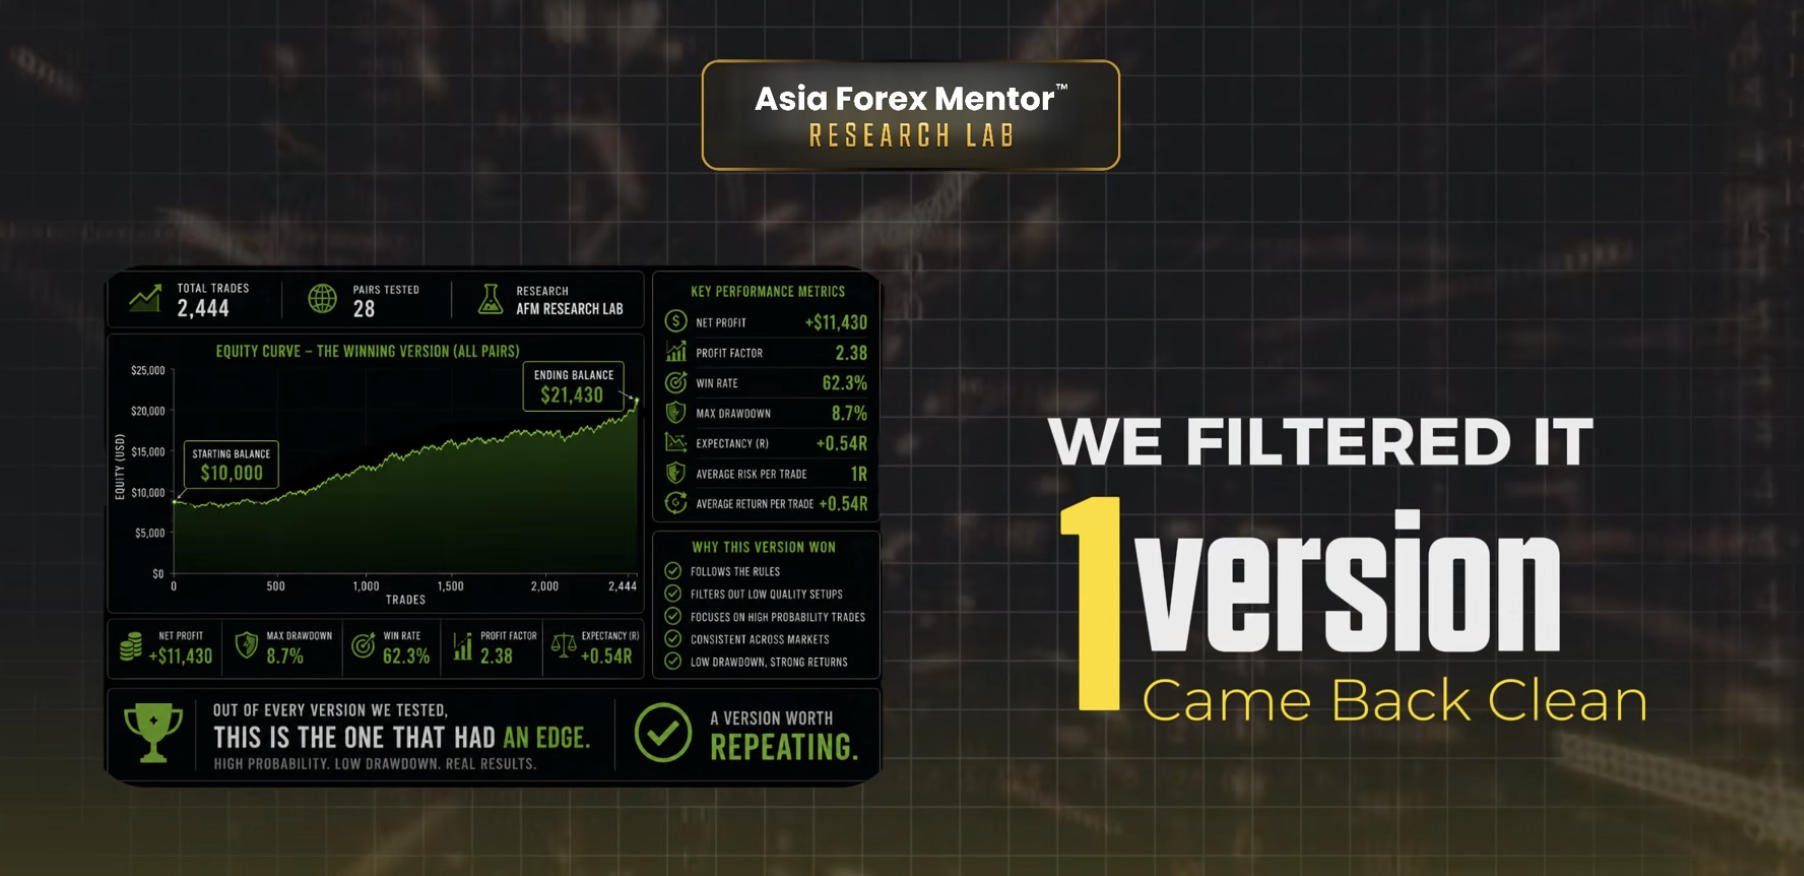
AFM Research Lab tested it. Every common version out there. 2,444 trades across 28 pairs. The textbook version, the one that is taught on every blog, every video, every trading channel, came back with a 97.7 percent drawdown.
Sit with that. It is not a rough month. It is 97 percent of the account gone.
So AFM Research Lab filtered it and ran it through the whole model. One version came back clean. High probability, low drawdown. And when it was run on data it had never seen four separate times, this version held every single time.
The Opening Range Breakout Strategy
The strategy is the opening range breakout strategy, the ORB strategy.
Here is how it works. You mark the highs and the lows of the first 15-minute candle. That is your range. You trade whichever side price breaks, whether it is up or down. You put your stop loss at the opposite side of your entry. And you have a fixed target. It is simple. It is mechanical. And it is on a lot of trading channels out there.
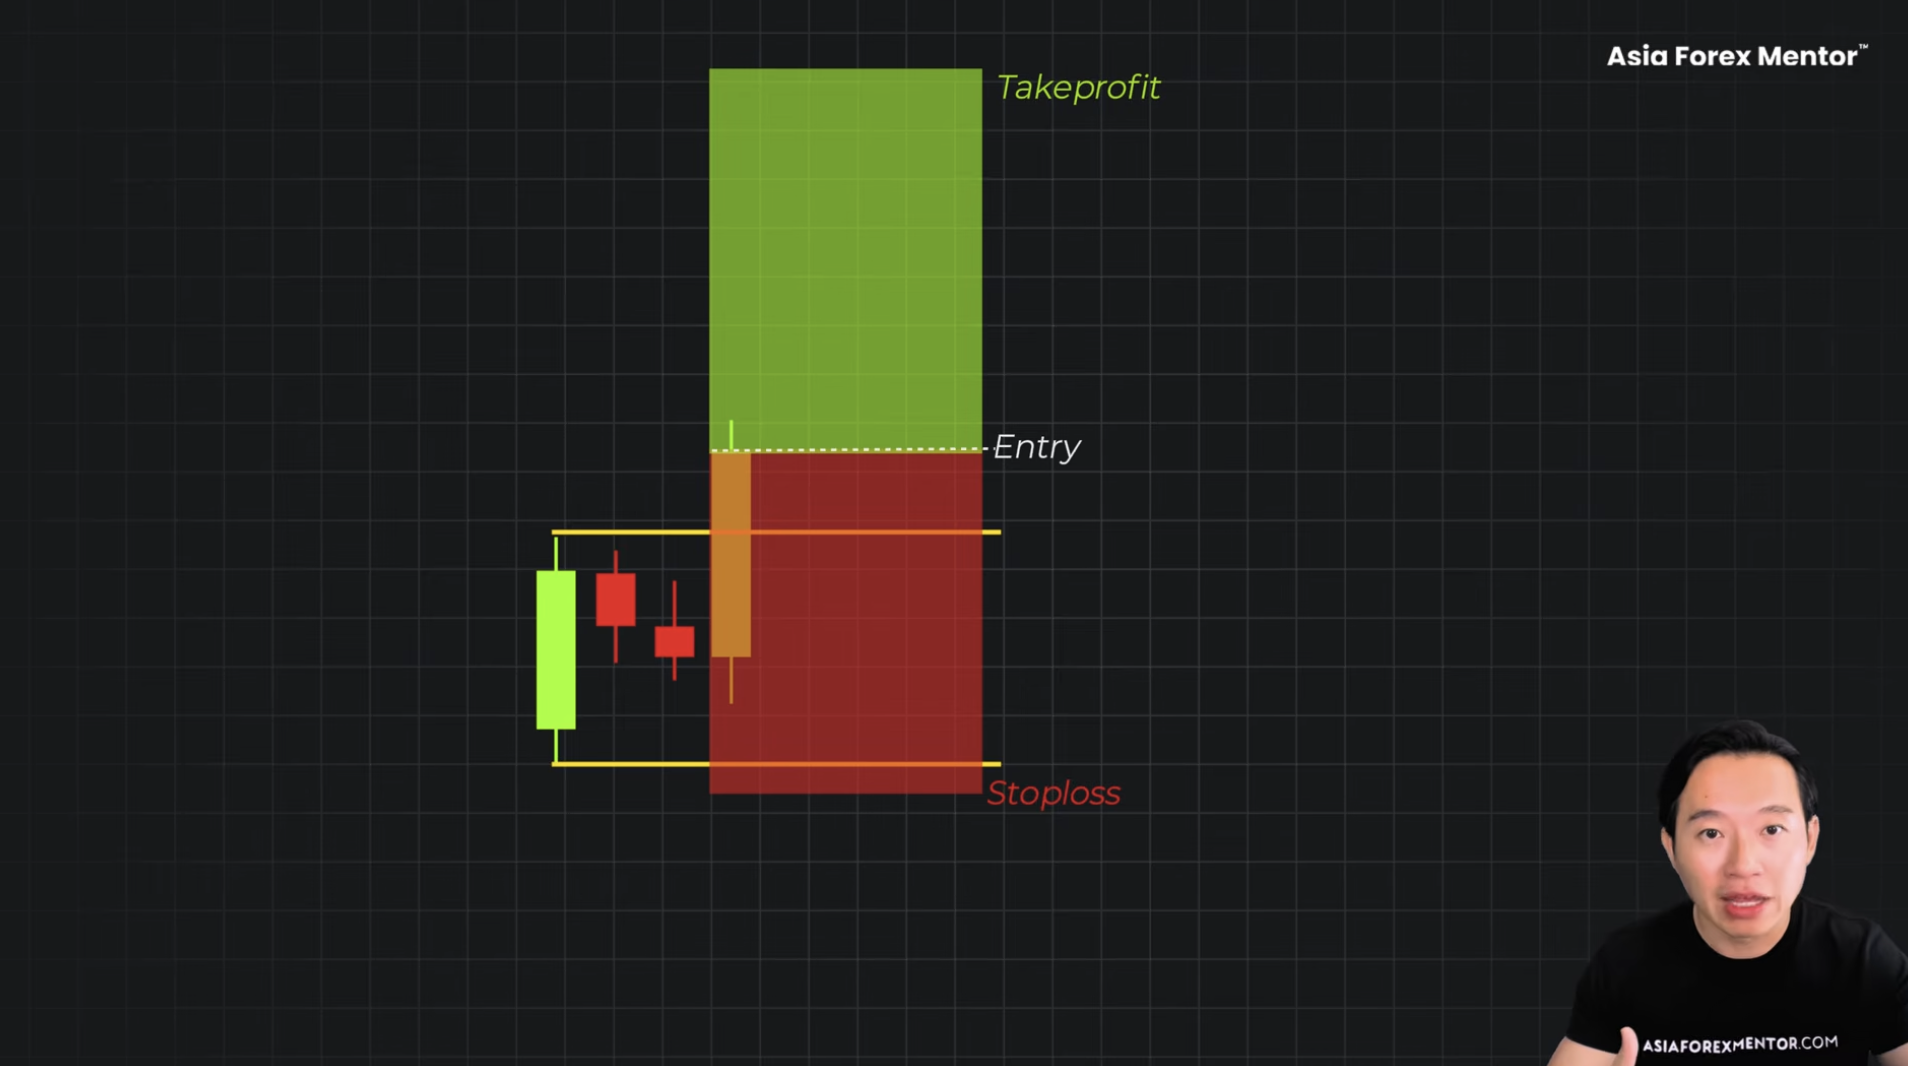
But the version that will be shown today is not the way that most traders run it.
Most traders would think that they failed because they picked the wrong window, the wrong opening of the market hours, or the wrong timeframe. Maybe the 5-minute was too fast, so they moved to the 15-minute. The 15-minute did not work. They moved it to the 30-minute. But that is not it.
Watch what actually happens at each one of them.
On the 5-minute timeframe, the range is actually pretty tiny. One candle is sometimes maybe about 10 pips wide. And at that size, every resting buy stop above the highs is actually visible to every algorithm in the market. Maybe a 3-pip push is going to clear all of them. Then what happens? Price collapses through and goes right back to the low. That is not a breakout. That is a liquidity grab.
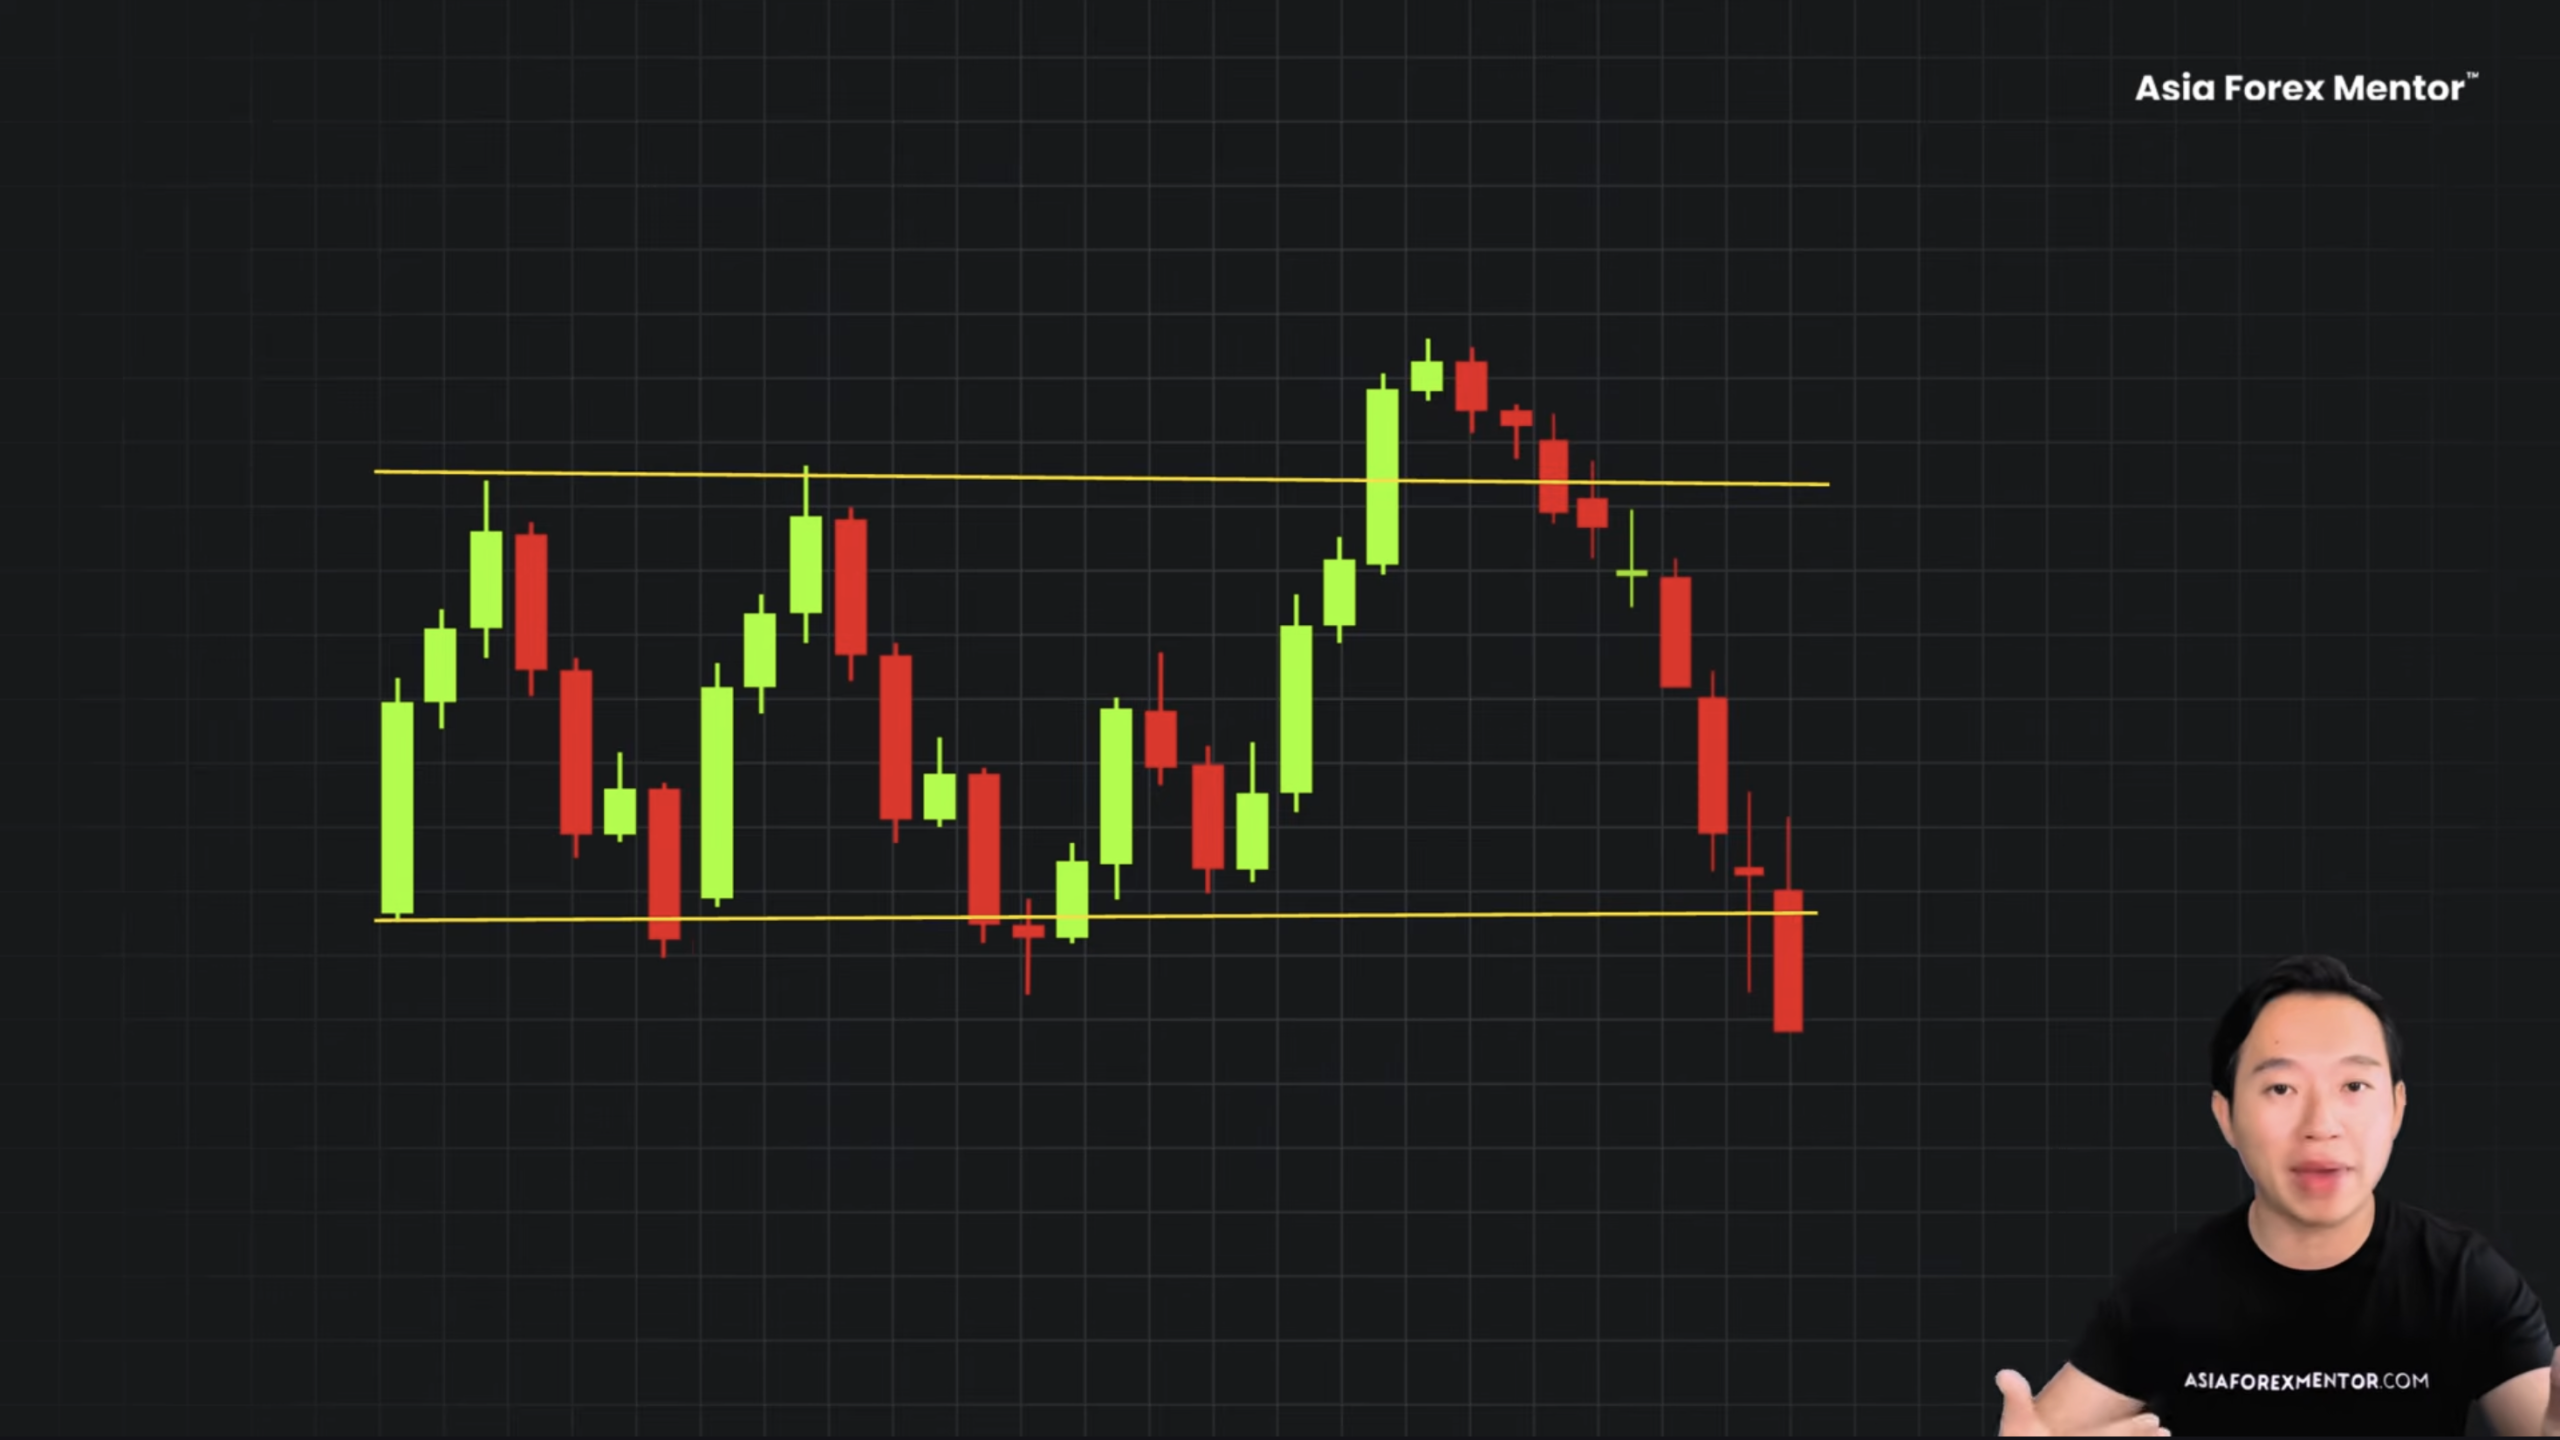
So traders say okay, 5-minute is not working. They wait longer. 15 minutes. 30 minutes. Now the problem flips. The range now prints 40, 60, 70 pips wide. Your stops sit on the opposite side of the whole bracket. And price has to travel further than the range itself to hit the target. That is a full session risk on one single trade.
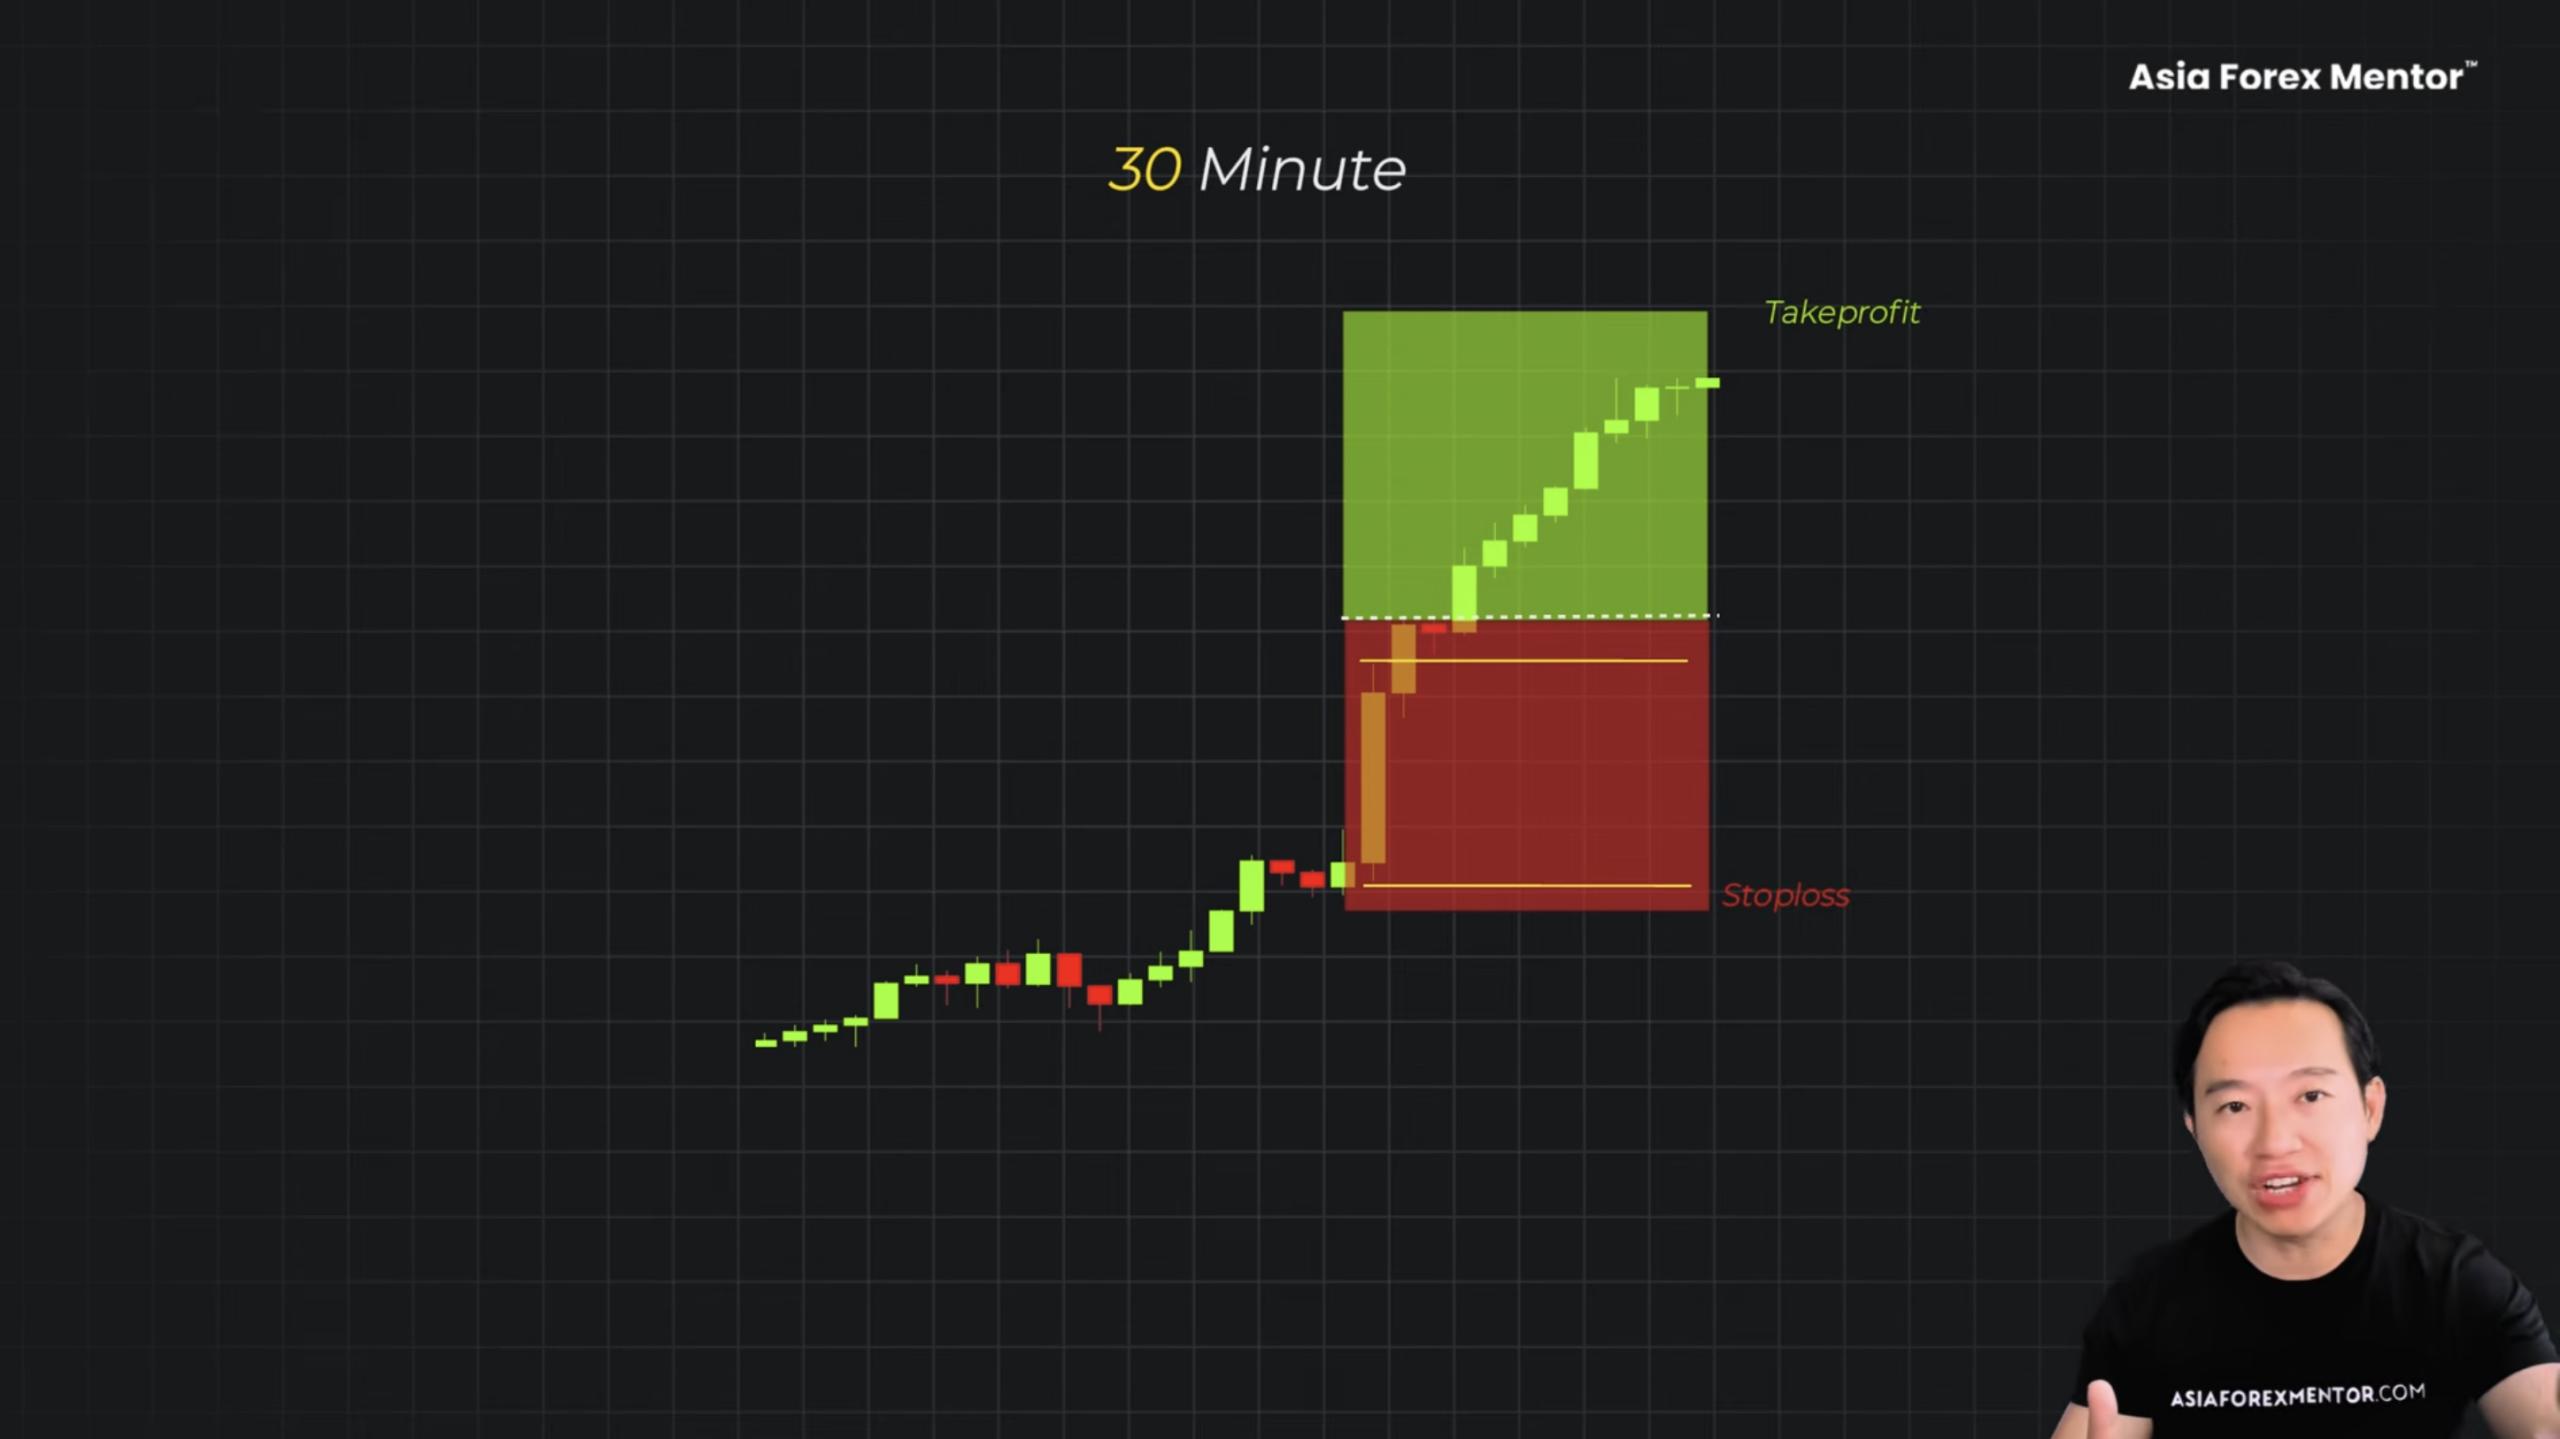
That is not the best way.
The real issue is that the range was never meant to be your entry signal.
Step 1: The Daily Trend
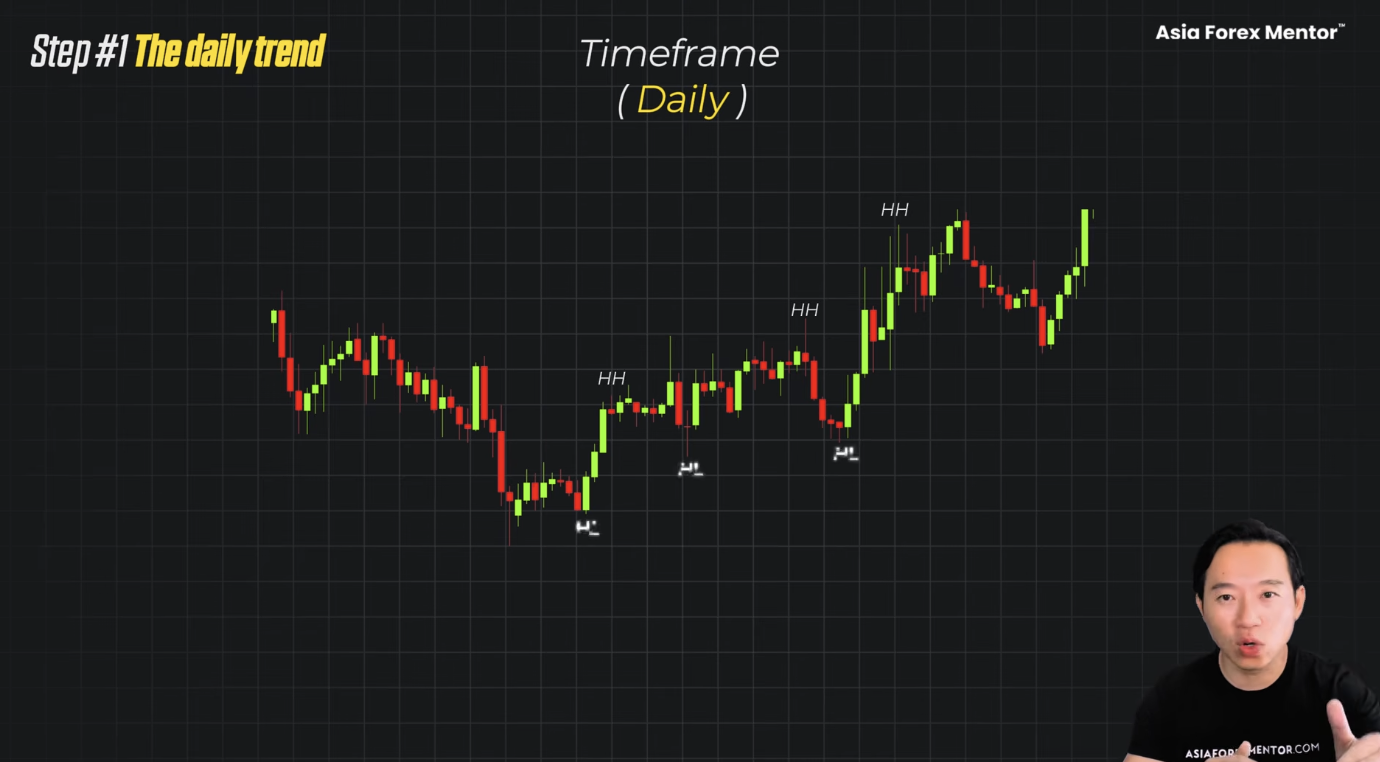
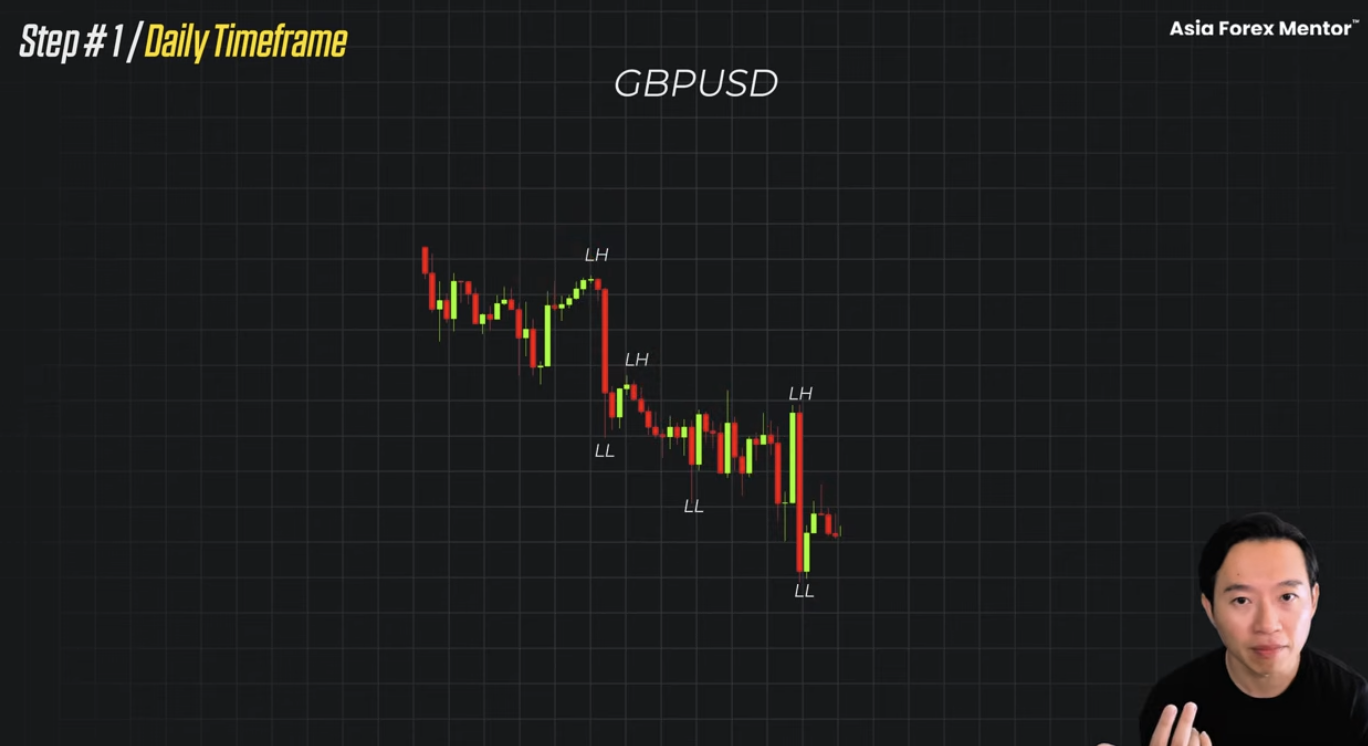
Before you look at the session at all, you go to the daily chart. That is where you are going to see the higher highs and the higher lows. When that happens, you are going to go long only. You are only going to buy.
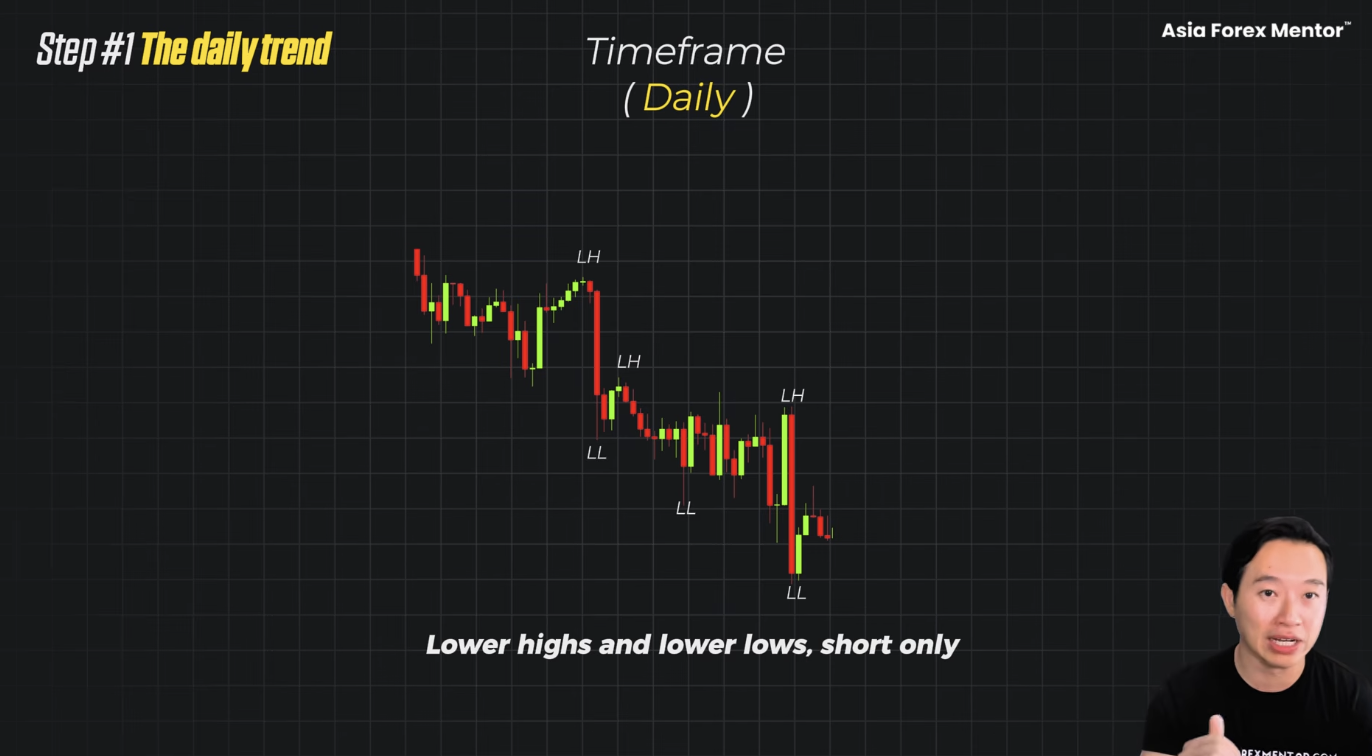
When the market is going down, lower highs and lower lows, this is where you go short only.
That is it.
Step 2: The Level
You are going to ask yourself, where is this range printing? This is a step that most traders skip entirely.
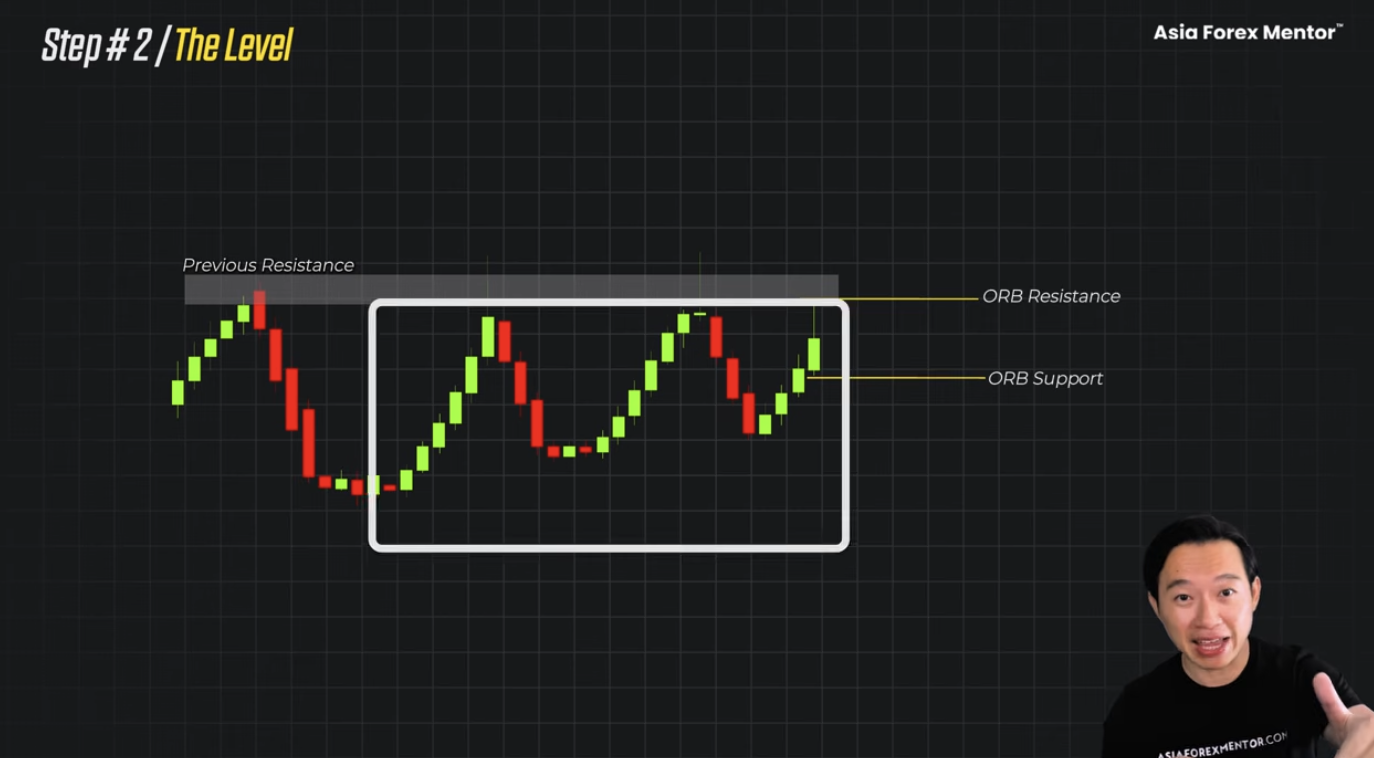
You will want the opening range to form at a level that the market has already respected. Like a prior daily resistance. A zone that was left behind by an impulsive move. Somewhere price has reacted before.
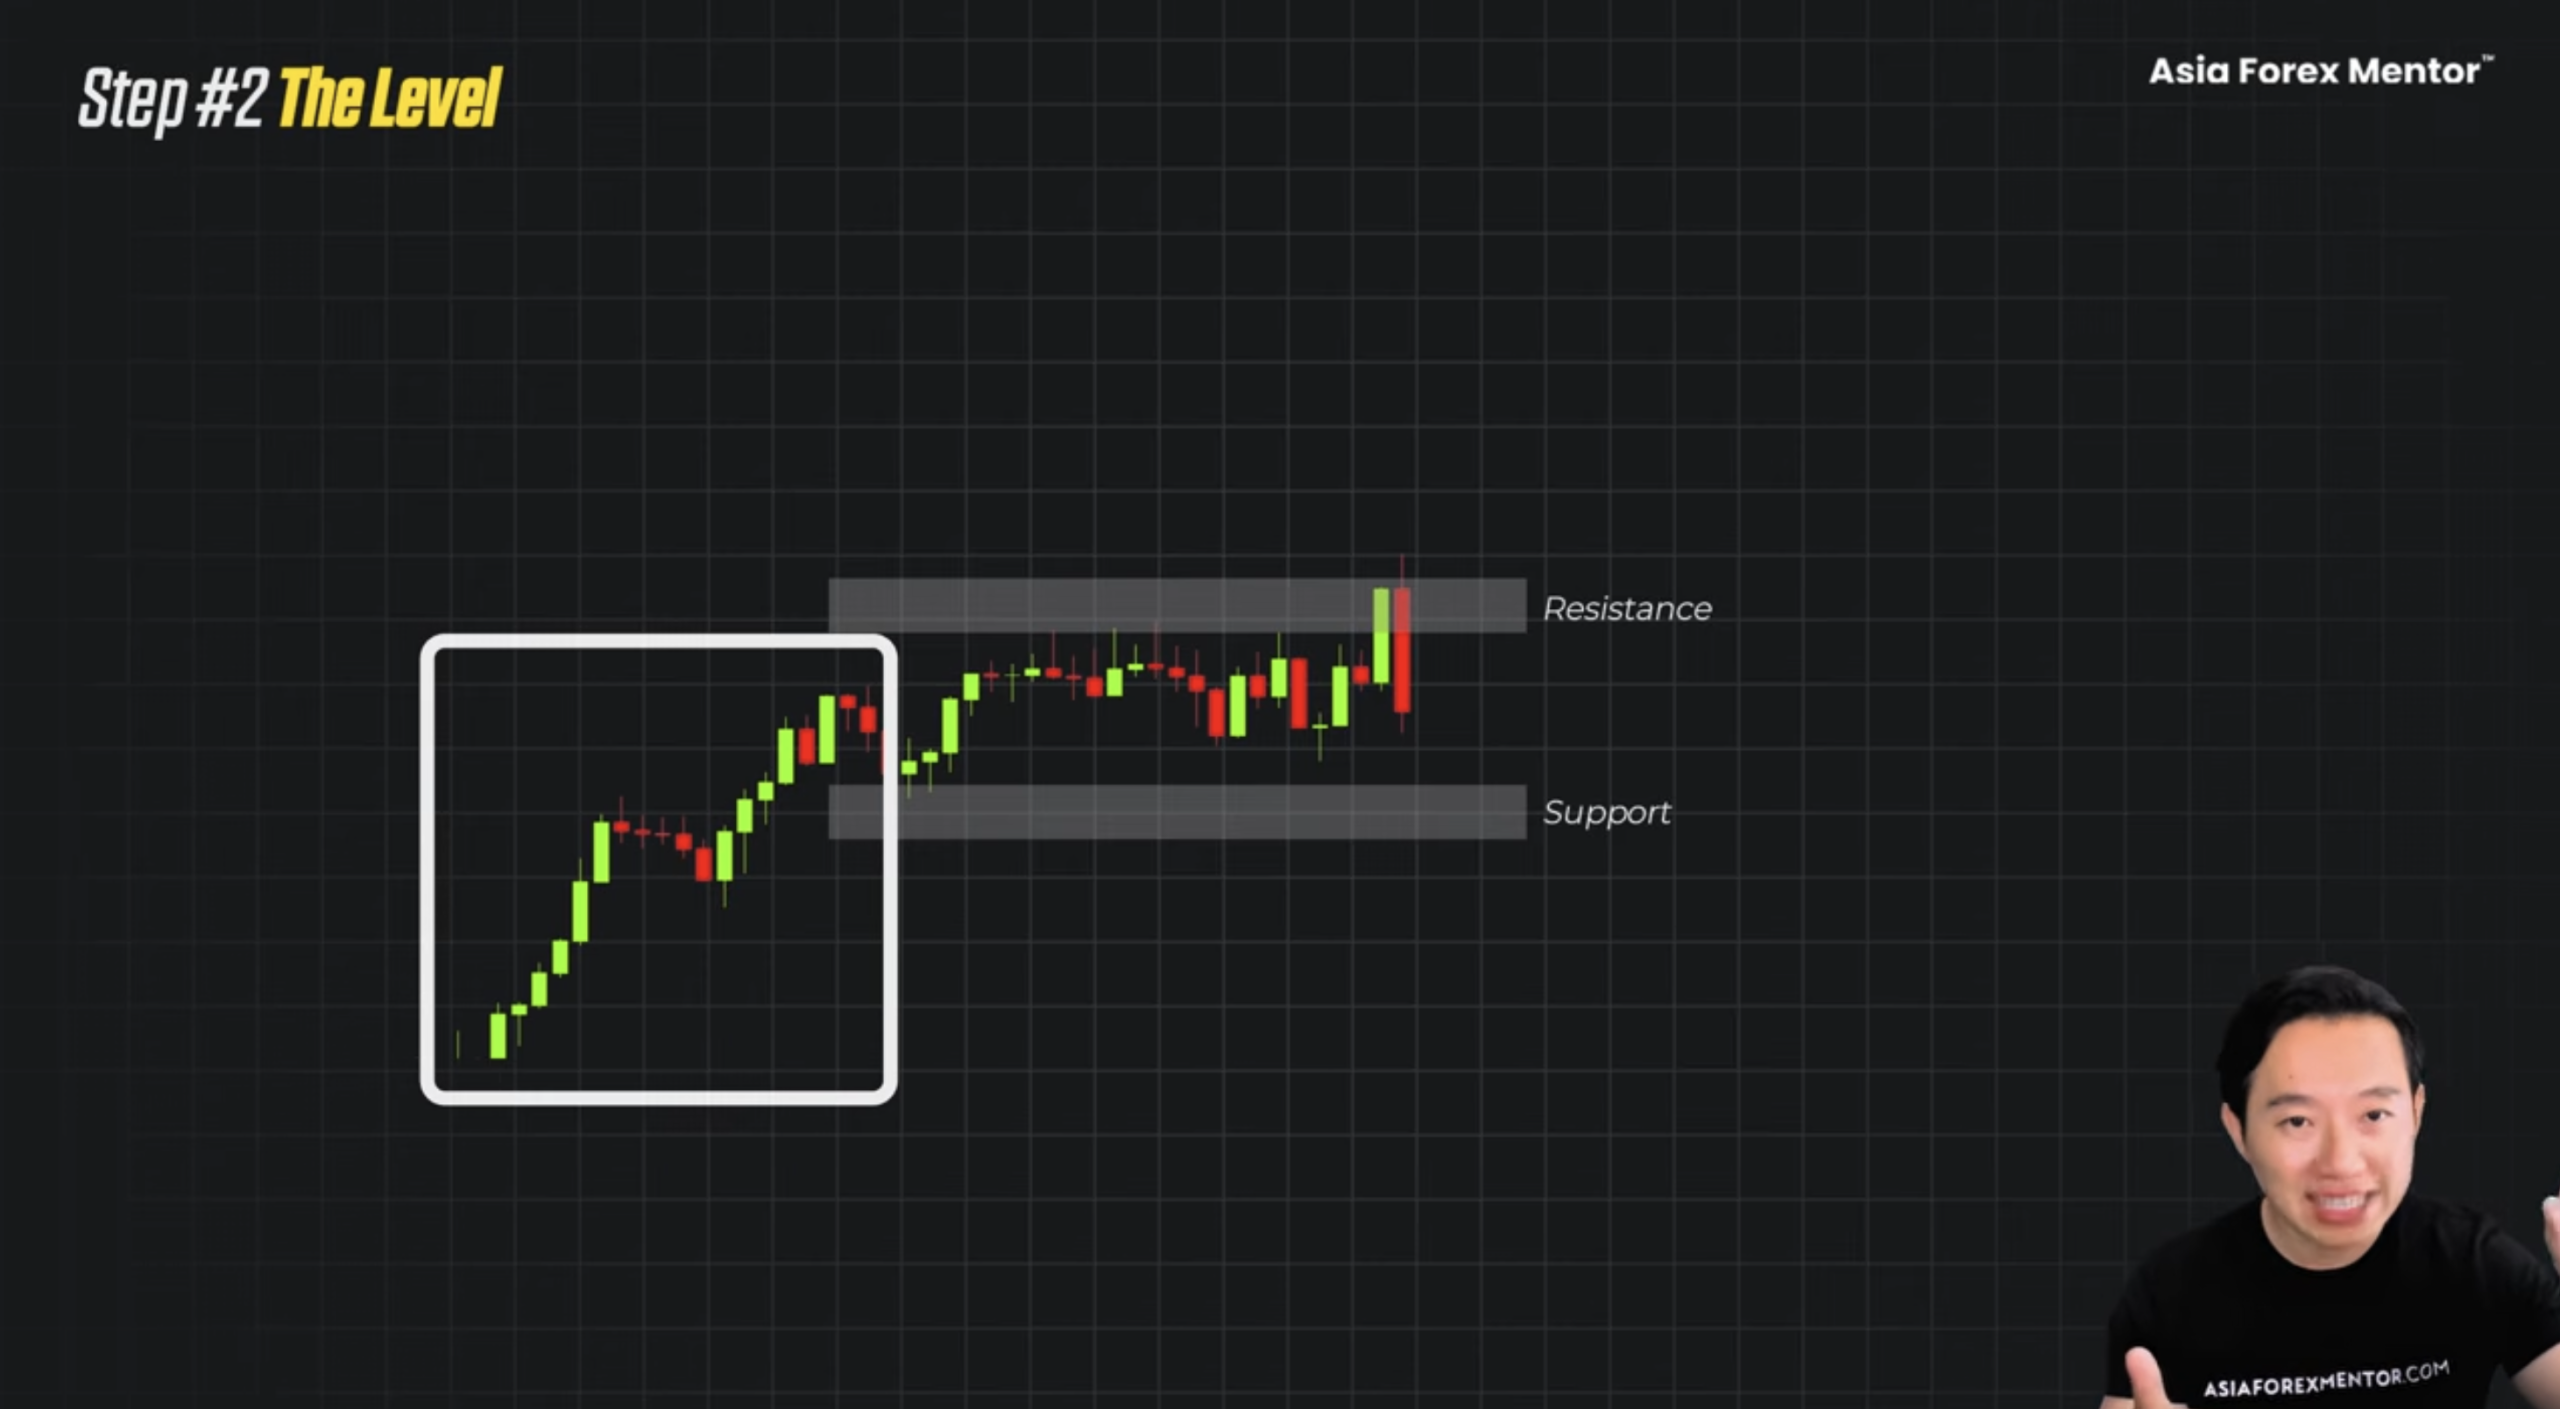
Because on its own, the opening range is just a session artifact that is going to happen every single time. It is 15 minutes of price. But when you layer it over a level that the whole market is actually watching, and price breaks through it, it actually means something. It is now two things lining up instead of just one ORB break.
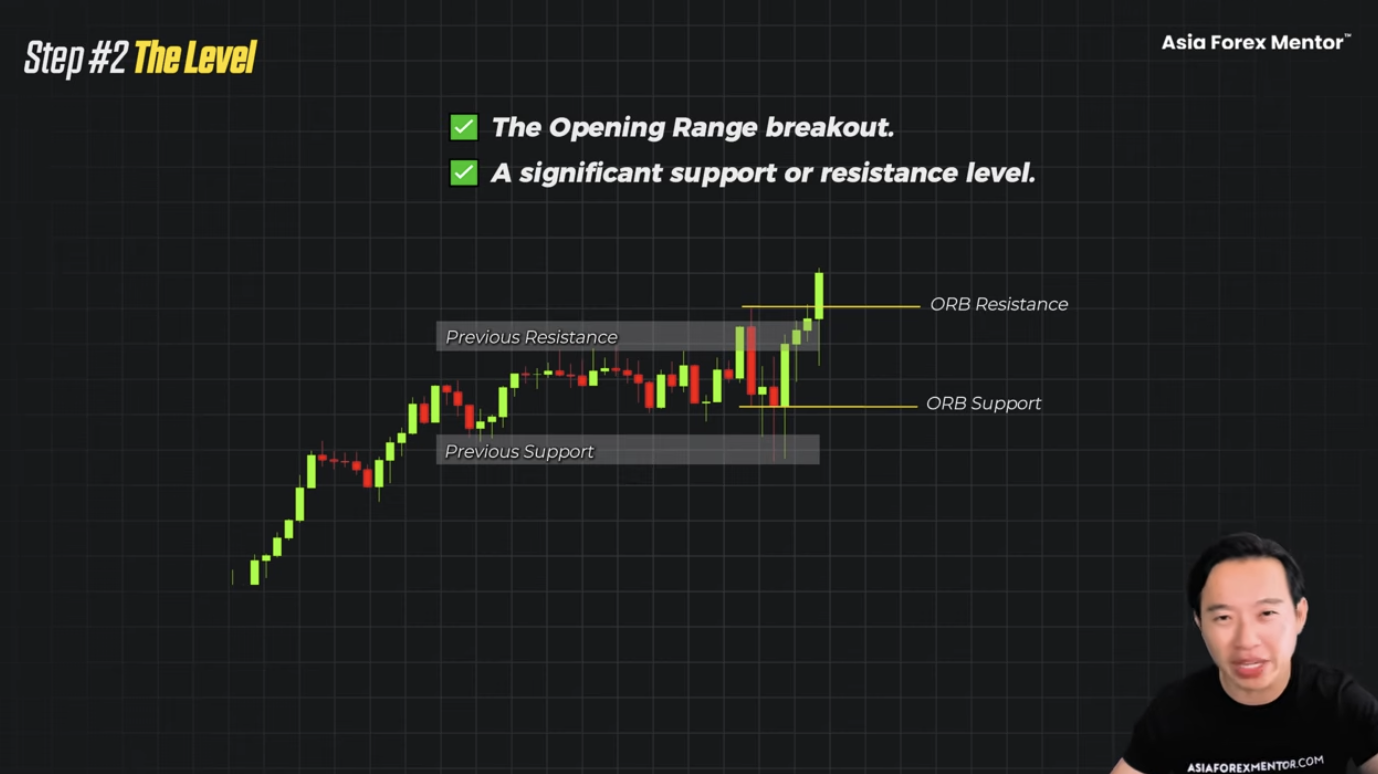
If the range is in an empty space, when the ORB breaks in an empty space, when there is nothing above or below it, what do you do? You skip it. Because it does not matter how clean it looks. As long as there is no level, the probability drops a whole lot more. So you skip it.
Step 3: The Close Beyond The Boundary
This is your trigger. And it is not the poke.
You will wait for the first candle to close beyond the range boundary in the direction of the daily trend. That close is your entry. Not the next open. That close.
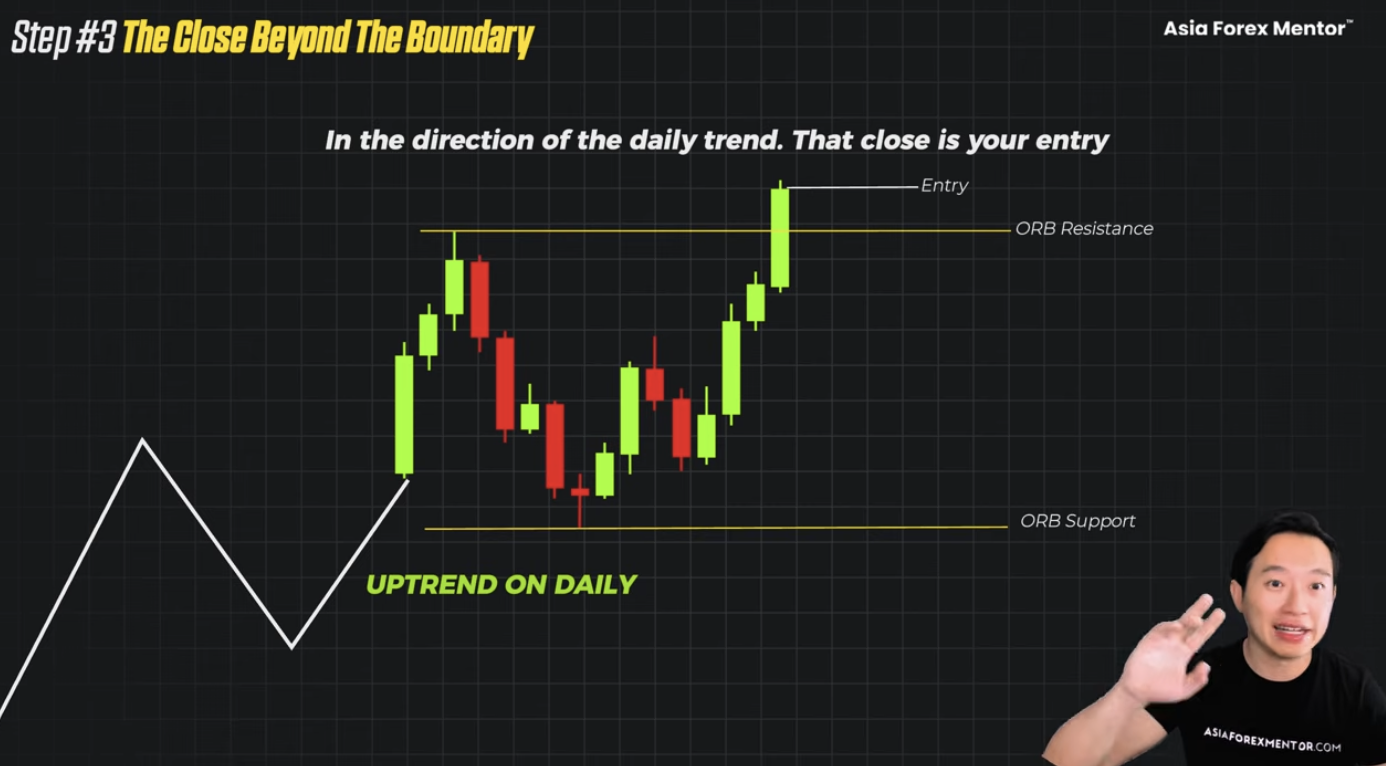
Why the close? The poke is price testing it. The close, when the bar actually closes, is the market actually committing at that level. Price has actually gone beyond it.
So you will want the body doing the work. At least 60 percent of the candle range.
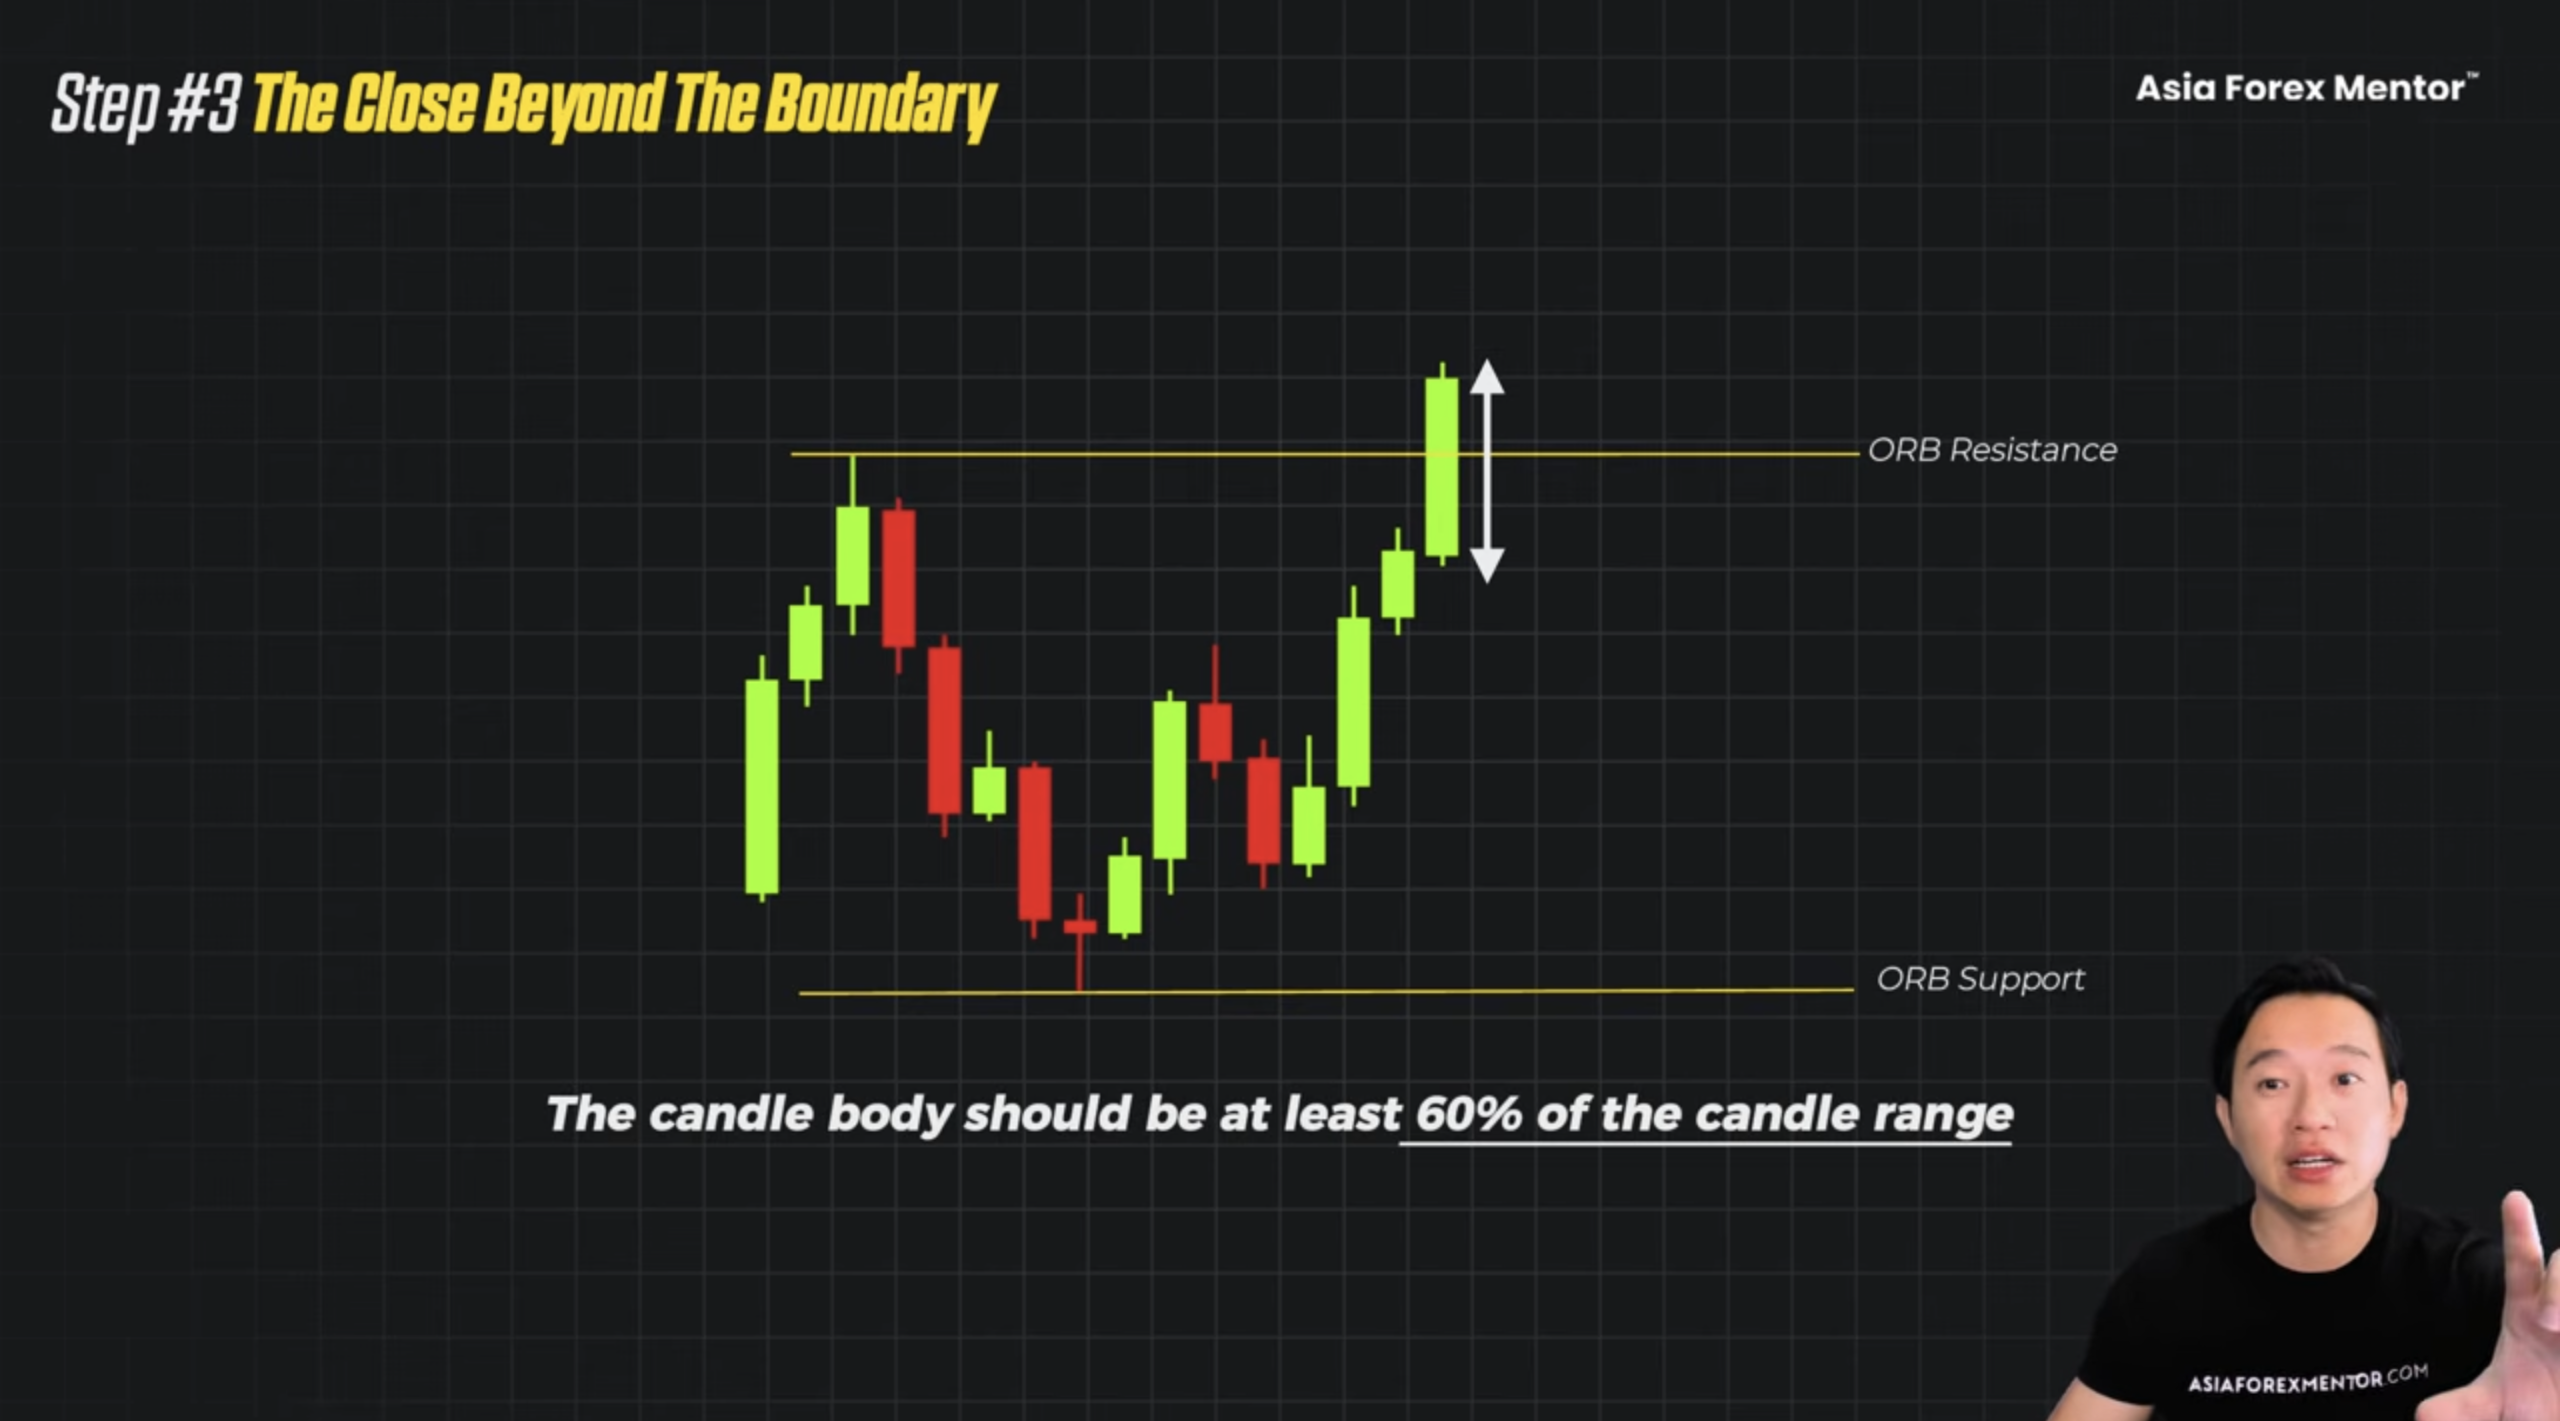
That is the whole thing. A daily trend. The real level. And a close beyond the boundary. Three simple steps. If you miss one of them, you are going to be back to the version that everybody uses. That is where the money is being lost.
Execution Rules
Now let’s talk about the execution rules.
You have a qualifying setup. Here is how you actually manage it. Your stop loss goes on the opposite side of the range. Plus a 2 ATR buffer.
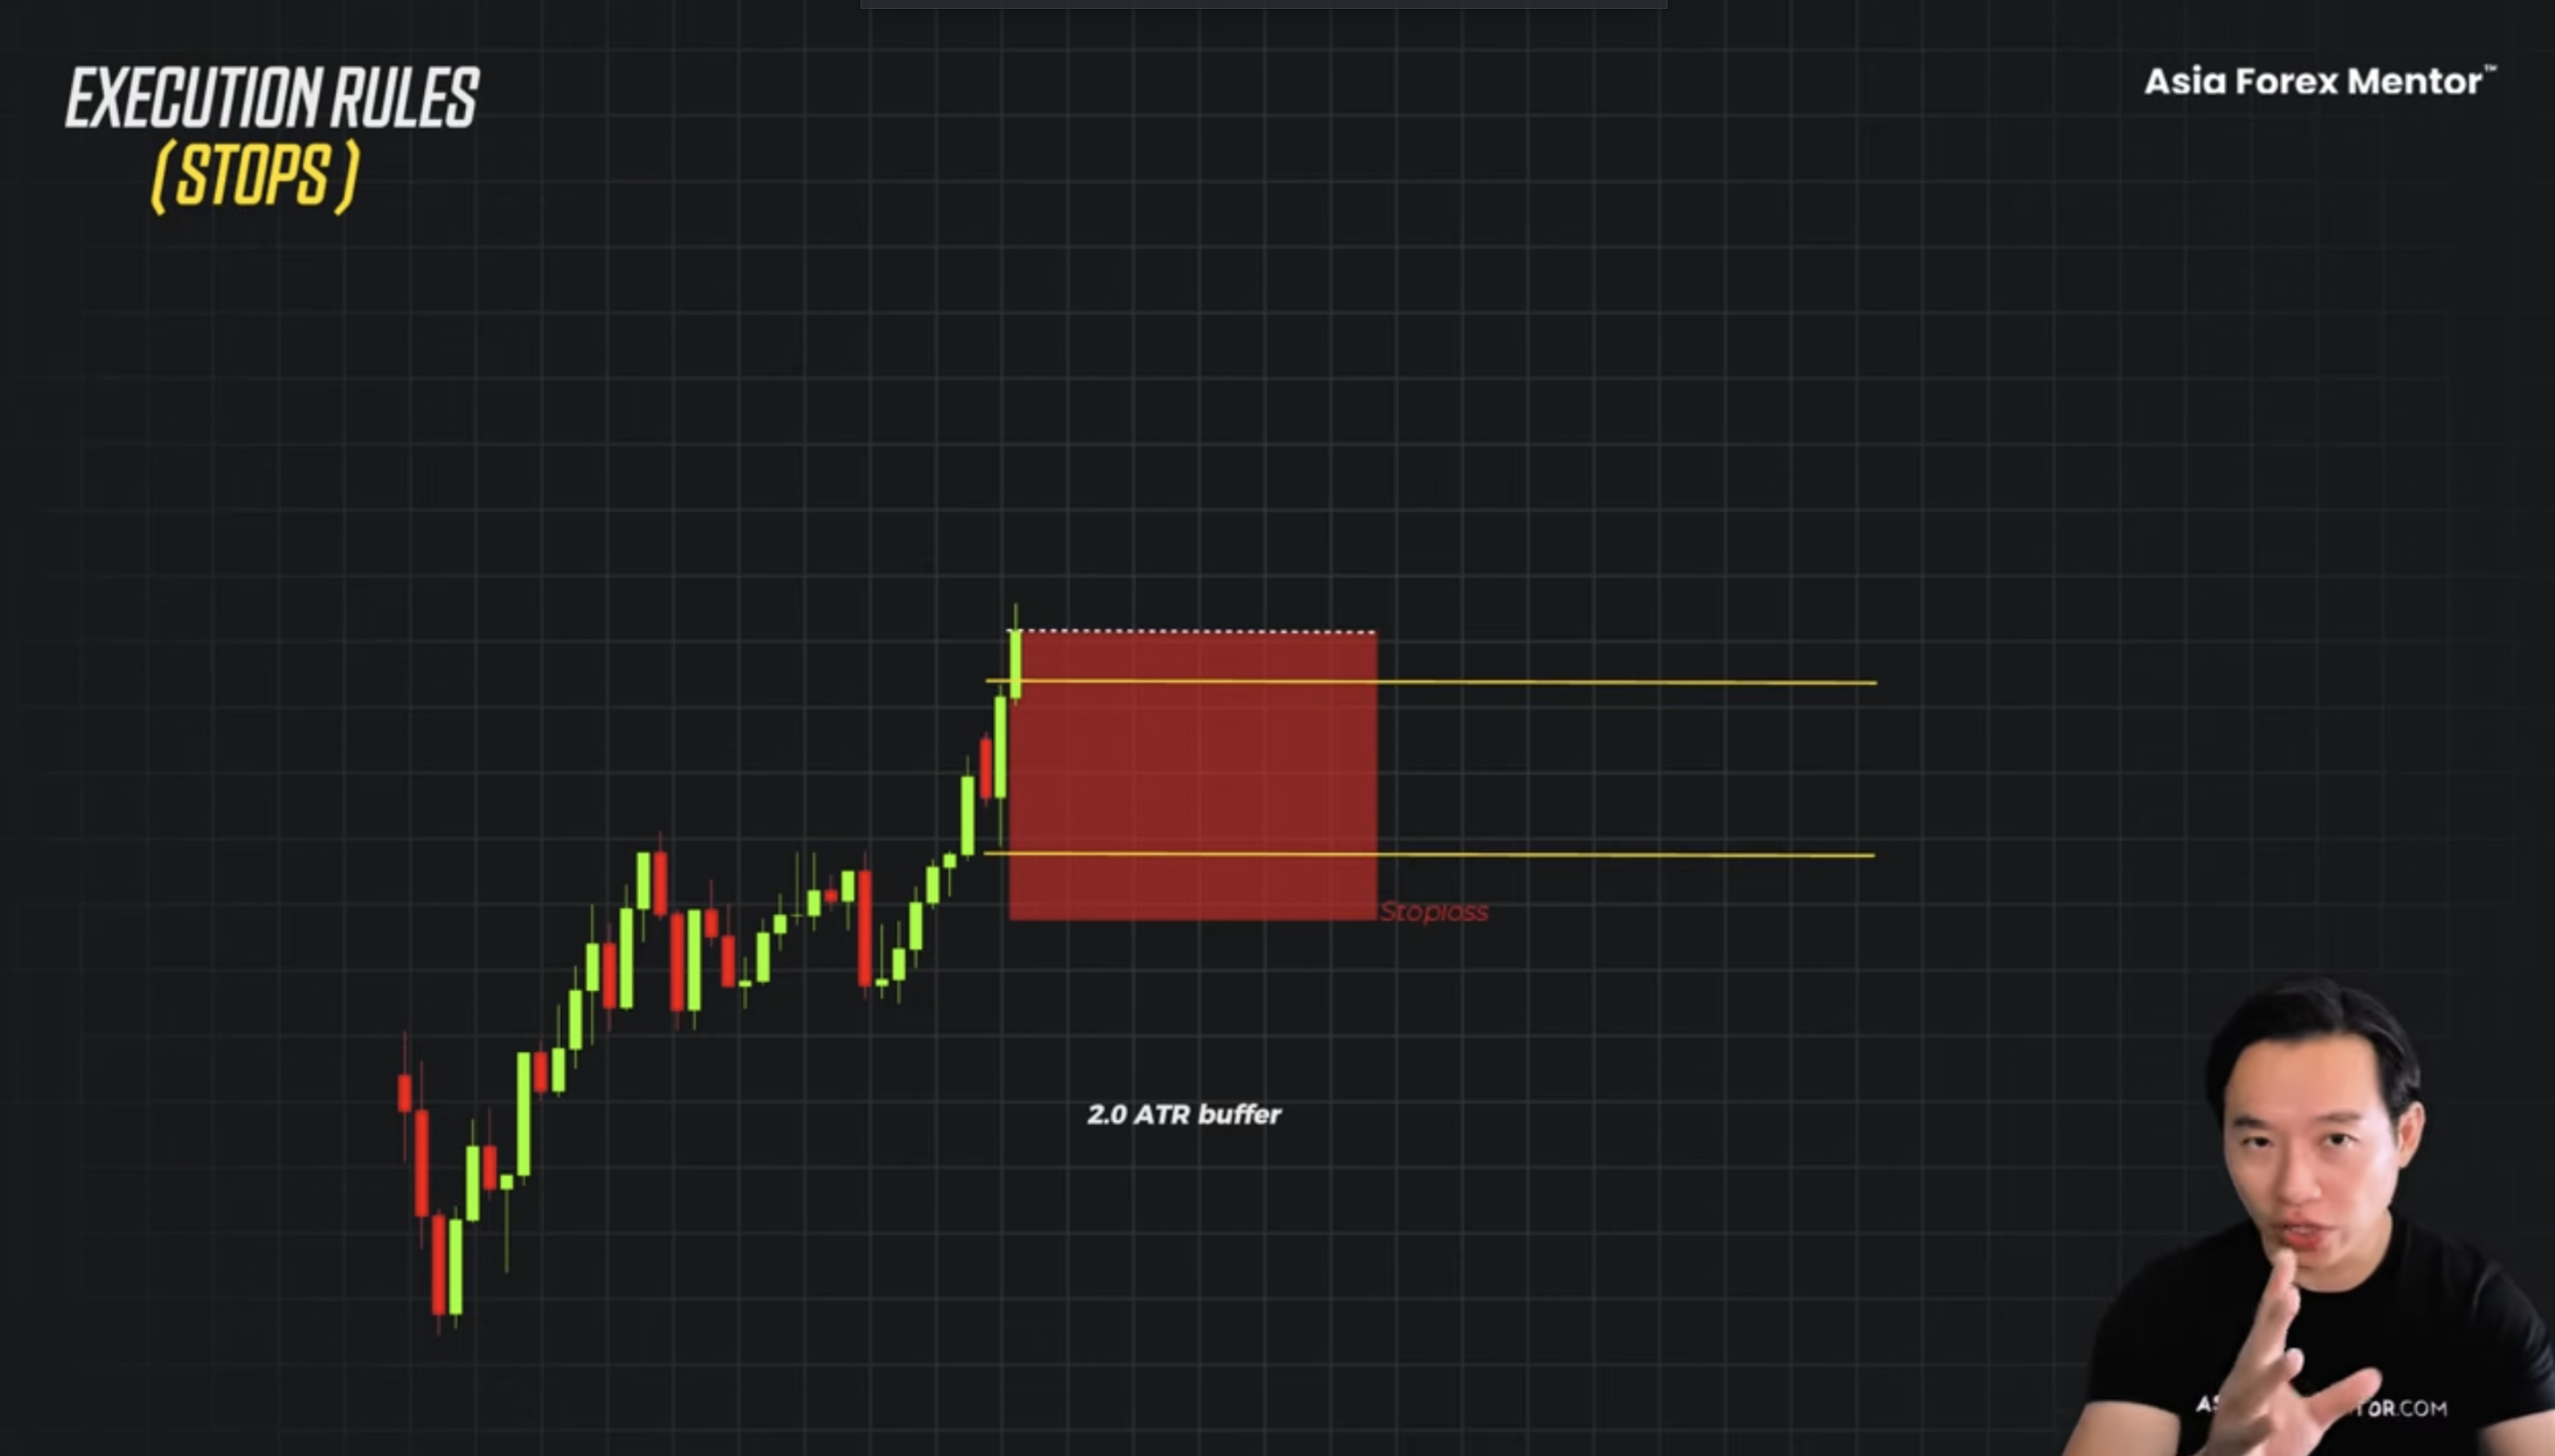
The buffer matters. The market actually breathes. It actually has wicks. It can take a level and come back up. A tight stop is fine until normal session noise takes you out of a trade that was working. So 2 ATR sits beyond the noise. You get stopped out when you are actually wrong, not when the market twitches.
Your take profit target is fixed. It is going to be one and a half times your risk. You do not trail, you do not scale, you do not let it run because it feels strong.
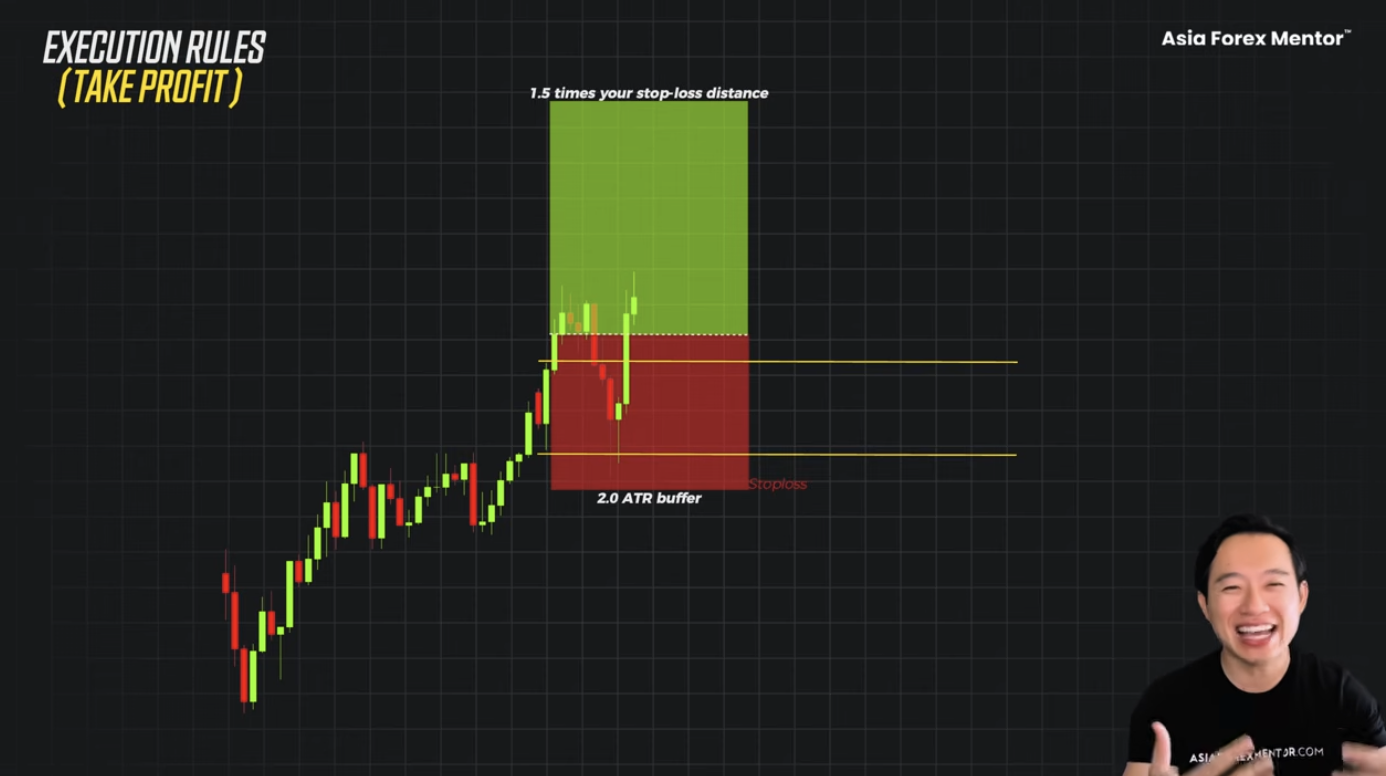
This is less exciting than riding a big move. But a fixed target is what makes this testable. It is what gives you an edge. You take the same trade the same way every time, and the edge is going to show up along the way.
Daily for the trend. 4-hour for the level. 15-minute for the execution, where the range actually prints.
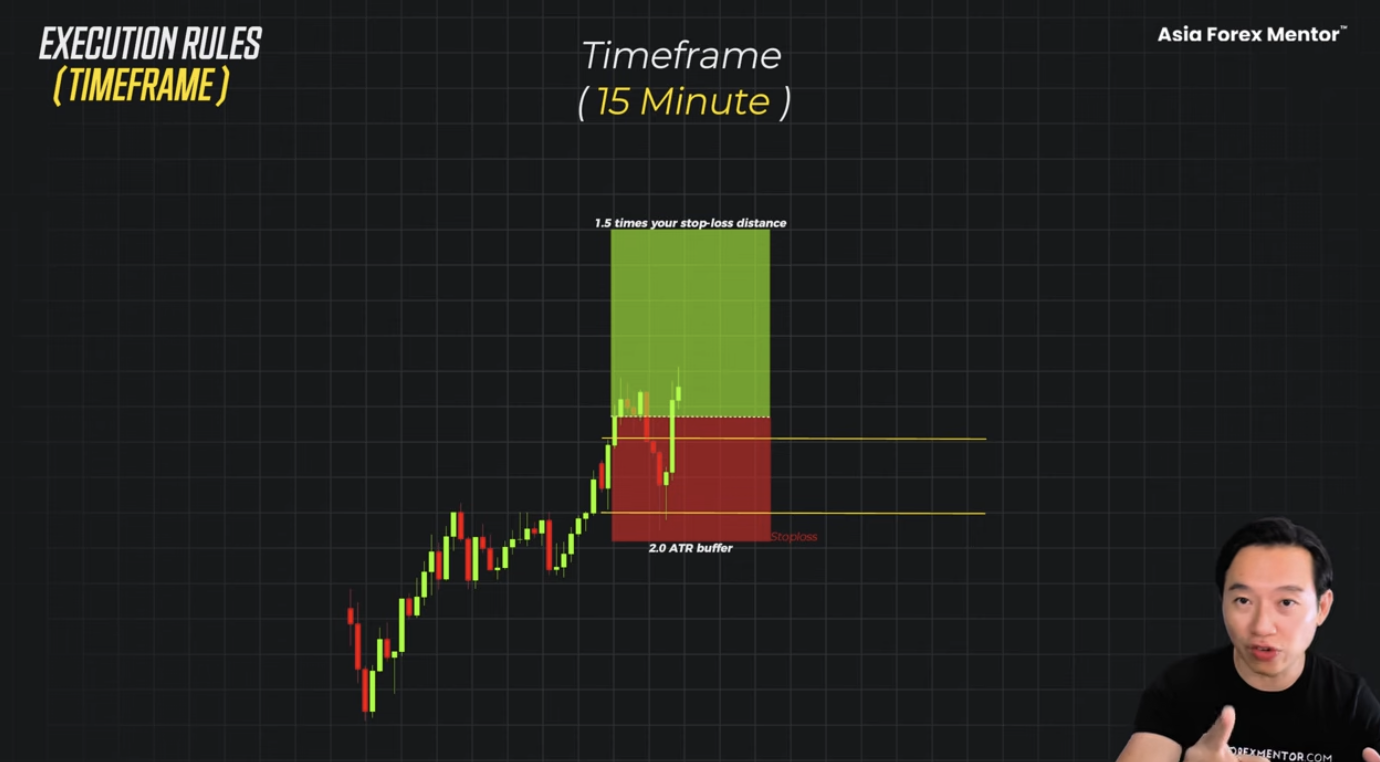
Anything below the 15-minute is noise. Do not drop lower looking, like the 5-minute or the 1-minute, looking for a cleaner entry.
One qualifying setup per session. Whether you win or you lose, you close the platform. You stay out of it. This is what is going to keep this honest. You are not hunting for trades. You are waiting for the one that meets all three steps.
The Method On A Real Chart
Take a look at this. GBPUSD.
Step 1. Go to the daily timeframe to look for the trend. The daily is showing lower highs, lower lows. It is a clean downtrend. So what are we going to do today? Buy or sell? The whole day today to trade the ORB, we are only looking to sell. We are not looking to go long on this chart.
Step 2. The level. Watch where the range actually prints. It forms right at the overhead resistance. This is a zone that was left behind by an earlier impulsive breakdown. And price has actually rejected there twice before. That is real structure.
Both conditions are already live.
Step 3. Wait for the trigger. The range window closes. Price tests the low. And then the next candle prints its body fully below the boundary. With almost no wick. That is a very decisive close. And that is your entry.
Your stop loss goes above the swing high plus a 2 ATR buffer.
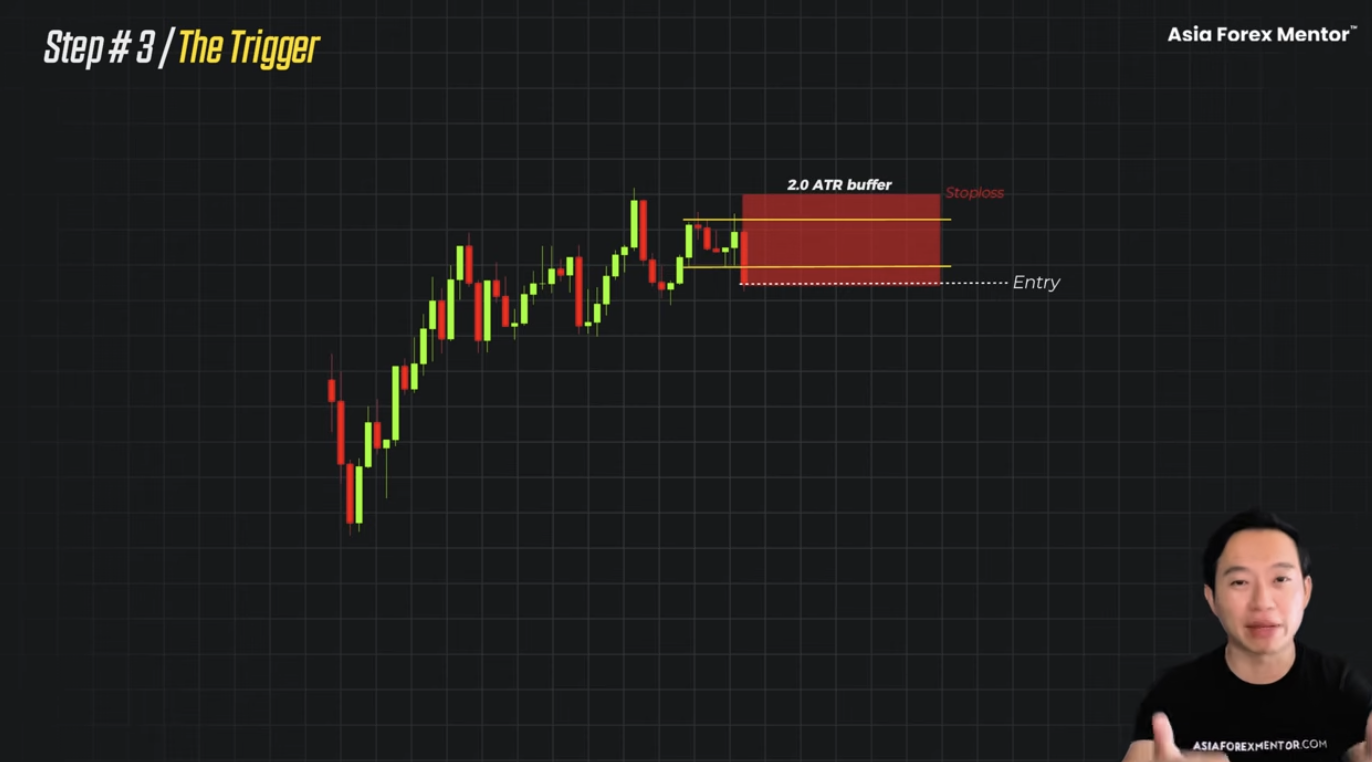
Your take profit target you set at the next structural swing low. And the distance is going to clear the 1.5R minimum. So the trade qualifies. You have a fixed take profit.
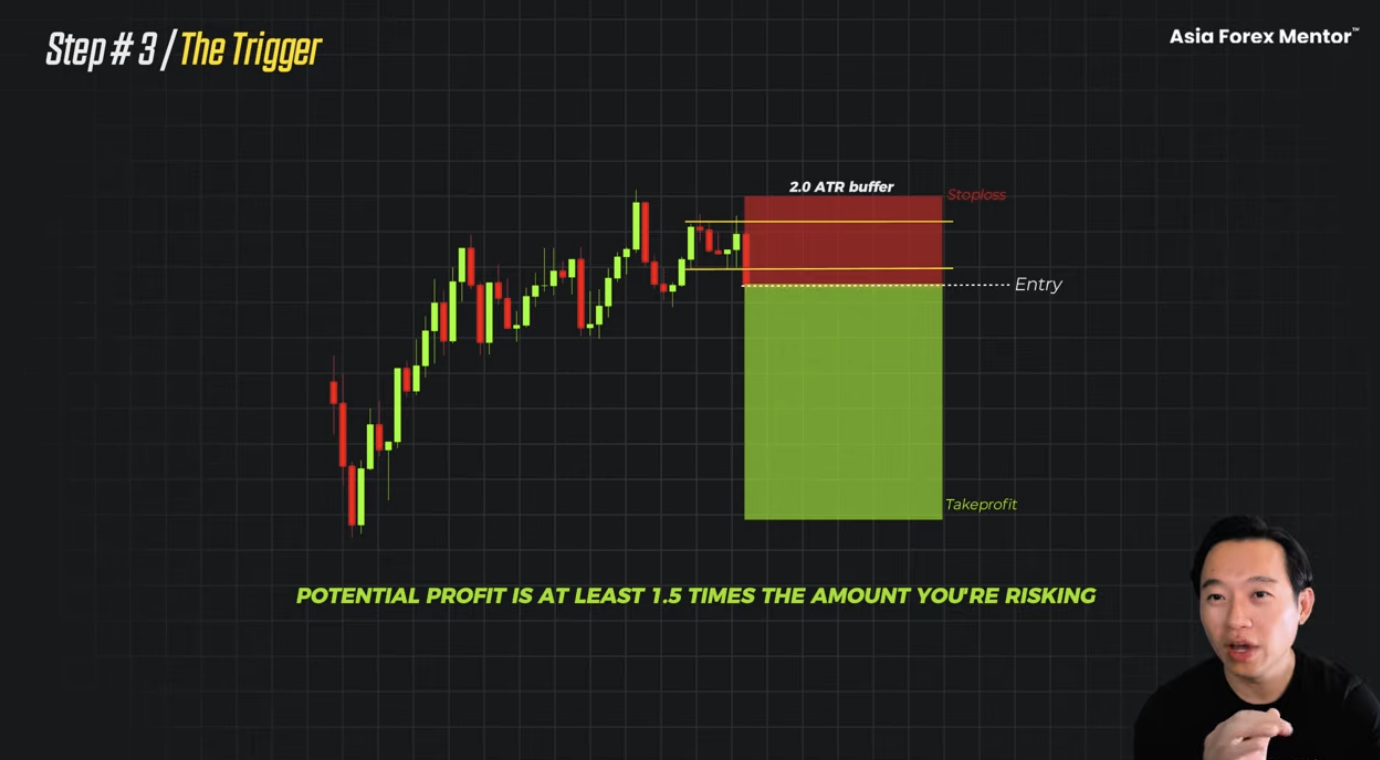
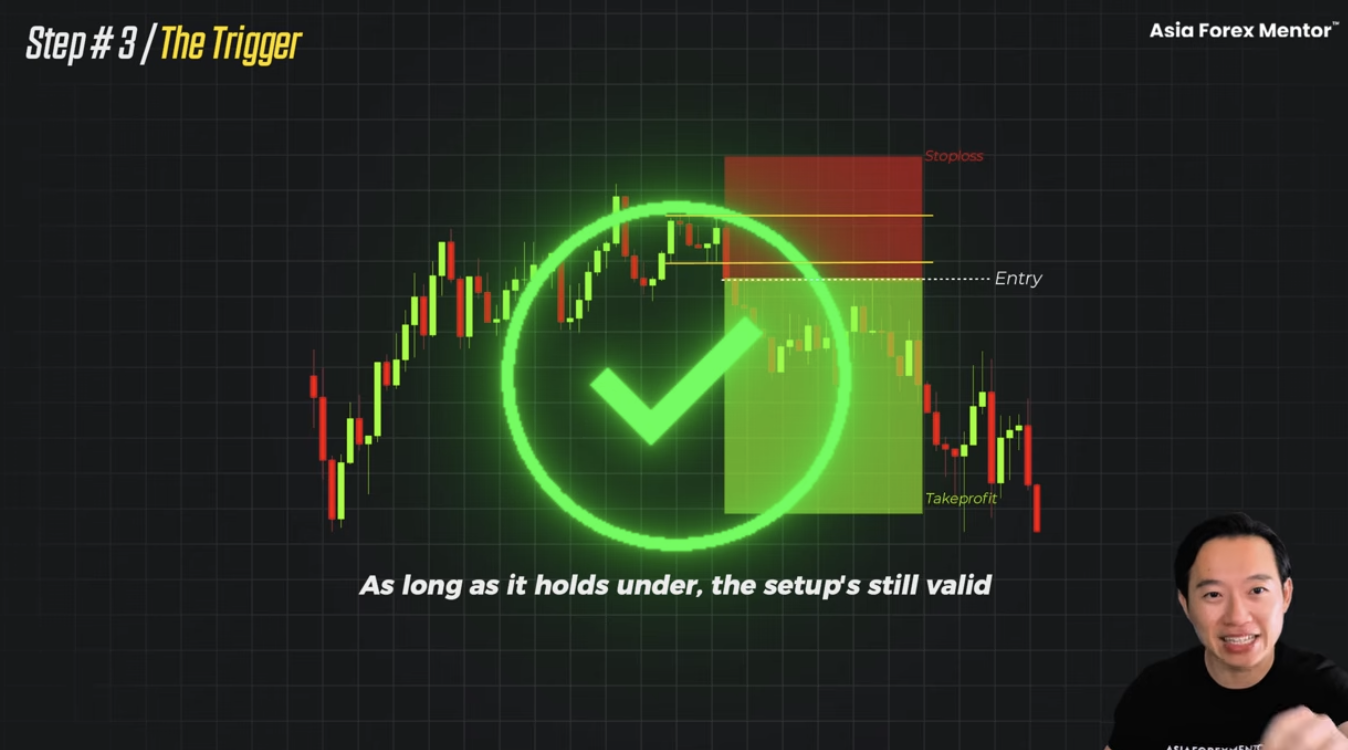
Let’s play out. Price consolidates for two candles below the range low. And this is where a lot of traders are going to get impatient. Because it is not running yet. So they start to second-guess.
But that is normal. The move does not have to take off right away. What we want to see is simple. Price staying below the boundary. As long as it holds under it, the setup is still valid.
Three steps, all of them line up. That is the whole trade.
An Example You Do Not Take
Knowing when to skip a trade is actually as important as knowing how to enter a trade.
Step 1. The daily timeframe. Lower highs, lower lows, downtrend. Good for short only. So far so good.
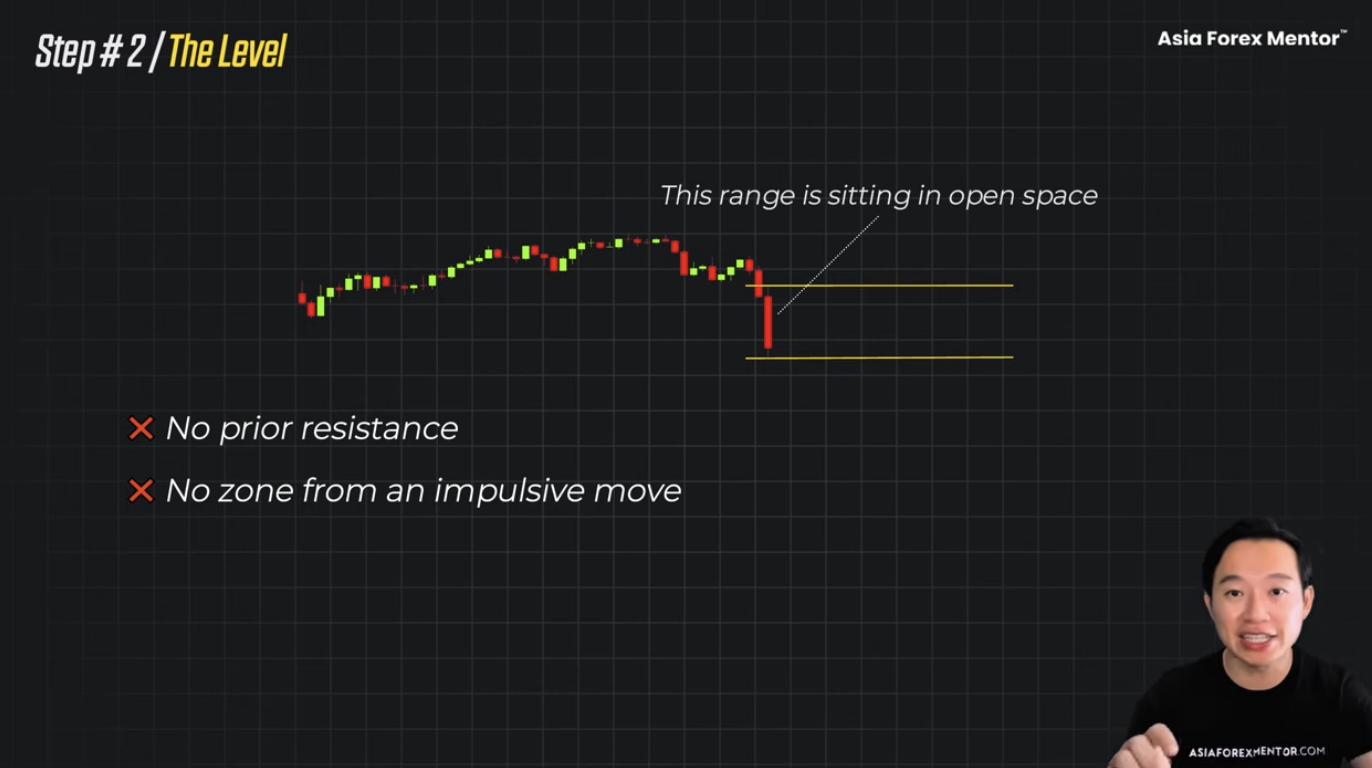
Step 2. The level. Now here is where it falls apart. The range prints, but look at where it is. There is nothing around it no prior resistance. There is no zone from an impulsive move. Nothing that price has actually reacted to before. This range is actually sitting in open space.
And this is what makes it hard. Take a look at what happened next. The range window closes and price pushes below the low. This is where you are going to get your textbook trigger candle. You have your full body. There is no wick. Exactly what Step 3 asked for.
So if you were only running the trigger, you would be in this trade right now. And take a look. It even works. Price drops and keeps dropping. If you had taken it, you would have made money.
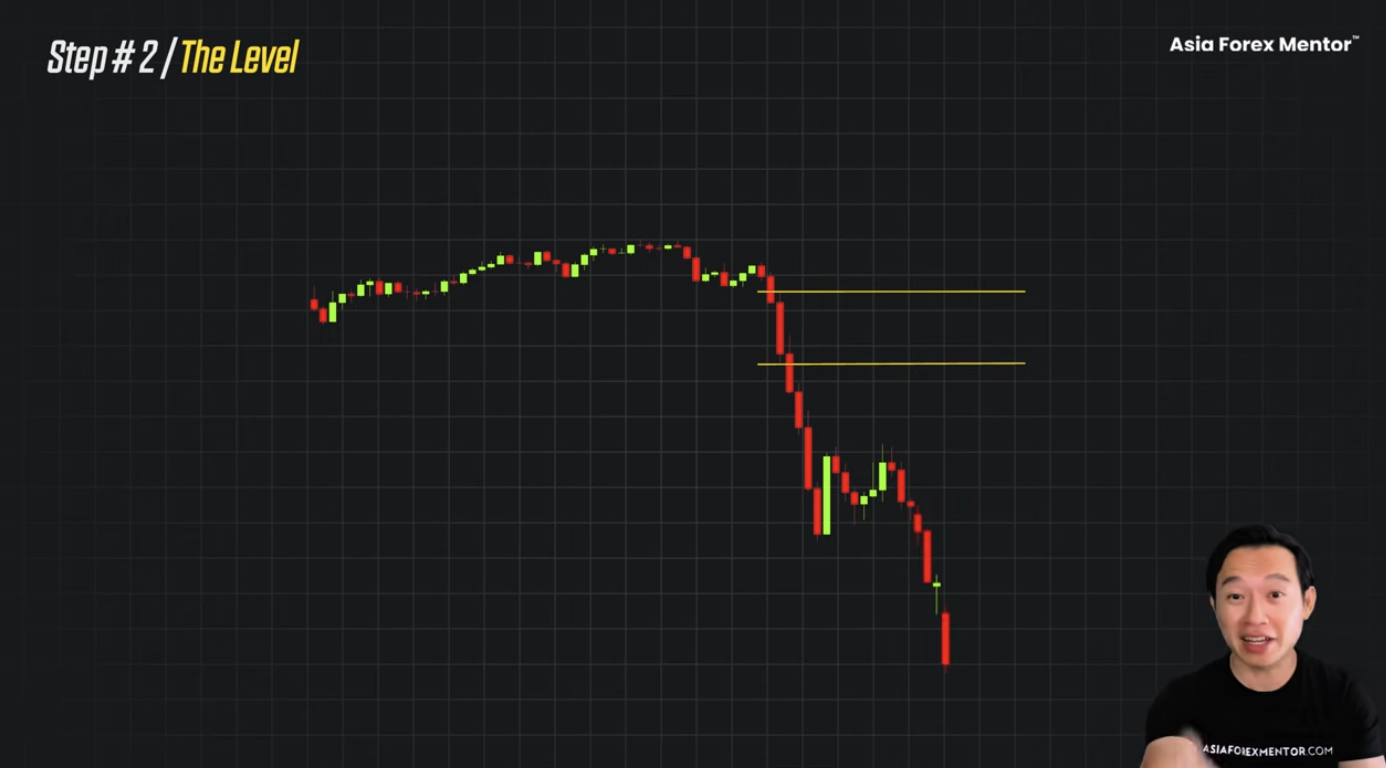
So you might ask, why am I not doing this?
Look, this is the trap. Because you do not have a level. You have a trend, you have a trigger, but you have an empty chart in between. And over 2,444 trades, that is the version that took a $10,000 sample size down to $239.
One trade does not tell you if a rule is going to work. The entire sample size does.
So even though you would have seen it working, you skip it. You close the window, you close your platform, and you wait for tomorrow for another setup.
The hardest part is skipping a very clean-looking setup. It almost feels like you are leaving money on the table. But every trade that you managed to skip because it actually failed a step out of the three steps is a loss that you did not have.
Also Read: Forex Trading Strategies That Work: A Complete Guide to Consistent Profits
What It All Comes Down To
This is how the whole methodology of ORB works.
Step 1. Find the trend. If it is higher highs, higher lows, we are going only long. If it is lower highs, lower lows, we are going only short.
Step 2. Find the level. When the range prints, when the ORB happens, the range has to print somewhere where the market already respects. This is the key. If it is an empty space, you skip it. Even though Step 1 is aligned with the daily trend.
Then when you have Step 1 and Step 2, you go to Step 3. Otherwise, do not even proceed to Step 3. Do not even look for the breakout candle because it is not worth it anymore.
Step 3. Wait for the close beyond the boundary. Do not wait for the spike or the wick. You want a full body close in the direction of the trend.
Then your stop loss is on the opposite side plus 2 ATR. And your take profit target you set at a fixed 1.5R.
And you are only going for one setup per session.
That is the whole method of this ORB. If a trader were to start over again and build back up, this is the setup to run. Not because it is exciting. It is not. But because of everything AFM Research Lab tested across the whole sample size, this is the one with an edge.
Frequently Asked Questions
Does The Opening Range Breakout Strategy Actually Work?
The textbook opening range breakout strategy does not work as a standalone system. AFM Research Lab tested it across 2,444 trades on 28 currency pairs and produced a 97.7 percent drawdown. A $10,000 sample account dropped to $239. The concept is not wrong. Using the range as the entry signal on its own is what fails. When the range is filtered by daily trend and prior structural level, the same setup produced a clean edge in the same test window. The version that works uses the range as one input, not the whole trade.
Why Do My ORB Trades Keep Getting Stopped Out?
ORB trades get stopped out because most traders skip the level check. The range prints on every session regardless of what the broader market is doing. When the range forms in empty space, with no prior resistance or impulsive move behind it, the break has no institutional backing. Algorithms hunt the visible stops above and below the range, sweep the liquidity, and reverse. Filtering by daily trend and prior structural level removes those setups before the trigger candle even prints.
What Is The Best ORB Timeframe For Forex?
The 15-minute chart is the execution timeframe. The 5-minute is too small, the range prints at 10 pips and gets swept by algorithm-driven liquidity grabs. The 30-minute is too large, the range prints at 40 to 70 pips, which puts the stop on the opposite side of a full session and forces price to travel further than the range just to hit target. The full method also uses the daily chart for the trend and the 4-hour chart for the structural level. Anything below the 15-minute is noise.
Is The Opening Range Breakout Strategy Profitable?
The opening range breakout strategy is profitable only in the version that adds two filters to the raw range break. AFM Research Lab testing across 2,444 trades produced a 97.7 percent drawdown on the textbook version and a clean edge on the version that required daily trend alignment plus a prior structural level. Past performance in backtest results does not guarantee future returns. Traders who apply the three-step version consistently, take one setup per session, and use a fixed 1.5R target maintain the edge the sample showed.
Can You Make Money With The ORB Strategy?
Making money with the ORB strategy depends on filtering out the setups that look clean but are structurally weak. AFM Research Lab testing showed that trades taken on the raw range break drove a $10,000 sample account down to $239. The version that filtered by daily trend, prior structural level, and full body close beyond the boundary produced an edge across the same sample. The strategy works when the trader is disciplined about skipping setups that fail any one of the three filters, even when the skipped trade would have won.