Why does the stochastic keep giving textbook signals that lose money? The indicator is not the problem. The way it is being used is. Traders treat the crossover as a buy or sell signal when it was only ever meant to measure momentum, not location.
| About This Guide |
|---|
| This guide covers the stochastic strategy tested by AFM Research Lab across 2,440 trades. It explains why the textbook version produces a 97.6 percent drawdown, and the three-condition version that came back with a real edge in testing. Every rule is mechanical. Every filter is specific. |
| Quick Answer |
|---|
| The stochastic strategy works only when three conditions align. The daily trend has to match the trade direction. The signal has to fire at a level built by a real impulsive move, not in open space. And both the K and D lines have to be inside the extreme zone and cross together. Miss one and the setup does not qualify. |
Take a look at this chart. Price is dropping. The stochastic falls into the oversold zone. And then the lines cross back up. That is a textbook buy signal.
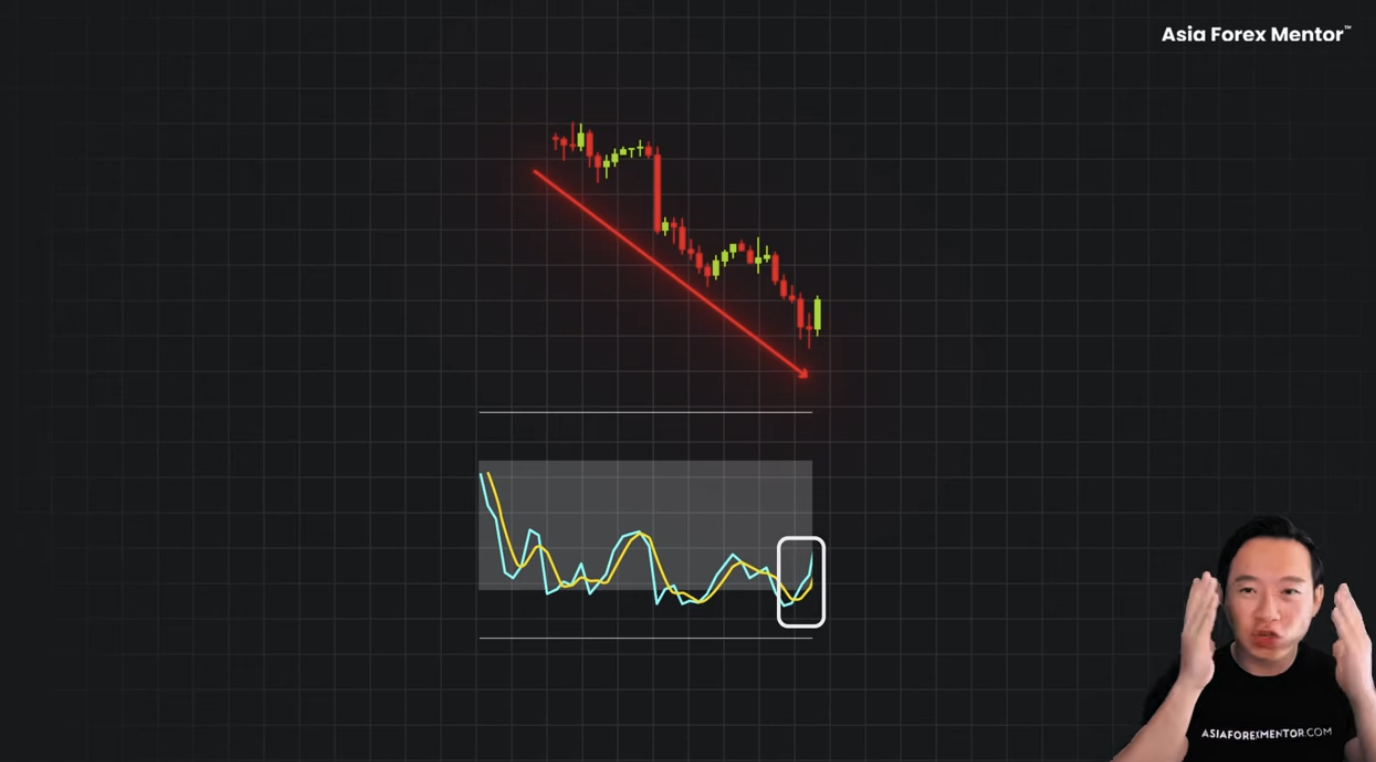
Now here is the question. Would you take this trade? If you said yes, you just lost money.
AFM Research Lab tested 2,440 trades across every common way this indicator is being used. Every single version lost money. A $10,000 account became $255.
But there is one version that works.
Past performance in backtest results does not guarantee future returns.

What Most Traders Get Wrong
Traders treat the stochastic like a buy and sell signal. It is not.
Think about it like a speedometer. It tells you how fast the market is moving. It tells you nothing about where you are right now. You could be on an open highway where you can cruise. Or you could be about to drop straight off a cliff.
This guide covers three things. Why the signal fails when it should work. The three conditions that make it worth taking. And the exact rules that make the stochastic a winner
The stochastic shows you where price closed relative to its recent range, on a scale from zero to 100.
When it is above 80, that is called overbought. When it is below 20, that is called oversold.
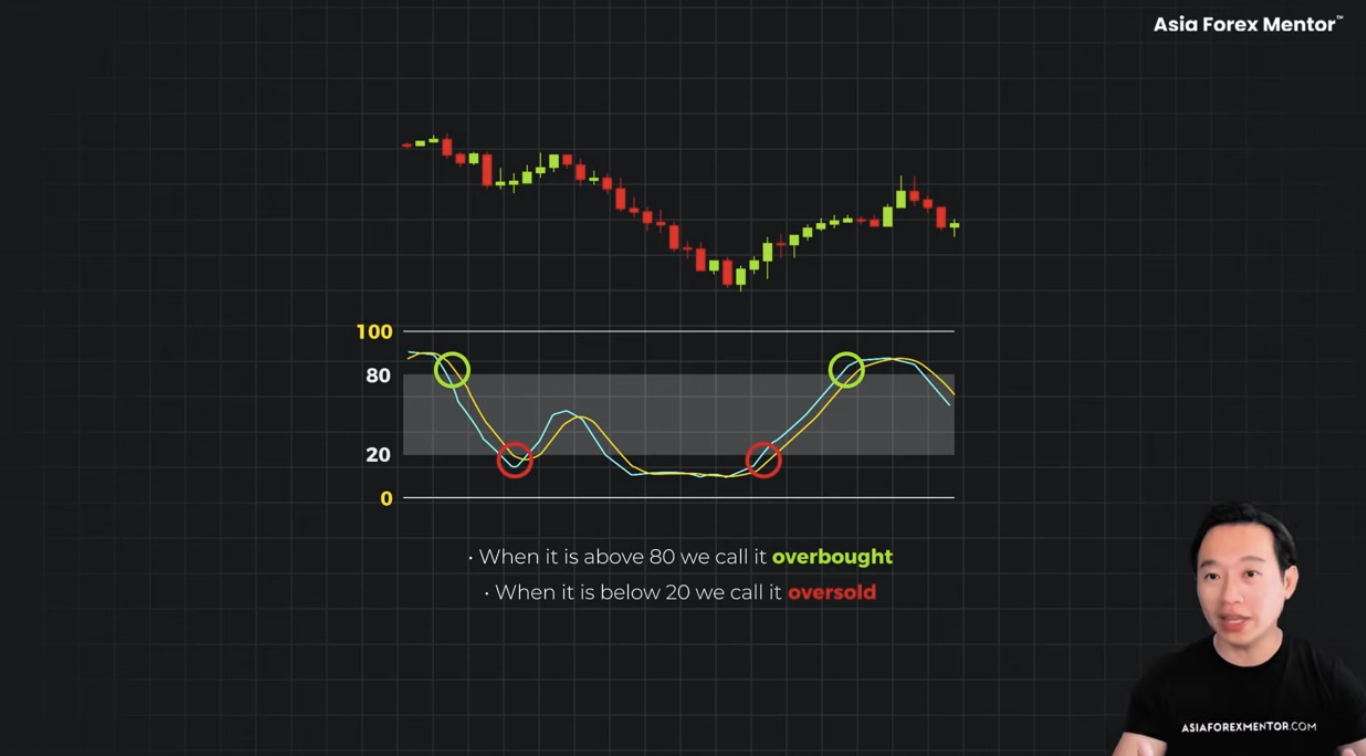
Two lines. The K line, the percentage K, the fast one. And the D line, the percentage D, the signal line. When they cross inside those two extremes, that is the classic signal.
It sounds simple. That is exactly the problem. It is so simple that traders literally take the signal when it happens and nothing else.
AFM Research Lab tested three ways that traders use. Watch each one break.
Method 1: The Raw Crossover
The lines cross in the oversold zone. So you buy.
Take a look at this chart. Price is falling. Lower highs, lower lows. Clean downtrend. Then the stochastic drops into the oversold zone and the lines cross up. That is your signal. You buy. You put your stop loss under the swing low.
Then price keeps going through your stop loss.
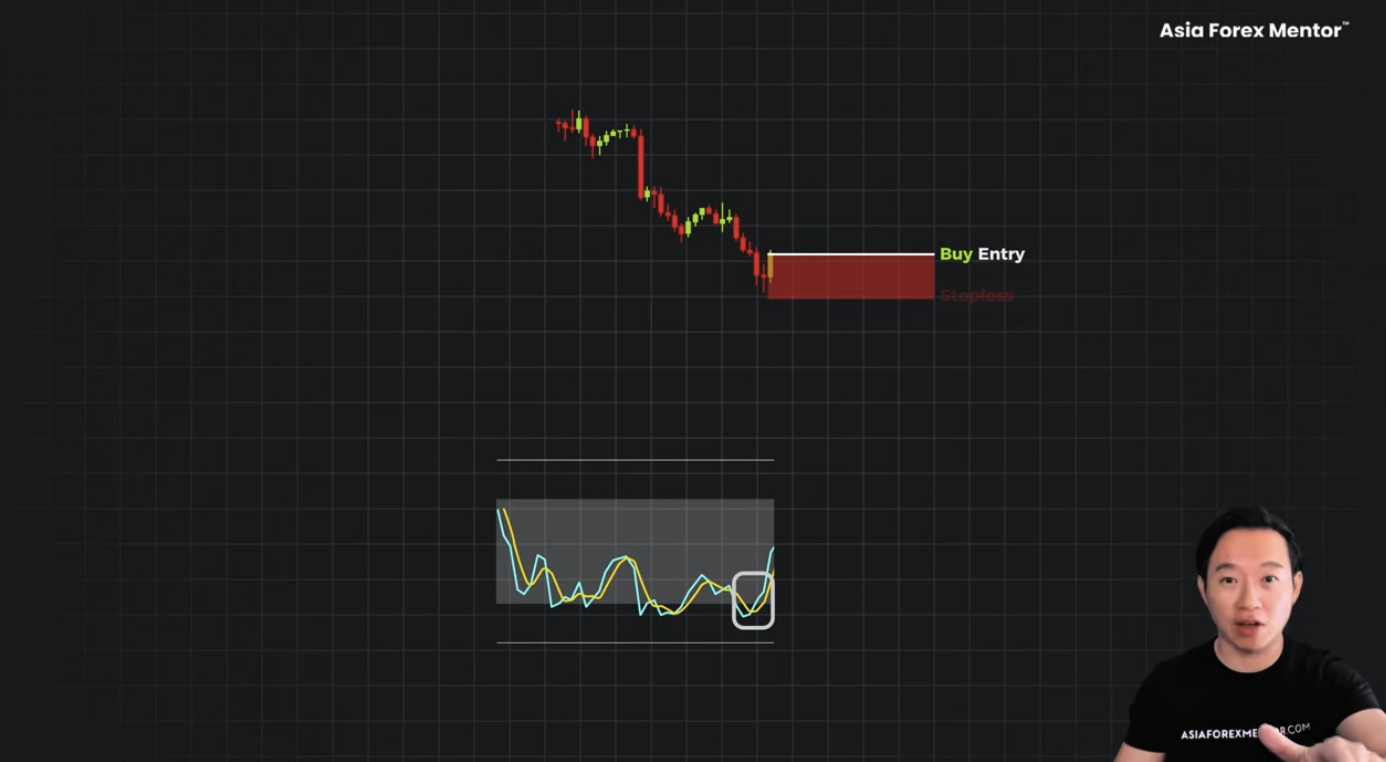
Here is the part that hurts. It fires again. Same setup. Oversold, cross up. So you think, okay, now it is going to turn. Now it is actually turning. You buy. Price keeps falling.
The indicator does not know that the trend exists. It just keeps firing.
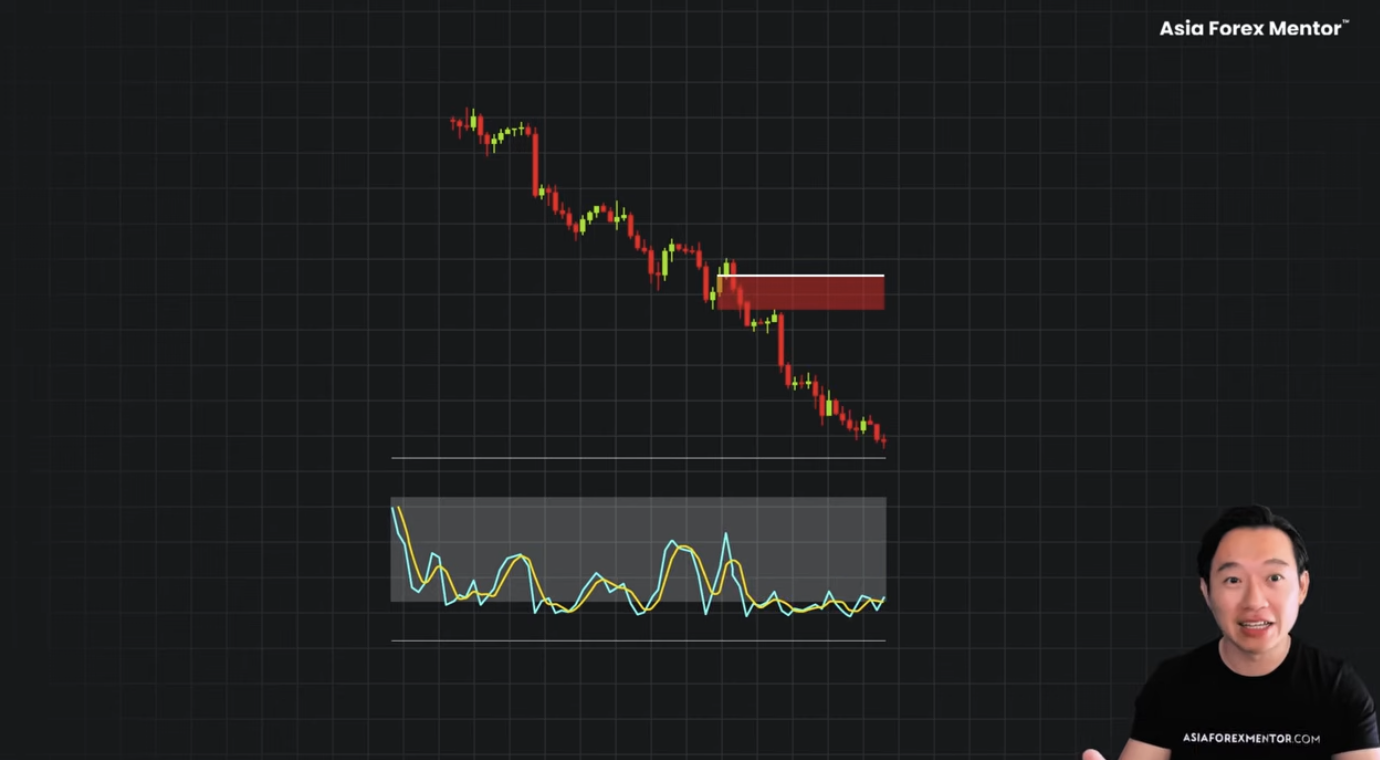
Maximum drawdown on this version: 97.6 percent. That is not a bad month. That is near total destruction of the account.
Method 2: Fade The Extremes
Traders think, okay, fine. Only take the strongest readings. When price is in a strong uptrend and the stochastic pushes above 80, the lines cross down. Momentum is exhausted. Sell at the top.
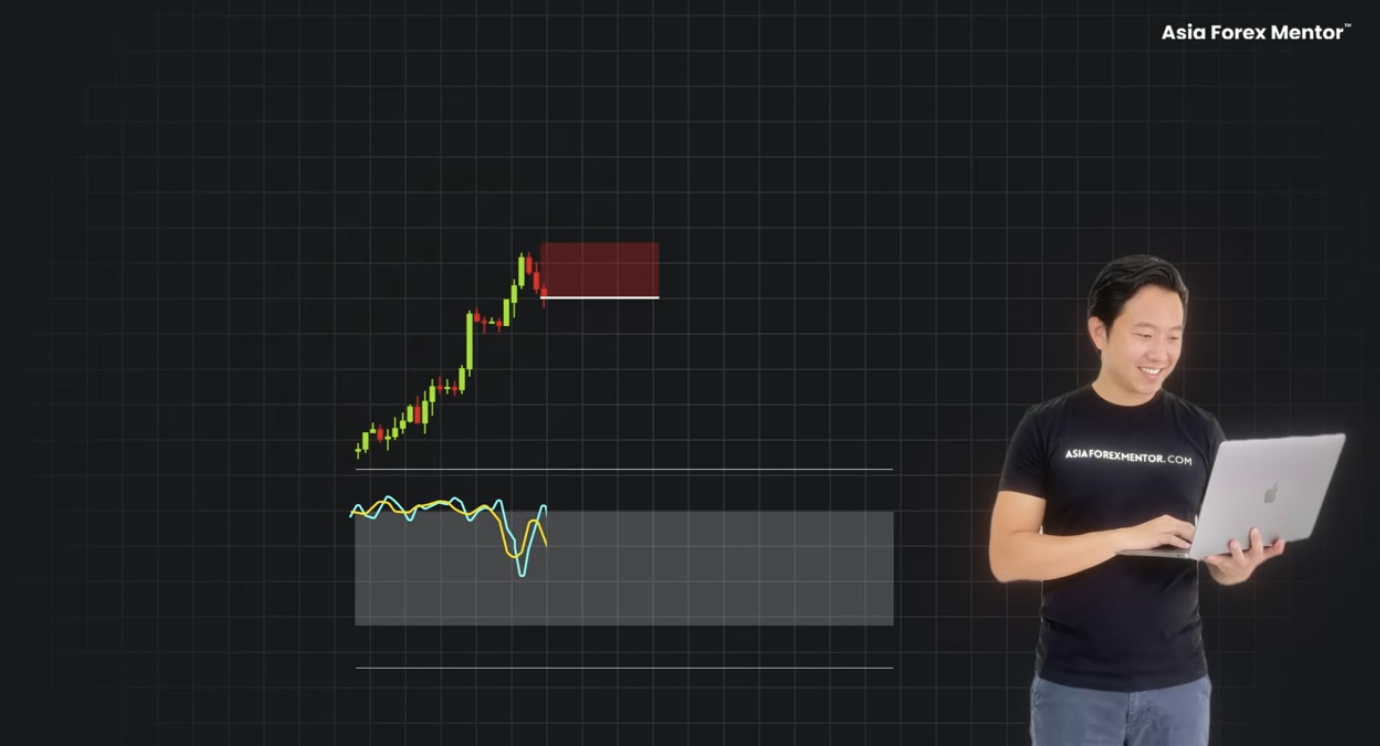
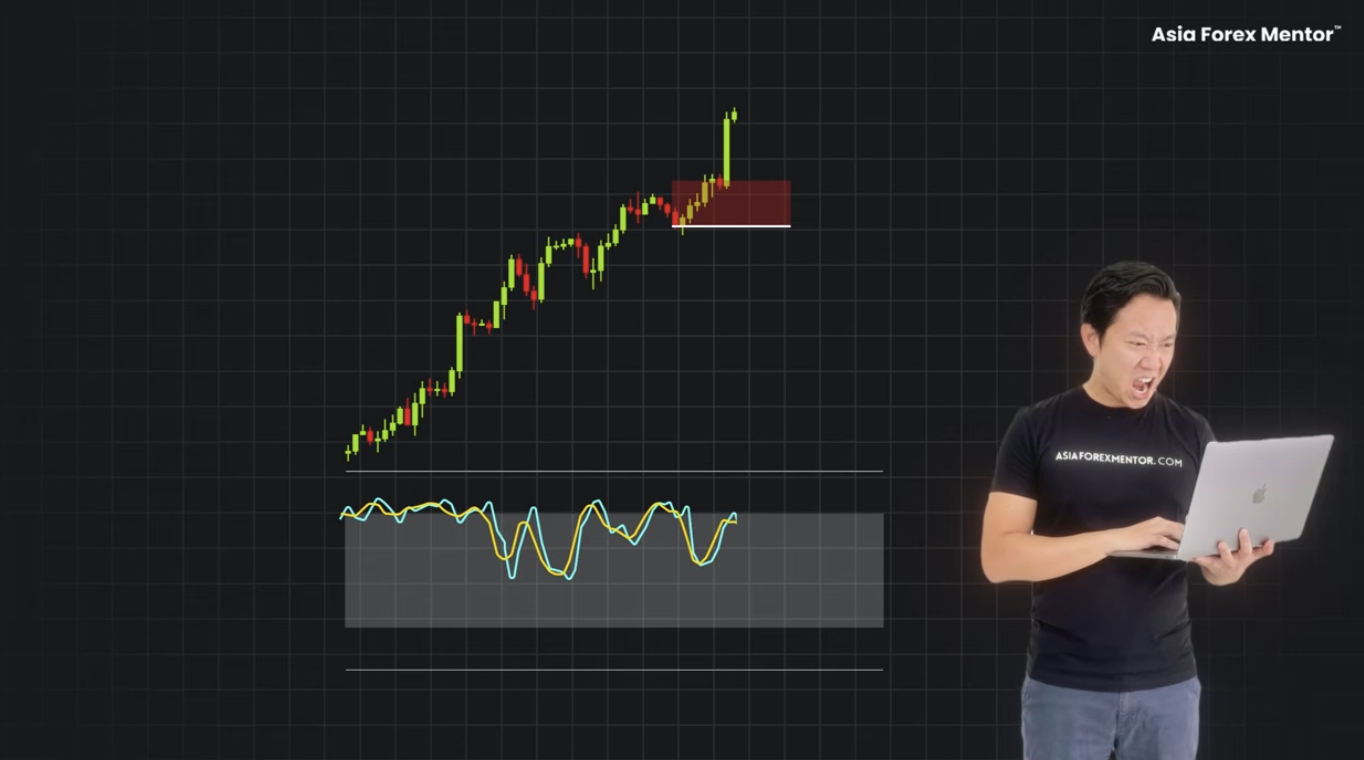
Look what happens. Price makes a higher high. It takes out the stop. The stochastic resets and climbs back above 80. The lines cross down again. Short again. Stopped out. Another higher high. Another stop.
Three signals. Three losses.
Because in a trend, the extreme reading is not exhaustion. It is strength. You are shorting the strongest market head on.
Method 3: Add A Level
Give the signal a level. Sounds reasonable.
When AFM Research Lab ran the test on this version, the profit factor came back at 0.79. For every dollar made, $1.27 went back out. The CAGR was negative 30.6 percent.
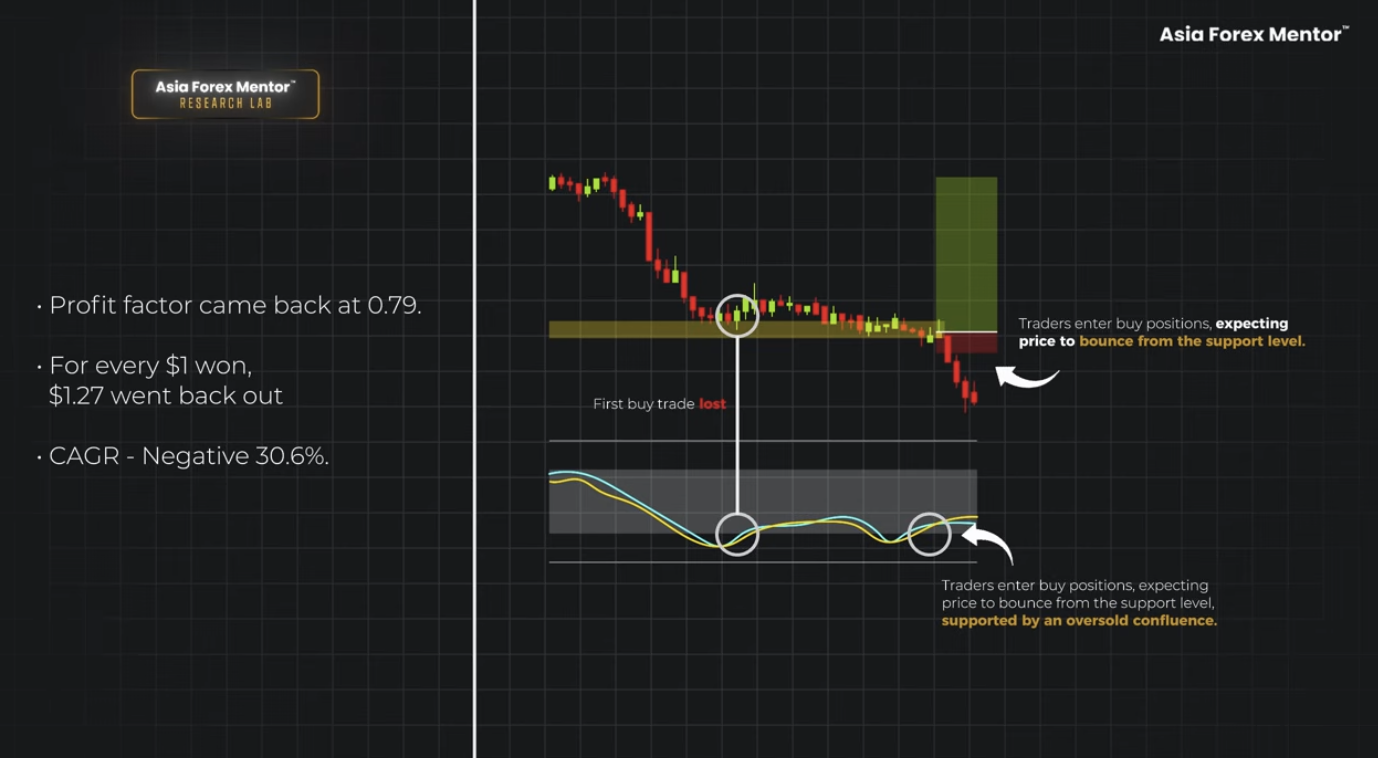
Here is why. Most of those levels were not real structure. Traders were drawing lines on anything that looked like a pause in the market.
Out of 2,440 trades tested across all three methods, every version lost money. That tells you something important. The signal was not the problem. It was placed in the wrong location.
The stochastic is a tool. If you place the wrong tool in the wrong location, this is what happens.
The Winning Version — Three Conditions
AFM Research Lab ran the same sample through hundreds of parameter combinations and walk-forward scenarios. One version came back clean. It comes down to three conditions.
Condition 1: The Trend
Set the stochastic to a 55-bar lookback. That is long enough that the reading reflects the real range, not just the last few candles.
Then go to the daily.
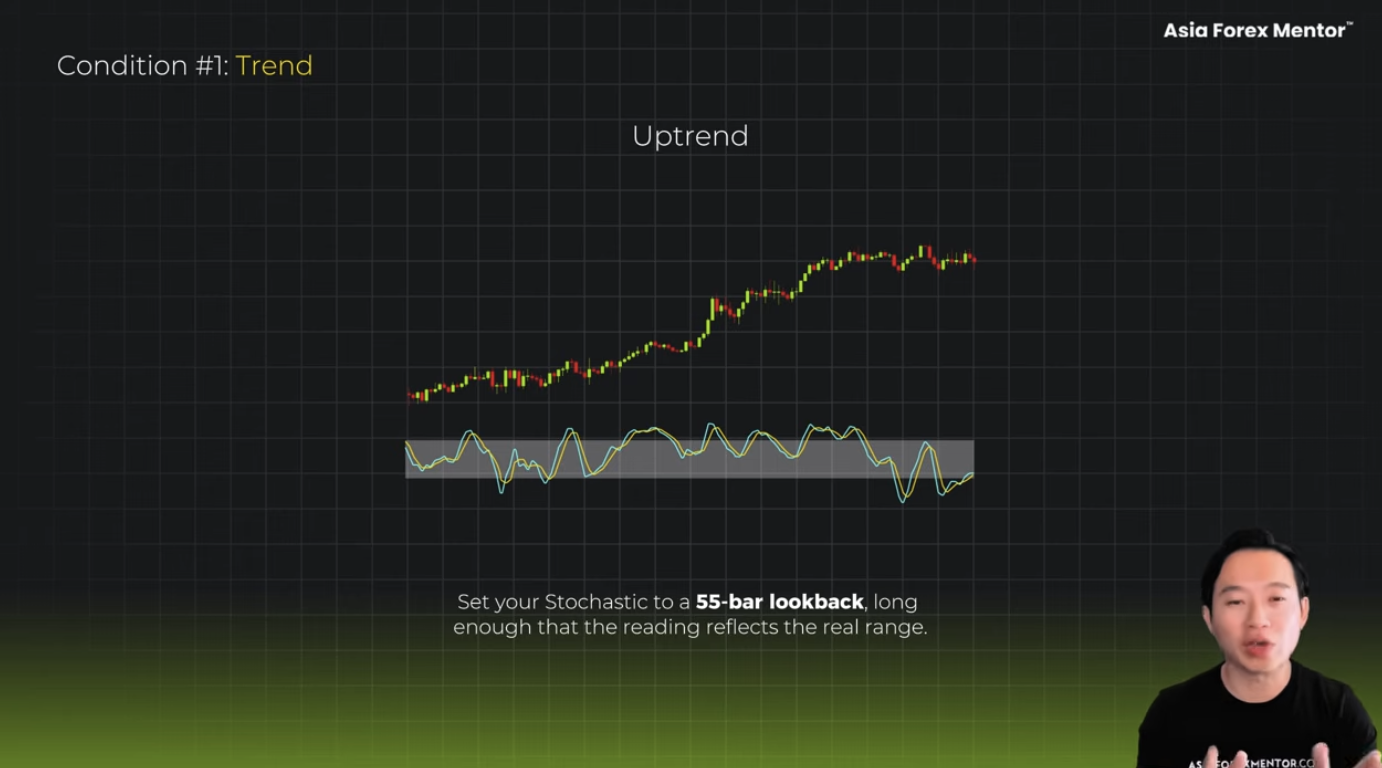
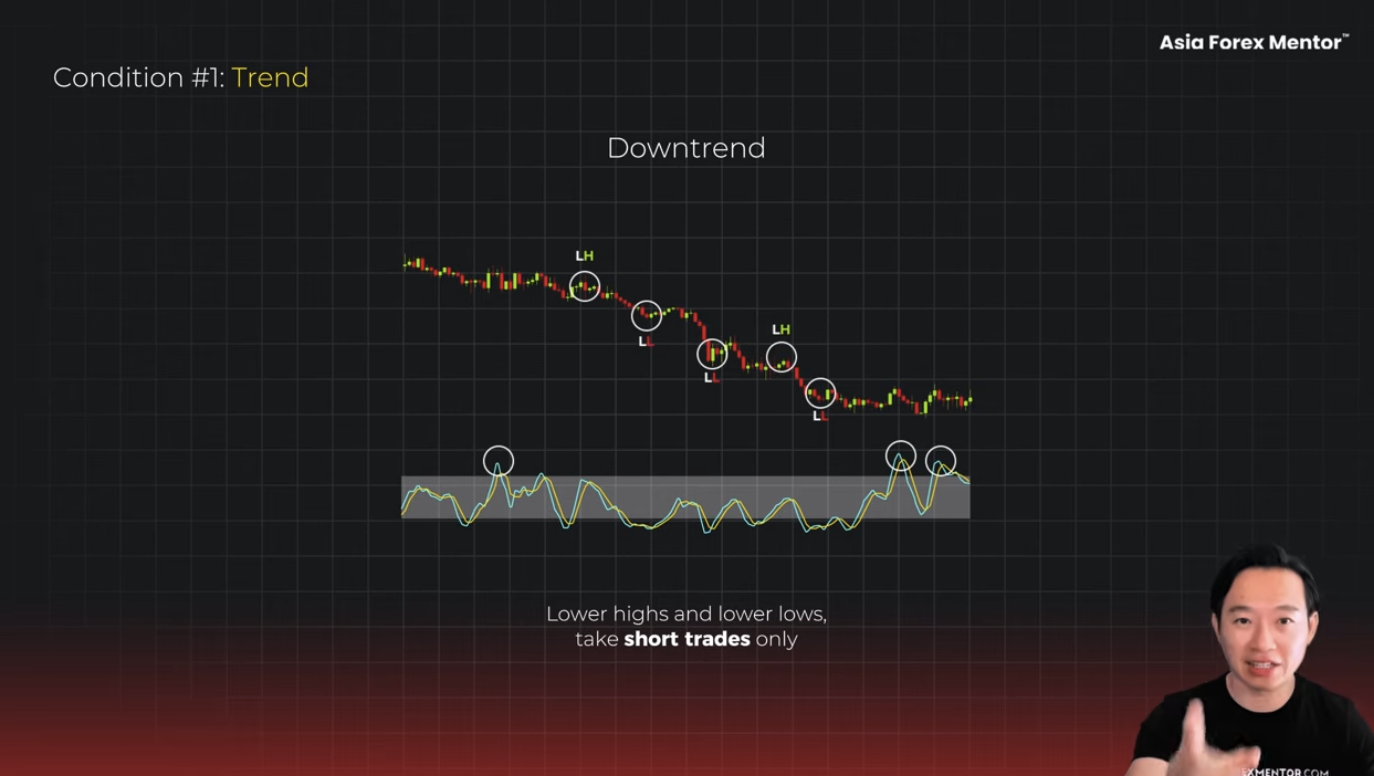
Higher highs, higher lows. In an uptrend, long only. Only buys.Lower highs, lower lows. In a downtrend, short only. Only sells.
In a downtrend, the stochastic has exactly one job. When the K reading is above 80, when price pulls back against the direction, that is where you go for a sell.
Condition 2: The Level
This is where most traders get lazy. Pay attention.
Look at this chart. On the left, it is a decisive impulse. Big candles, big candles, big candles. One direction. No hesitation. It is an impulse. Price did not drift out of the zone. It just ran.
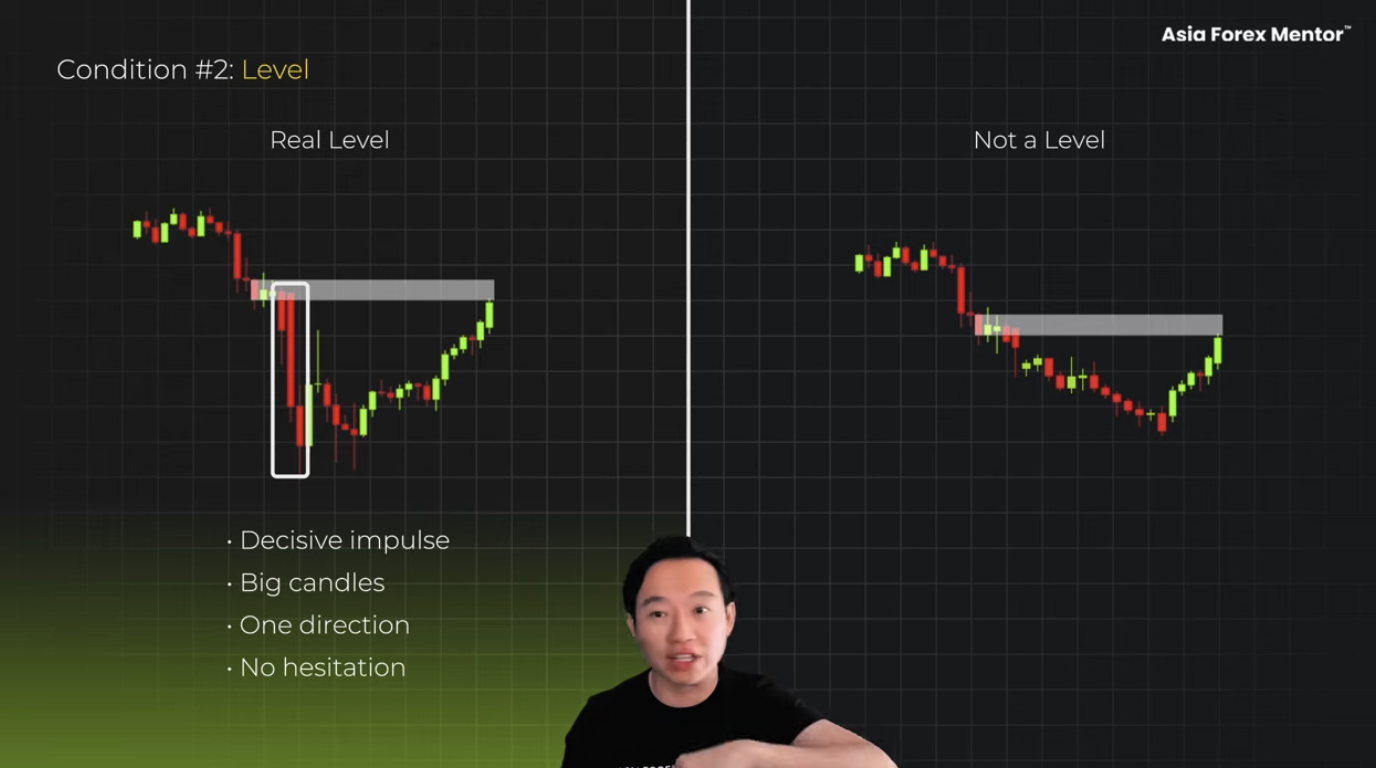
When price runs like that, it leaves something behind. It leaves a lot of orders that people were trying to get in, but were not filled because price shot up. Traders who missed it. That zone becomes a place where the market actually remembers.
On the right hand side is a slow grind lower. Small candles. No conviction. Ask yourself, does anybody remember this? Nobody is sitting there waiting. Nobody was left behind. Everybody managed to enter on that trade.
That is not a level. That is just price moving.
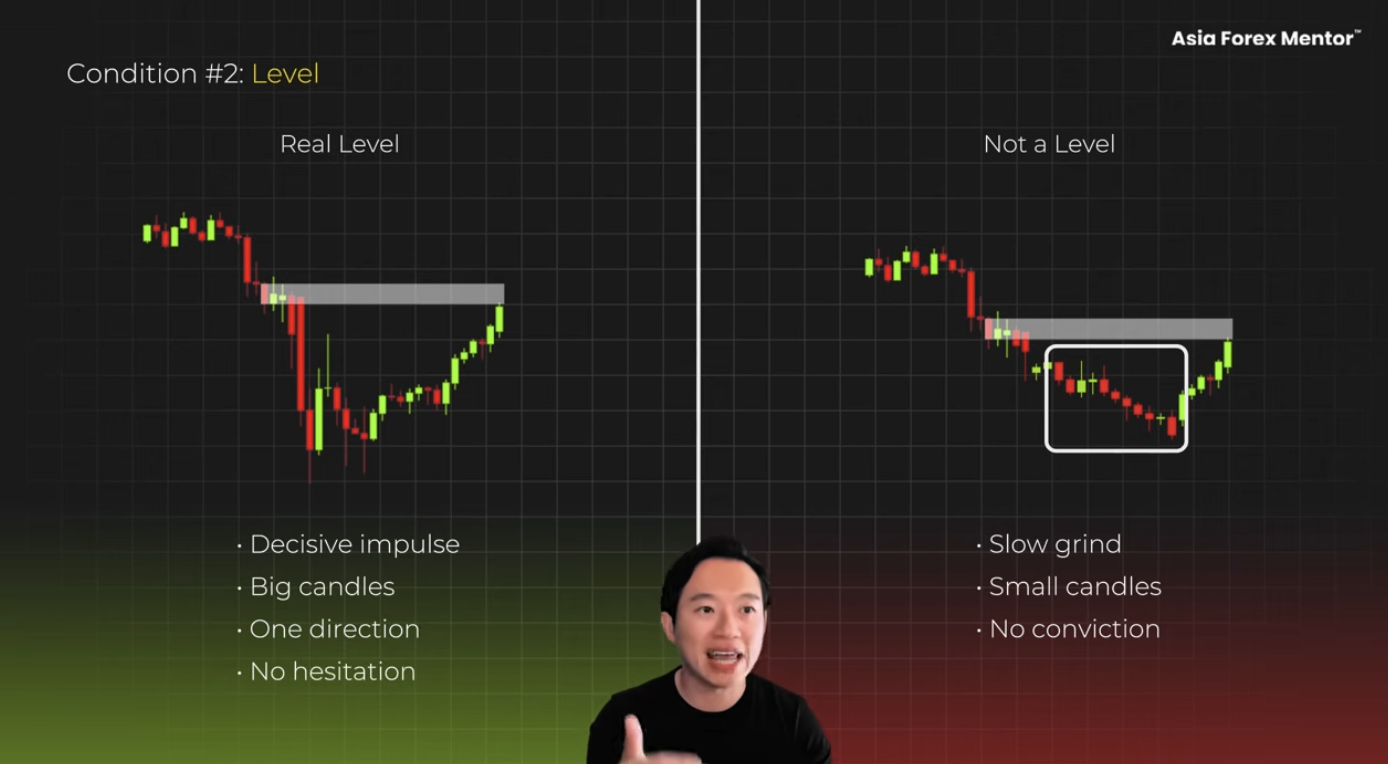
Here is the test. If price exploded out of the zone, you have a level. If it wandered out with small bars, you have nothing.
Condition 3: The Trigger
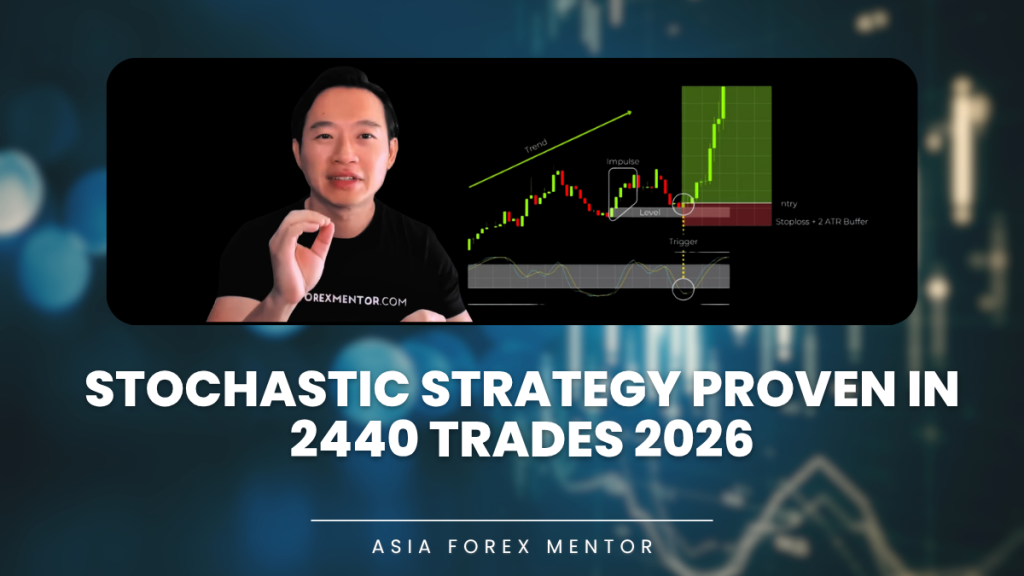
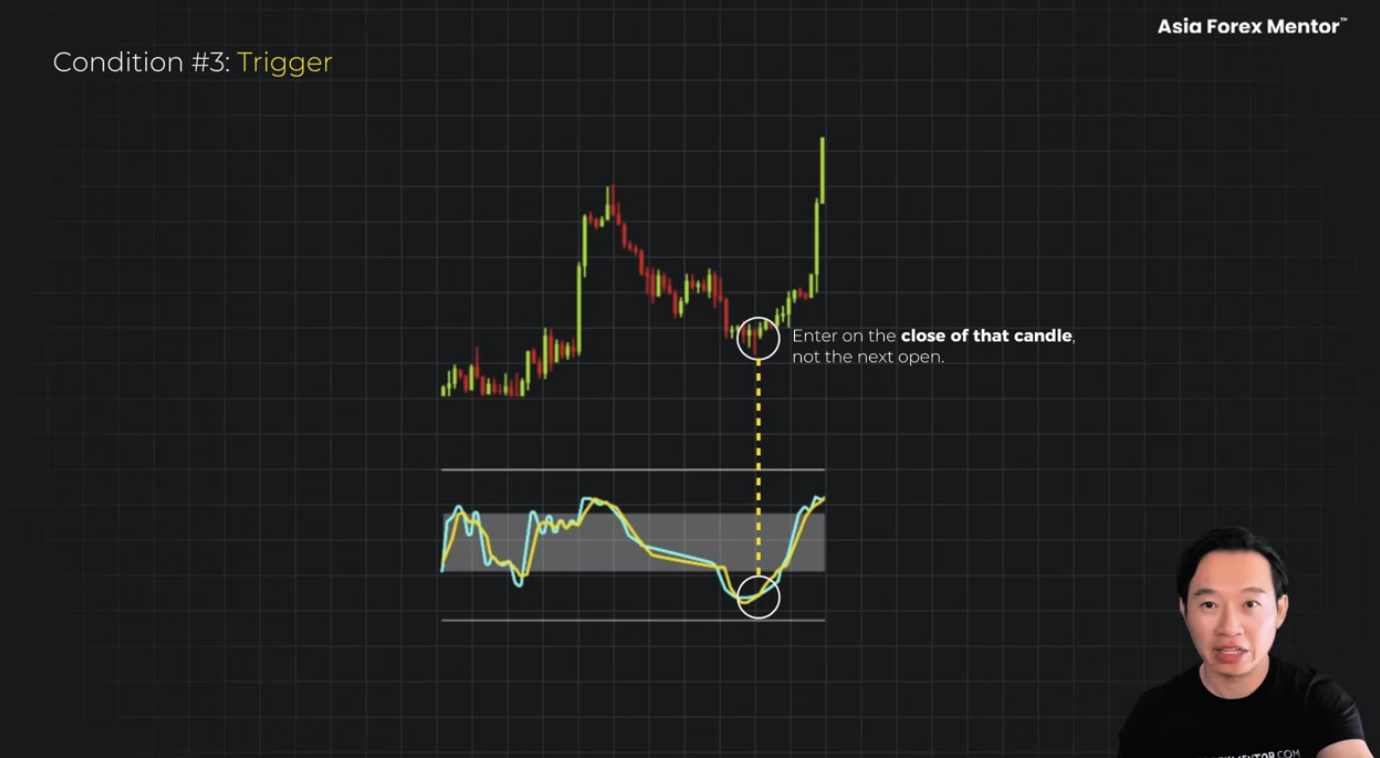
Both the %K and the %D have to be inside the extreme levels, and they have to cross there together.
Not the K dipping in while the D stays outside. Both. Together. Enter on the close of that candle. Not the next open. If you miss any of those three conditions, you are back to the methods that lost money.
Execution Rules
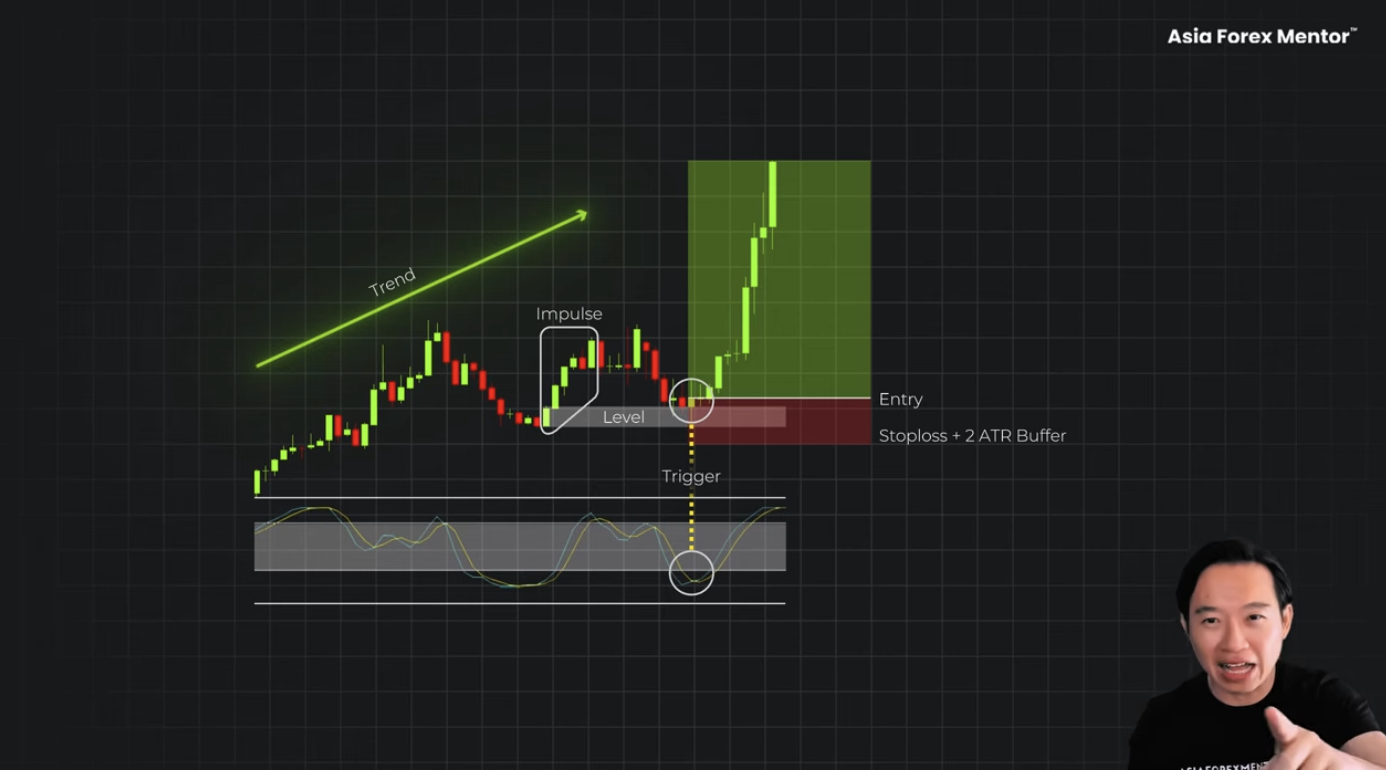
The stop goes below the swing low that formed the zone. Plus a 2 ATR buffer.
Why the buffer? A tight stop is fine until normal market noise takes you out of a trade that was working perfectly. When there is a 2 ATR buffer, it sits beyond the noise. You get stopped out when you are actually wrong. Not when the market twitches.
Example 1: GBPUSD Short
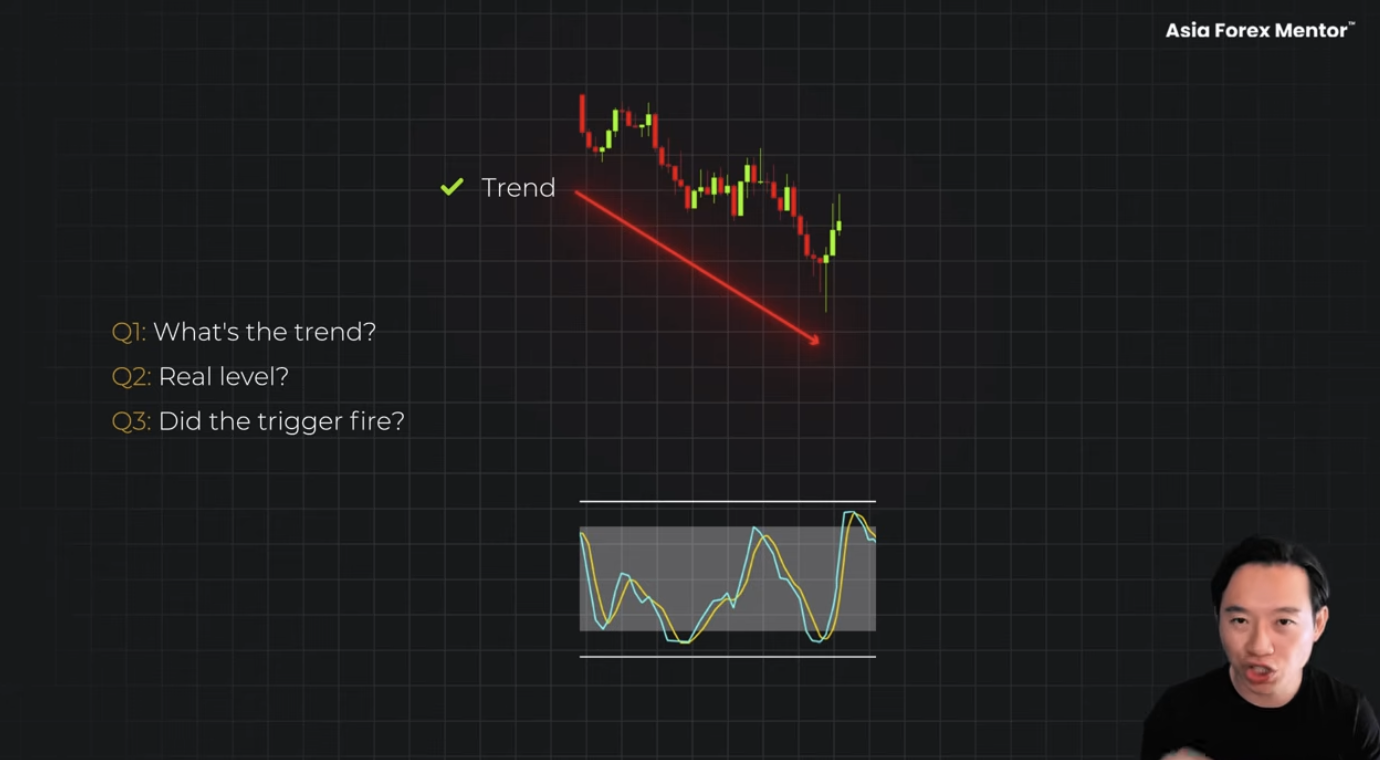
Three questions.
Question one. What is the trend? Look at the daily timeframe. Lower highs, lower lows. Downtrend. Sell only.
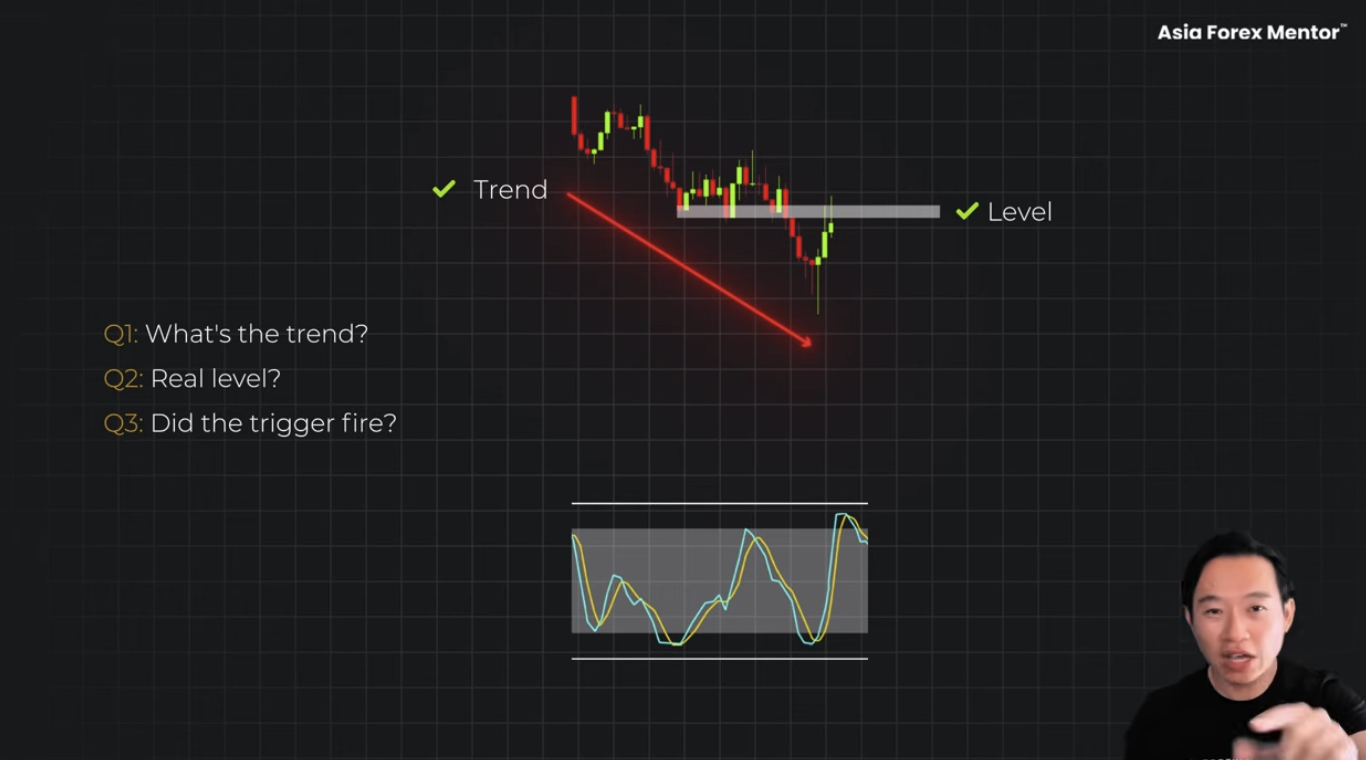
Question two. Is it a real level? Yes. The resistance was left behind by an earlier impulsive breakdown. Price has now rallied right back into it. Real level.
Question three. Did the trigger fire? The stochastic pushes above 80. Both lines are inside. And they cross back down. That close is the entry.
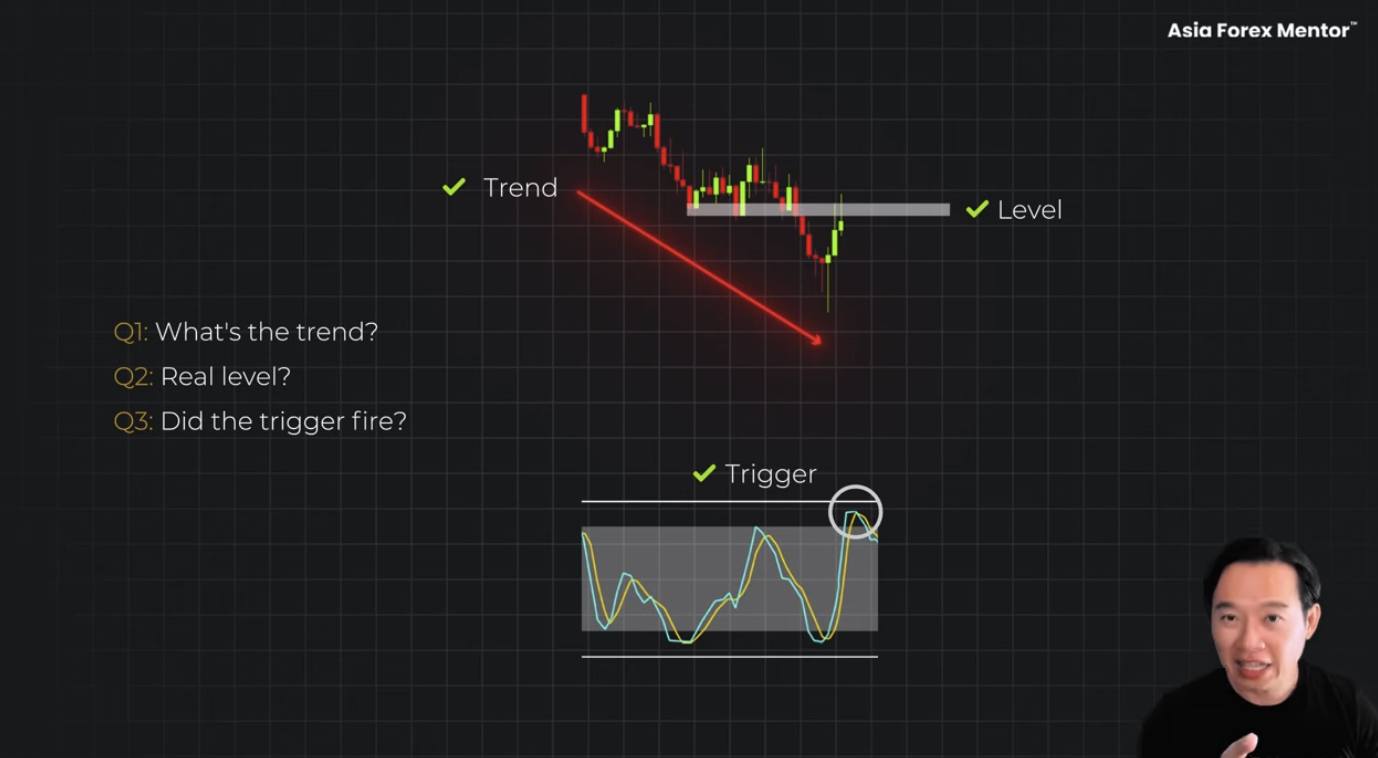
Stop loss above the swing high plus the buffer. Take profit at the next swing low. The distance clears the minimum 1:1.5 risk-to-reward. The trade qualifies.
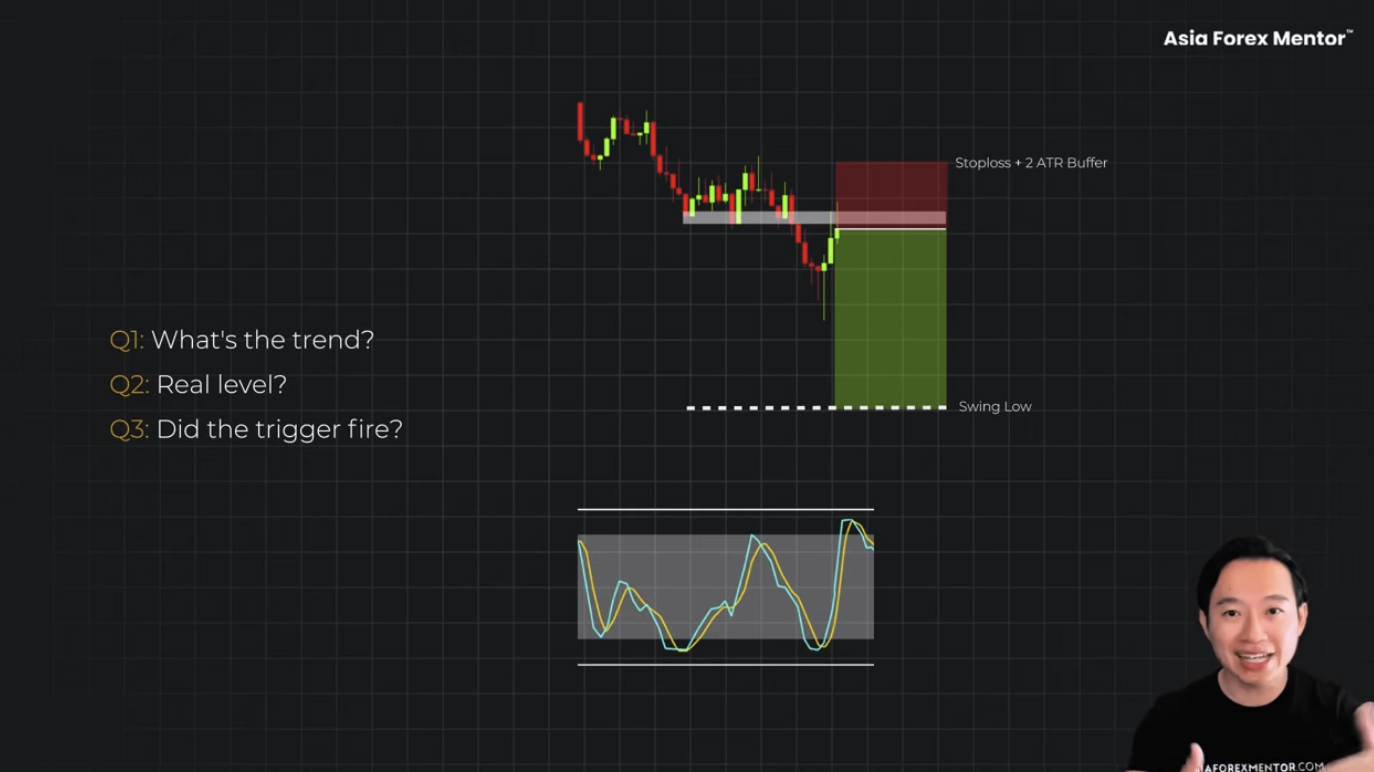
Price drives straight down to the target. The stop loss was never touched.
Trend. Level. Trigger. All three.
Example 2: An Uptrend Long
Same three questions. This time on the upside.
Question one. What is the trend? Higher highs, higher lows. Uptrend. Buy only. Not even looking at short setups on this chart.
Question two. Is price at a real level? Watch this. Price made an impulsive move up. Strong candles. A clean drive up. Then price pulls back into the zone where that impulse came from. This is no longer a random swing point. It is the origin of the move.
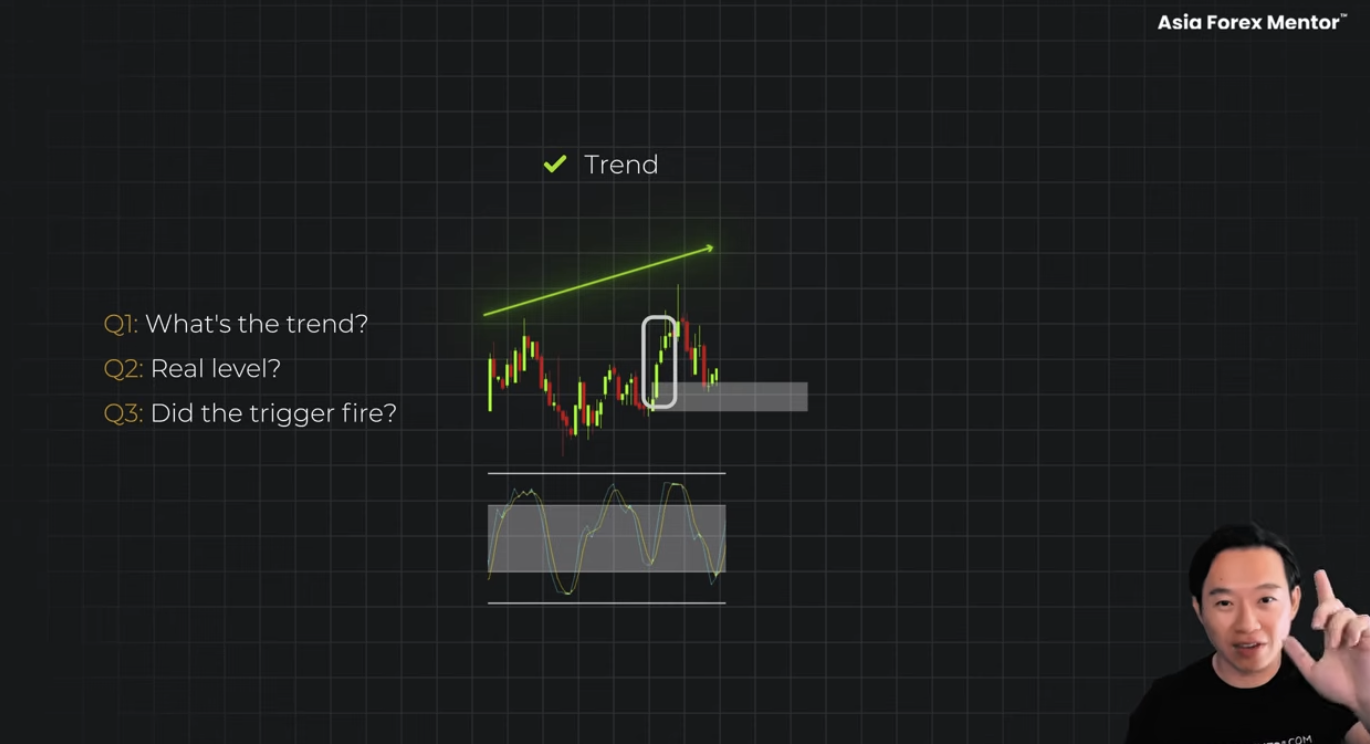
Question three. Did the trigger fire? Both lines are below 20. They both cross up together inside the extreme. Not one line. Both.
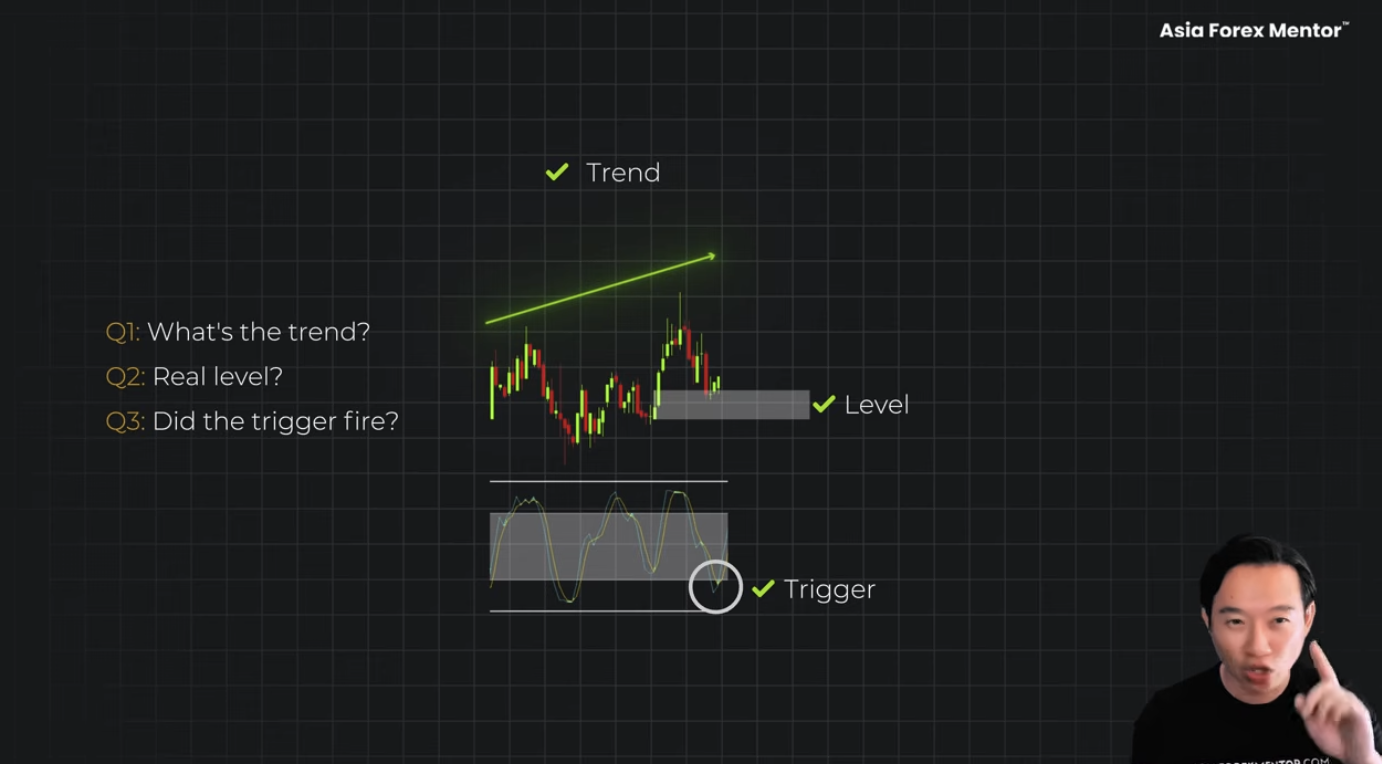
That close is the entry.
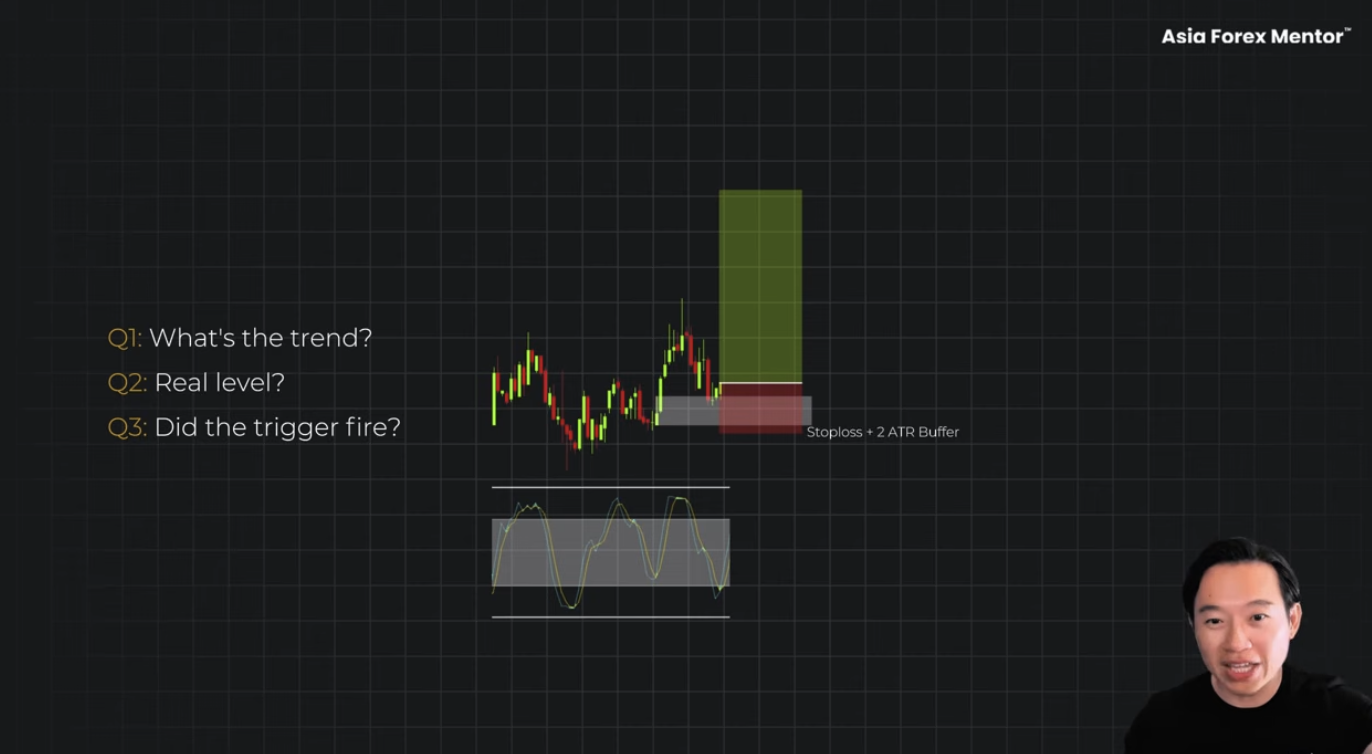
Stop loss below the swing low plus the buffer. Take profit at the next structural swing high. Clears the 1.5R minimum.
Price takes off and runs to the target. Stop loss was never touched.
Same three questions every single time. That is the whole point. Not reading the chart differently for longs and shorts. Running the same three checklists.
Also Read: Forex Trading Strategies That Work: A Complete Guide to Consistent Profits
What It All Comes Down To
Number one. The stochastic is not a buy or sell signal alone. It measures momentum, not location. That is why the raw crossover blew a 97.6 percent drawdown across the sample.
Number two. The three conditions every single time. The trend on the daily. A level built by real impulse. And both lines crossing together inside the extreme. Miss one and you are back to losing money. All three.
Number three. Stop loss below the swing plus the 2 ATR buffer. Take profit at the next structural swing with a minimum of 1.5R.
This is not going to win every trade. There is no such thing as winning every trade. But out of everything AFM Research Lab tested, the 2,440 trades, this is the only version with a real edge.
Frequently Asked Questions