
Learn To Trade Forex • Best Forex Trading Course • AsiaForexMentor

S&P 500 Slips as Strong Jobs Data Revives Fed Rate Hike Fears

Written by:

Ezekiel Chew

Last updated on:

September 6, 2026

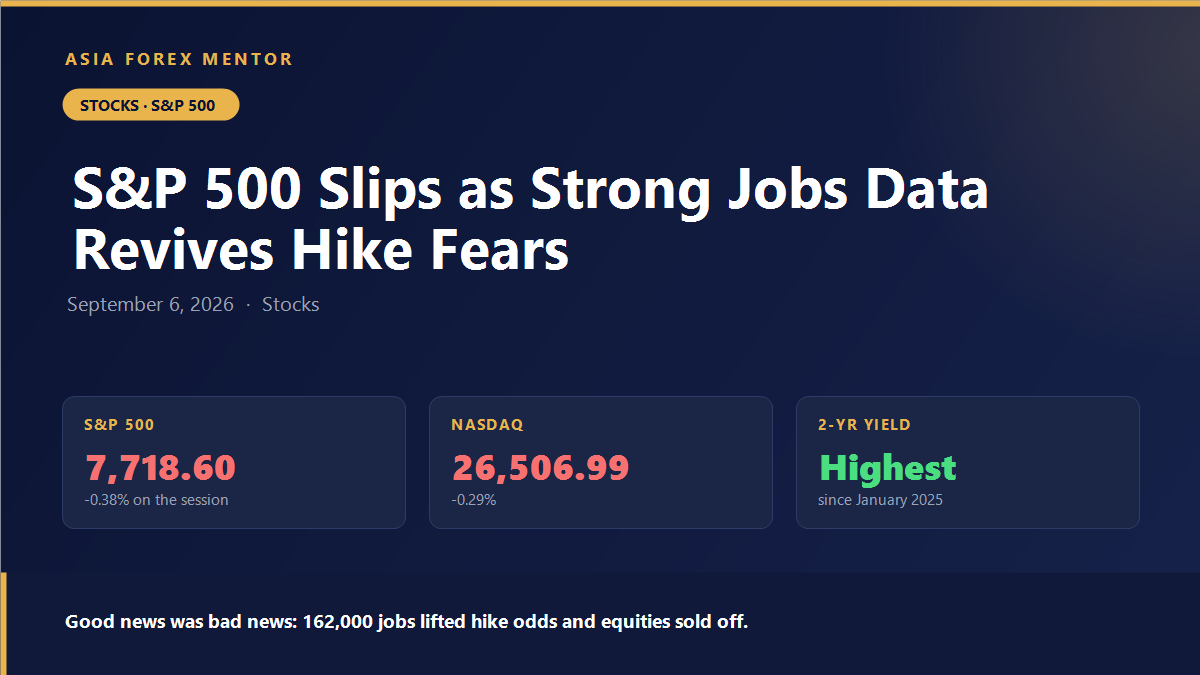
S&P 500 down 0.38% to 7,718.60 and Nasdaq down 0.29% to 26,506.99 after the August jobs report

Good news was bad news on Wall Street this week, and the mechanism behind it is worth understanding because it is likely to drive the market for the rest of September.

The S&P 500 fell 0.38% to close at 7,718.60 on Friday 4 September, while the Nasdaq Composite dropped 0.29% to 26,506.99. Treasury yields rose, with the two-year hitting its highest level since January 2025.

The trigger was a jobs report that was far too strong.

The Number That Moved the Market

August non-farm payrolls came in at 162,000 against a Dow Jones consensus of just 53,000 — more than triple the forecast. The unemployment rate held steady at 4.1%, matching expectations.

In an ordinary cycle, a labour market beating expectations by 109,000 jobs would be celebrated. In this one, it lifted the implied probability of a Federal Reserve rate hike at the 15–16 September meeting to about 58% in fed funds futures — and equities sold off.

One detail from the report drew particular attention: women accounted for approximately 158,000 of the 162,000 jobs added, roughly 98% of the total, according to a CNBC analysis of the BLS data. That concentration raises questions about the breadth of hiring beneath a strong headline.

Why Strong Jobs Data Hurts Stocks Now

The logic runs through the discount rate. Equity valuations are the present value of future earnings, and rising yields reduce that present value. When yields rise because growth is accelerating, earnings expectations usually rise enough to offset it. When yields rise because the central bank is expected to tighten into an inflation problem, they do not.

That second case is where the market sits. Inflation has been re-accelerating, partly through energy prices tied to the ongoing conflict in the Middle East, and Fed Chair Kevin Warsh signalled at Jackson Hole on 28 August that rates could still go up. A strong labour market removes the Fed’s main reason for restraint.

The two-year yield reaching its highest level since January 2025 is the cleanest expression of this. That part of the curve tracks policy expectations more directly than any other, and it is telling you the market has genuinely repriced.
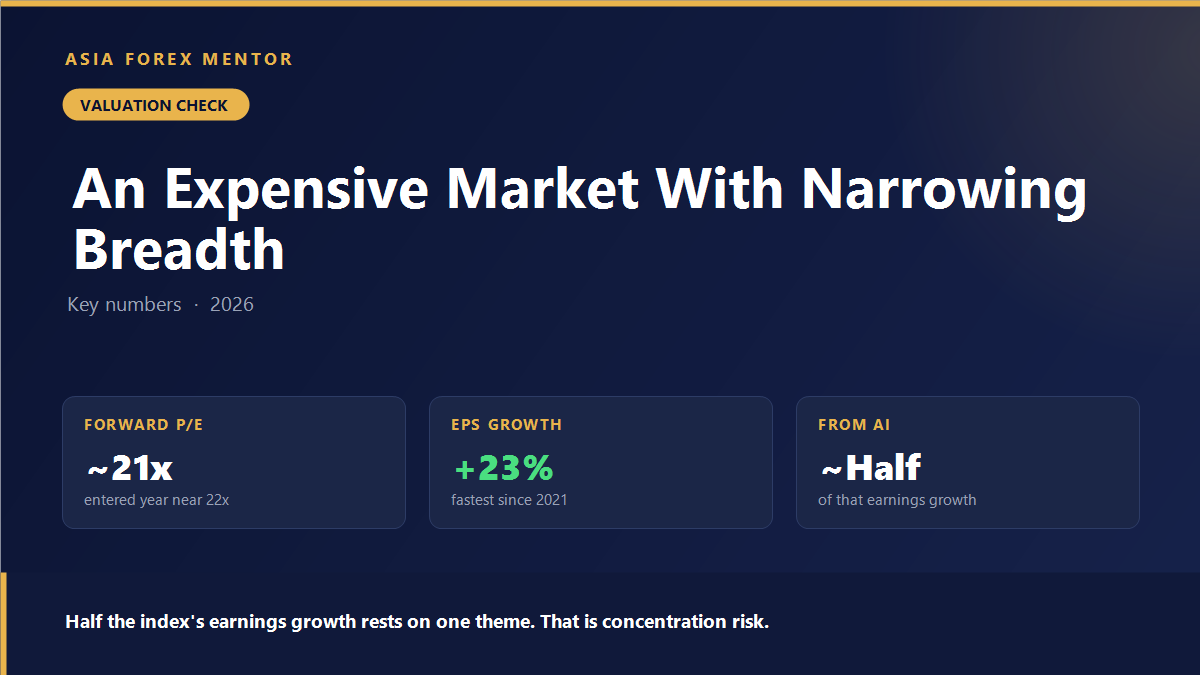
S&P 500 forward price to earnings near 21 times with roughly half of earnings growth from AI

The Valuation Problem Underneath

The index is expensive, which is why a modest repricing of rates produces an outsized reaction.

The S&P 500 entered 2026 with a forward price-to-earnings ratio around 22 — among its most expensive readings on record, exceeded only during the dot-com bubble and the COVID-19 period. Strategists expect the multiple to hold near 21 times earnings, with modest declines in Treasury yields offset by slowing growth, geopolitical uncertainty and scepticism about the durability of AI-related profits.

That last point deserves emphasis. Consensus expects full-year revenue growth of 11% — the fastest since 2022 — and earnings growth of 23%, the fastest since 2021. Roughly half of that earnings growth is expected to come from AI-infrastructure beneficiaries.

A market trading at 21 to 22 times earnings, where half the earnings growth depends on one theme, has limited tolerance for a higher discount rate.

Breadth Is the Warning Sign

Despite Friday’s decline, the index remains 19.09% higher than a year ago. This has been a strong twelve months.

But analysts have flagged two cautionary signals beneath the surface: a sharp increase in momentum, and narrowing market breadth. Narrow breadth means fewer stocks are doing the work. When leadership concentrates, index-level strength can persist while the average stock stalls — and it makes the whole index vulnerable to a stumble in a handful of names.

Single-stock moves this week illustrated the fragility. Lululemon plunged on its results even as the broad index fell less than half a percent, a reminder that in a concentrated, richly valued market, disappointment gets punished hard.

What to Watch Next

Two dates decide the near term:

  • 11 September — August CPI. The final significant input before the Fed meets. A hot core reading alongside a 162,000 payrolls print would make a hike difficult to avoid.
  • 15–16 September — FOMC decision. At 58% implied odds, this is a genuine coin flip, and coin flips at these valuations produce real volatility.

How to Position Around a Two-Sided Event

Distinguish yield-driven selling from growth-driven selling. They look identical on a daily chart and mean opposite things. Yield-driven selling compresses multiples across the board — quality does not protect you. Growth-driven selling is selective.

Watch the two-year, not the ten-year. Policy expectations live at the short end. If the two-year stops rising, the equity pressure eases regardless of what the long end does.

Respect concentration risk. If roughly half of expected earnings growth comes from AI infrastructure, an index position is a more concentrated bet than it appears.

Do not fade a coin flip. A 58% probability means the market does not know. Positioning aggressively for either outcome is speculation on a genuinely unknown event, not analysis.

For traders working through how to size and manage equity exposure through macro events, our stock trading guides cover the practical mechanics.

The Bottom Line

The S&P 500 is up 19% on the year, trading near 21 times forward earnings, with narrowing breadth and a coin-flip rate decision in ten days. Friday’s 0.38% decline was small. What it revealed about the market’s sensitivity to yields was not.

Figures cited are as of 4 September 2026 close. Market data moves quickly; verify current levels before trading. This article is general information, not personal financial advice.
About Ezekiel Chew​

Ezekiel Chew, founder and head of training at Asia Forex Mentor, is a renowned forex expert, frequently invited to speak at major industry events. Known for his deep market insights, Ezekiel is one of the top traders committed to supporting the trading community. Making six figures per trade, he also trains traders working in banks, fund management, and prop trading firms.

S&P 500 Slips as Strong Jobs Data Revives Fed Rate Hike Fears

Written by:

Updated:

September 6, 2026
S&P 500 down 0.38% to 7,718.60 and Nasdaq down 0.29% to 26,506.99 after the August jobs report Good news was bad news on Wall Street this week, and the mechanism behind it is worth understanding because it is likely to drive the market for the rest of September. The S&P 500 fell 0.38% to close at 7,718.60 on Friday 4 September, while the Nasdaq Composite dropped 0.29% to 26,506.99. Treasury yields rose, with the two-year hitting its highest level since January 2025. The trigger was a jobs report that was far too strong.

The Number That Moved the Market

August non-farm payrolls came in at 162,000 against a Dow Jones consensus of just 53,000 — more than triple the forecast. The unemployment rate held steady at 4.1%, matching expectations. In an ordinary cycle, a labour market beating expectations by 109,000 jobs would be celebrated. In this one, it lifted the implied probability of a Federal Reserve rate hike at the 15–16 September meeting to about 58% in fed funds futures — and equities sold off. One detail from the report drew particular attention: women accounted for approximately 158,000 of the 162,000 jobs added, roughly 98% of the total, according to a CNBC analysis of the BLS data. That concentration raises questions about the breadth of hiring beneath a strong headline.

Why Strong Jobs Data Hurts Stocks Now

The logic runs through the discount rate. Equity valuations are the present value of future earnings, and rising yields reduce that present value. When yields rise because growth is accelerating, earnings expectations usually rise enough to offset it. When yields rise because the central bank is expected to tighten into an inflation problem, they do not. That second case is where the market sits. Inflation has been re-accelerating, partly through energy prices tied to the ongoing conflict in the Middle East, and Fed Chair Kevin Warsh signalled at Jackson Hole on 28 August that rates could still go up. A strong labour market removes the Fed's main reason for restraint. The two-year yield reaching its highest level since January 2025 is the cleanest expression of this. That part of the curve tracks policy expectations more directly than any other, and it is telling you the market has genuinely repriced. S&P 500 forward price to earnings near 21 times with roughly half of earnings growth from AI

The Valuation Problem Underneath

The index is expensive, which is why a modest repricing of rates produces an outsized reaction. The S&P 500 entered 2026 with a forward price-to-earnings ratio around 22 — among its most expensive readings on record, exceeded only during the dot-com bubble and the COVID-19 period. Strategists expect the multiple to hold near 21 times earnings, with modest declines in Treasury yields offset by slowing growth, geopolitical uncertainty and scepticism about the durability of AI-related profits. That last point deserves emphasis. Consensus expects full-year revenue growth of 11% — the fastest since 2022 — and earnings growth of 23%, the fastest since 2021. Roughly half of that earnings growth is expected to come from AI-infrastructure beneficiaries. A market trading at 21 to 22 times earnings, where half the earnings growth depends on one theme, has limited tolerance for a higher discount rate.

Breadth Is the Warning Sign

Despite Friday's decline, the index remains 19.09% higher than a year ago. This has been a strong twelve months. But analysts have flagged two cautionary signals beneath the surface: a sharp increase in momentum, and narrowing market breadth. Narrow breadth means fewer stocks are doing the work. When leadership concentrates, index-level strength can persist while the average stock stalls — and it makes the whole index vulnerable to a stumble in a handful of names. Single-stock moves this week illustrated the fragility. Lululemon plunged on its results even as the broad index fell less than half a percent, a reminder that in a concentrated, richly valued market, disappointment gets punished hard.

What to Watch Next

Two dates decide the near term:
  • 11 September — August CPI. The final significant input before the Fed meets. A hot core reading alongside a 162,000 payrolls print would make a hike difficult to avoid.
  • 15–16 September — FOMC decision. At 58% implied odds, this is a genuine coin flip, and coin flips at these valuations produce real volatility.

How to Position Around a Two-Sided Event

Distinguish yield-driven selling from growth-driven selling. They look identical on a daily chart and mean opposite things. Yield-driven selling compresses multiples across the board — quality does not protect you. Growth-driven selling is selective. Watch the two-year, not the ten-year. Policy expectations live at the short end. If the two-year stops rising, the equity pressure eases regardless of what the long end does. Respect concentration risk. If roughly half of expected earnings growth comes from AI infrastructure, an index position is a more concentrated bet than it appears. Do not fade a coin flip. A 58% probability means the market does not know. Positioning aggressively for either outcome is speculation on a genuinely unknown event, not analysis. For traders working through how to size and manage equity exposure through macro events, our stock trading guides cover the practical mechanics.

The Bottom Line

The S&P 500 is up 19% on the year, trading near 21 times forward earnings, with narrowing breadth and a coin-flip rate decision in ten days. Friday's 0.38% decline was small. What it revealed about the market's sensitivity to yields was not. Figures cited are as of 4 September 2026 close. Market data moves quickly; verify current levels before trading. This article is general information, not personal financial advice.

ezekiel chew asiaforexmentor

About Ezekiel Chew

Ezekiel Chew, founder and head of training at Asia Forex Mentor, is a renowned forex expert, frequently invited to speak at major industry events. Known for his deep market insights, Ezekiel is one of the top traders committed to supporting the trading community. Making six figures per trade, he also trains traders working in banks, fund management, and prop trading firms.

RELATED ARTICLES

Join the Live Event
Get Your Free Ticket Now

I consent to receiving emails and/or text message reminders for this event.

REGISTER FOR THE MASTERCLASS!