

Bitcoin is doing something it has rarely done during a hawkish repricing of the Federal Reserve: holding its ground.
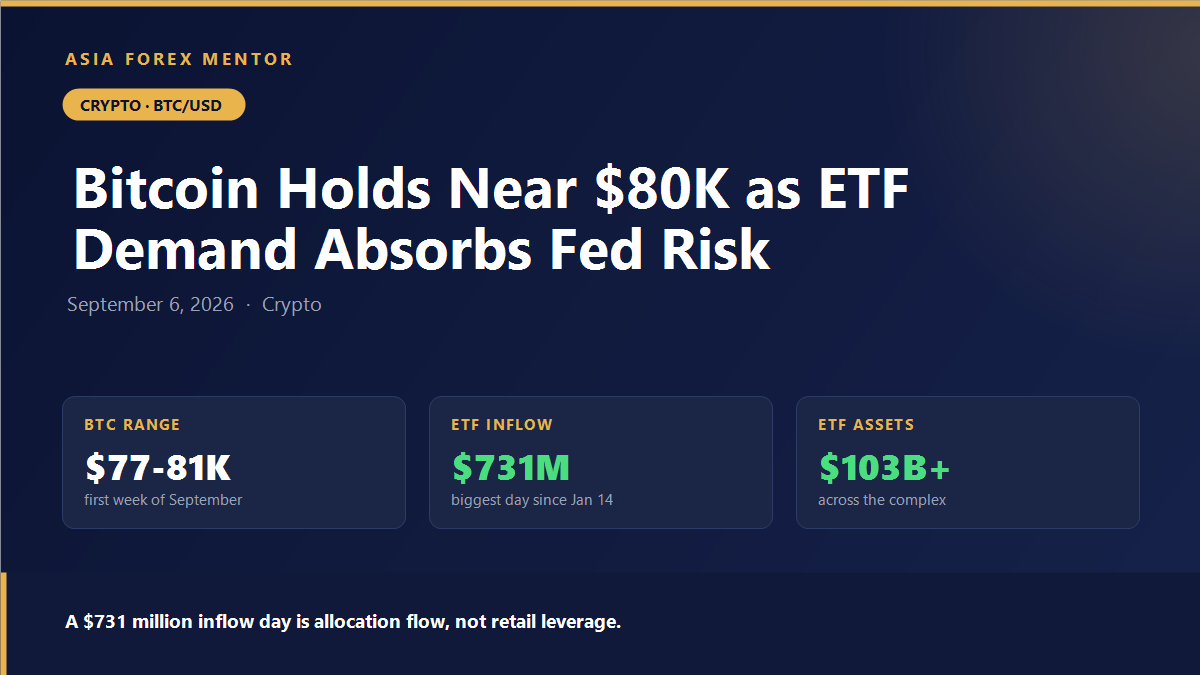
BTC has traded in a roughly $77,000 to $81,000 band through the first week of September, opening at $78,559 on 1 September, dipping to $77,396 the following day, and recovering to around $81,000 by the middle of the week. That is a 5% range in a market where the odds of a US rate hike have jumped to roughly 58% and the two-year Treasury yield has hit its highest level since January 2025.
Historically, that combination has been enough to knock double digits off Bitcoin. This time it has not — and the reason appears to be sitting in the ETF flow data.
August Was the Strongest ETF Month of 2026
US-listed spot Bitcoin ETFs took in $3.52 billion in net inflows during August, their best month of the year, while Bitcoin itself rose about 25%. Total net assets across the complex jumped roughly 31%, from $76.29 billion at the end of July to $99.61 billion at the end of August.
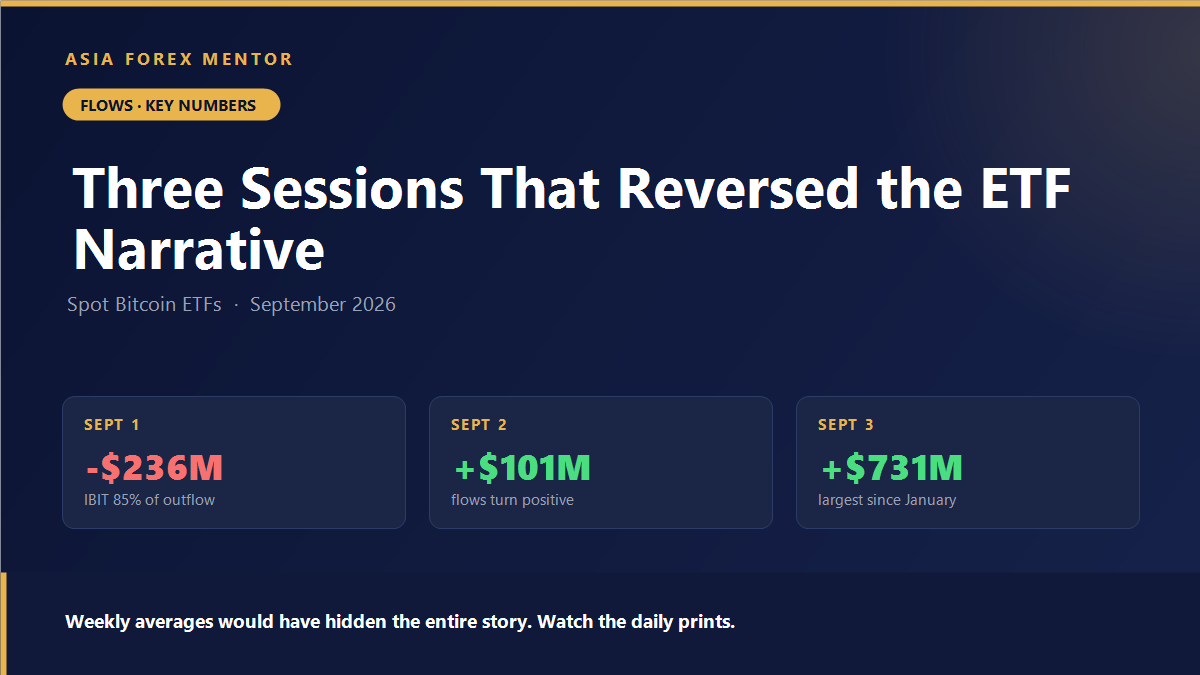
September opened with a warning shot. On 1 September the funds saw a net outflow of $236.46 million, with BlackRock’s iShares Bitcoin Trust (IBIT) accounting for roughly 85% of it. Plenty of commentators called it the start of a reversal.
It was not. The next session flipped to a net inflow of $101.15 million, and on 3 September the funds pulled in $731 million — the largest single-day total since 14 January 2026. Combined Bitcoin ETF assets now sit above $103 billion.
Why the Flow Data Matters More Than the Price
For most of Bitcoin’s history, the marginal buyer was a retail trader with leverage. That buyer disappears the moment funding costs rise, which is why Bitcoin used to trade like the highest-beta risk asset on the board whenever the Fed turned hawkish.
The ETF complex changes the composition of that marginal buyer. A $731 million inflow day is not retail leverage; it is allocation flow, and allocation flow responds to mandates and rebalancing schedules rather than to overnight funding rates. That does not make Bitcoin immune to a rate hike. It does mean there is now a bid underneath it that behaves differently from the one that existed in previous cycles.
The honest caveat: one strong week is not a structural change. The 1 September outflow showed the same plumbing runs in reverse, and IBIT’s dominance means a single issuer’s flows can swing the aggregate figure. Traders should read these numbers as a shift in market structure, not as a floor.
The Rest of the Market Is Weaker
Bitcoin’s resilience has not extended evenly across the market. In early September, Ethereum fell 2.1% to around $2,451 and XRP slid 3.3% to roughly $1.40, while Bitcoin dropped a comparatively mild 1.5% to $79,536.
The ETF flows tell a similar story of divergence. Solana ETFs have led 2026 growth at 33%, and XRP ETFs have grown 28% to $1.51 billion — but on a much smaller base. XRP’s ETF recorded its first zero-inflow day of the month in early September, and Solana logged its second outflow.
This is what a maturing market looks like. Capital is differentiating between assets rather than moving as a single block, and Bitcoin is capturing the institutional share of it.
The Catalysts That Actually Matter This Month
Two dates dominate the rest of September:
15 September — the CLARITY Act cloture vote. The Senate votes on whether to advance the crypto market structure bill. Outcome is genuinely uncertain, and the market has not fully priced either result.
16 September — the FOMC decision. A hike would be the first real test of whether ETF flows can absorb a hawkish surprise.
There is also a regulatory development worth noting: on 5 September the SEC formally recognised Solana alongside Bitcoin and Ether for commodity-based trusts, and approved changes to Nasdaq Texas Rule 5711(d) naming Bitcoin, Ether, Solana and XRP as digital assets meeting the exchange’s commodity-based trust standards. That is procedural rather than dramatic, but it widens the runway for further ETF products.
How Traders Should Read This
Do not confuse resilience with immunity. Bitcoin holding $78,000 through a hawkish repricing is notable. It is not evidence that a 25 basis point hike is priced in — the FOMC is still a coin flip, and coin flips resolve.
Watch flows daily, not weekly. The swing from -$236 million to +$731 million inside three sessions shows how quickly the picture changes. A weekly average would have hidden the entire story.
Resistance is stacked overhead. Analysts point to a $82,000–$86,000 band as the next meaningful supply zone. Forecasts for the month cluster around an $83,000 average with a $79,980 to $86,395 range — useful as a sentiment gauge, not as a trading signal.
Altcoin weakness is information. When Bitcoin holds and ETH, XRP and SOL fall, capital is consolidating rather than rotating. That is typically a defensive tell, not a bullish one.
If you are choosing where to hold or trade these assets, our crypto broker reviews cover fees, custody and regional availability in detail.
The Bottom Line
Bitcoin is entering the most consequential two weeks of its quarter with a legislative vote and a central bank decision one day apart, and it is doing so with a structurally different buyer base than it had in previous cycles. Whether that buyer base holds under genuine pressure is the question September will answer.
Figures cited are as of 5 September 2026. Cryptocurrency markets are highly volatile; verify current levels before trading. This article is general information, not personal financial advice.