English
 简体中文
简体中文 繁體中文
繁體中文 日本語
日本語 한국어
한국어 Bahasa Melayu
 Bahasa Indonesia
 Filipino
 ไทย
ไทย Tiếng Việt
 हिन्दी
 العربية
 Italiano
 Português
 Русский
 Español
 Français
 Singapore
 Cambodia
 Myanmar
 Brunei
 Australia
  New Zealand
 Switzerland
 UAE
UAE United States
 Mexico
 Argentina
 South Africa
 IC Markets
 Pepperstone
 AvaTrade
 XM
XM Plus500
 RoboForex
 TMGM
TMGM Exness
 JustMarkets
 Orbex
Orbex Interactive Brokers
 Saxo
Saxo Tiger Brokers
 Binance
 Coinbase
 Gemini Exchange
 Kraken
 iFunds
 IC Funded
 The 5%ers
 TopStep
 IQ Option
 Pocket Option
 RaceOption
 IQCent
The liquidity sweep strategy is one of the most-taught setups for prop trading challenges. It also blows out more challenge accounts than almost any other setup. The strategy is not the problem. The version that gets taught everywhere is.
| About This Guide |
|---|
| This guide covers the liquidity sweep strategy tested by AFM Research Lab across 2,452 trades on 28 currency pairs. It explains why the textbook version drains a $10,000 account down to $242, and the three-filter version that came back with a real edge across 1,388 filtered trades. Every rule is mechanical. Every filter is specific. |
| Quick Answer |
|---|
| The liquidity sweep strategy works when three filters align. The sweep has to move with the higher-timeframe structure, not against it. The level has to have a real stop cluster behind it, cleared into an imbalance without a retest. And the entry has to fire inside the London or New York kill zone. Miss one filter and the trade does not qualify. |
🎥 Watch the full method explained on video:
Key Takeaways
The following points frame the strategy before each section covers it in detail:
- The textbook liquidity sweep produced a 33 percent win rate and a negative 0.14R expectancy across 2,452 trades in AFM Research Lab testing.
- The sweep is not the entry signal. It is a filter. Once treated that way, the setup changes completely.
- Structure filter: the sweep has to run with the higher-timeframe trend. Sweeps against the trend are traps.
- Level filter: the sweep clears a real stop cluster and accelerates into an imbalance without a retest.
- Timing filter: entries only fire inside the London kill zone (7 to 9 GMT) or the New York kill zone (1 to 3 PM GMT).
- Risk management: 1 percent per trade, 1.5R fixed target, stop beyond the sweep wick tip plus a 2 ATR buffer.
The Only Strategy Worth Running In A Challenge
If a trader had to pass a prop trading firm challenge today, using a fresh account in one shot, this is the exact strategy to use. It is not an exciting one. It is a boring strategy. After over two decades of testing markets, the boring ones are the only ones that actually survive.
And you have probably already seen it. The liquidity sweep. The stop hunt . The liquidity grab. Whatever you call it, every prop firm trader watches for it because it is the setup that fits well inside a challenge.
The problem was never the sweep. It was the version that was taught.
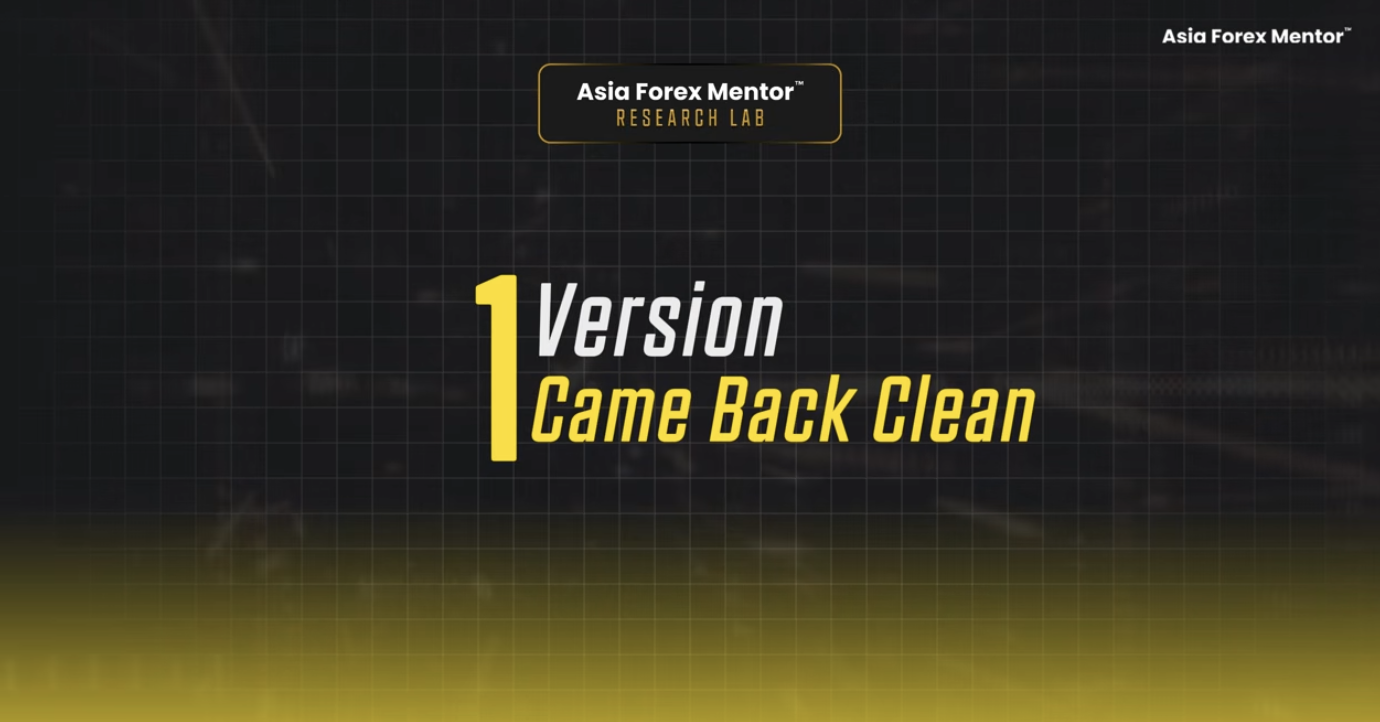
AFM Research Lab tested 2,452 trades over 28 pairs. The textbook version took a $10,000 account down to $242. This is not a rough month. This is almost the entire account gone.
But one filtered version came back clean. On data it had never seen. Run four separate times. It holds up. These are tested results. This is the version to use to pass prop trading challenges. It has three filters.
Past performance in backtest results does not guarantee future returns.
How Liquidity Sweeps Are Normally Traded
Here is how liquidity sweeps are normally traded. This is also why the standard version quietly drains any trading challenge account.
Take a look at this chart. Price spikes down into a known low, stalls, then turns and runs clean to the upside. That very move is what every prop firm trader is watching for.
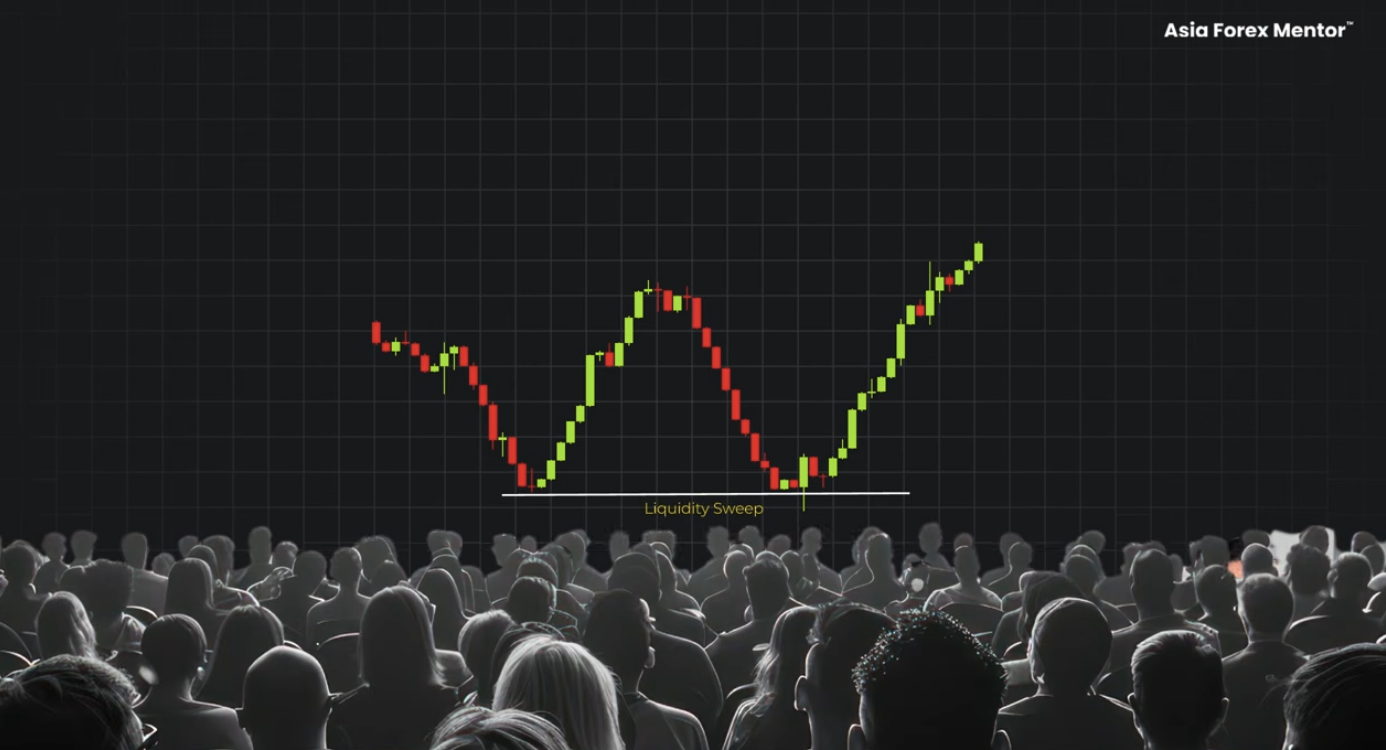
The logic makes sense. A known low has retail stops clustered just underneath it. Price drives through, triggers all the stops, and reverses. The stop hunt creates the liquidity that drives the move.
On paper it looks perfect. Small stop. One candle to decide. Done before the session is over.
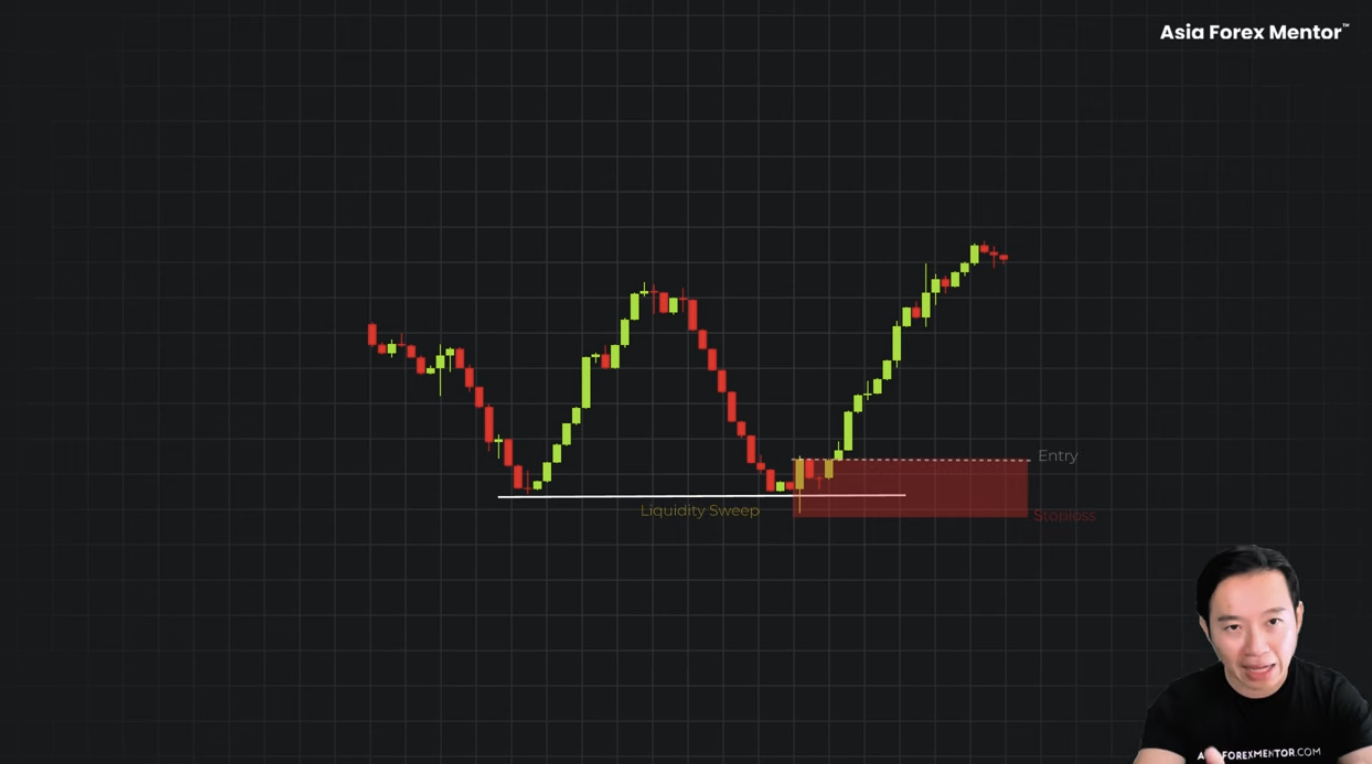
But when AFM Research Lab ran that logic across 2,452 textbook setups, it only produced a 33 percent win rate and a negative 0.14R expectancy. The R is the risk on the trade itself. A negative 0.14R means every time a trade was taken, on average, a piece of what was risked went back to the market, and more.
The sweep fires all the time. There is no edge behind it. Here is why.
Go back to the sweep from earlier. Price took that low and never looked back.
Now watch this one. The same wick went through a prior low and closed back inside. Price stalls for one candle. Then it continues lower.
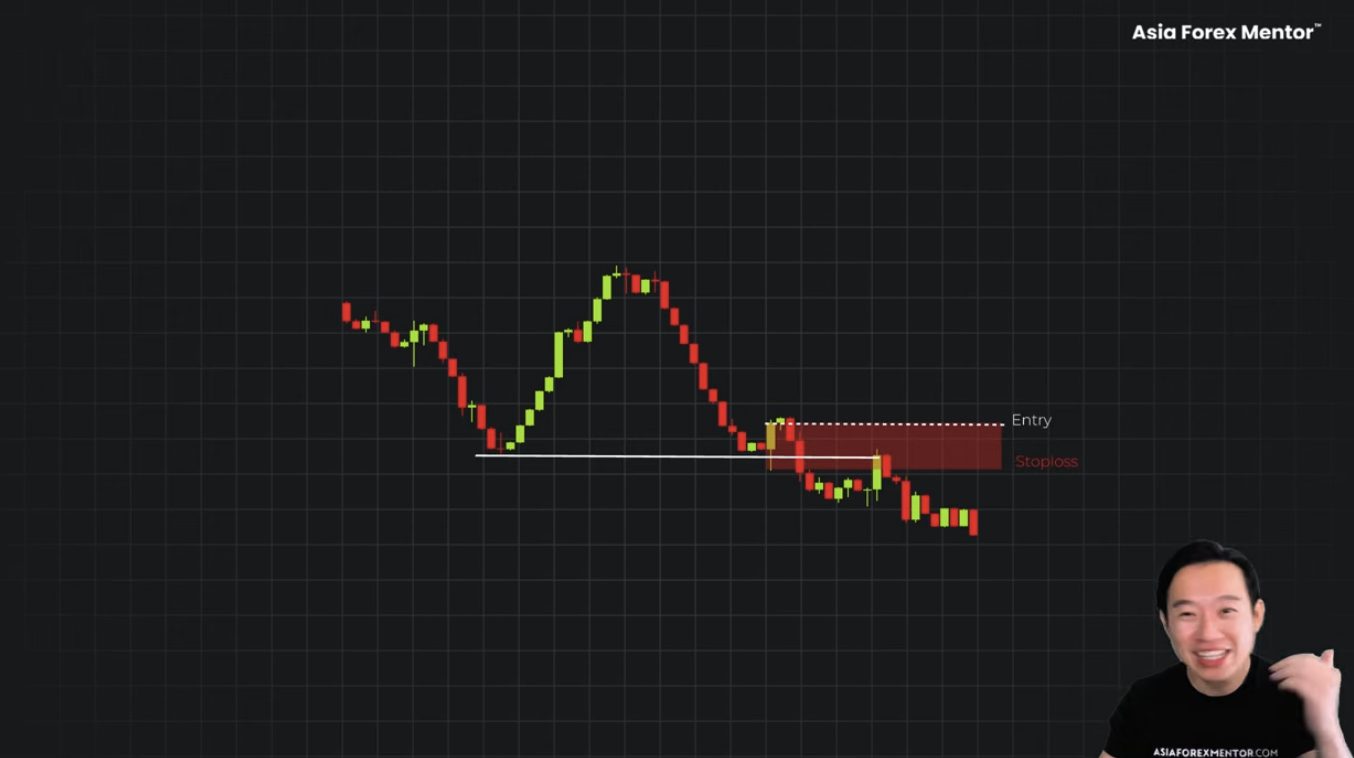
At the entry point, the earlier trade and this trade are identical. The rule fires on both. That is the mistake in version one. No filter at all. Just a wick.
The Second Version — The Key Zone Breakout
Traders reach for the second version. This is what they have been taught. The key zone breakout. Trade the break of a key level and the retest.
In a trend, it is clean. But watch the other scenario. Price breaks. The retest fires. Then price collapses back through it. Now the trader has entered a long into what has now just become a resistance from a support.
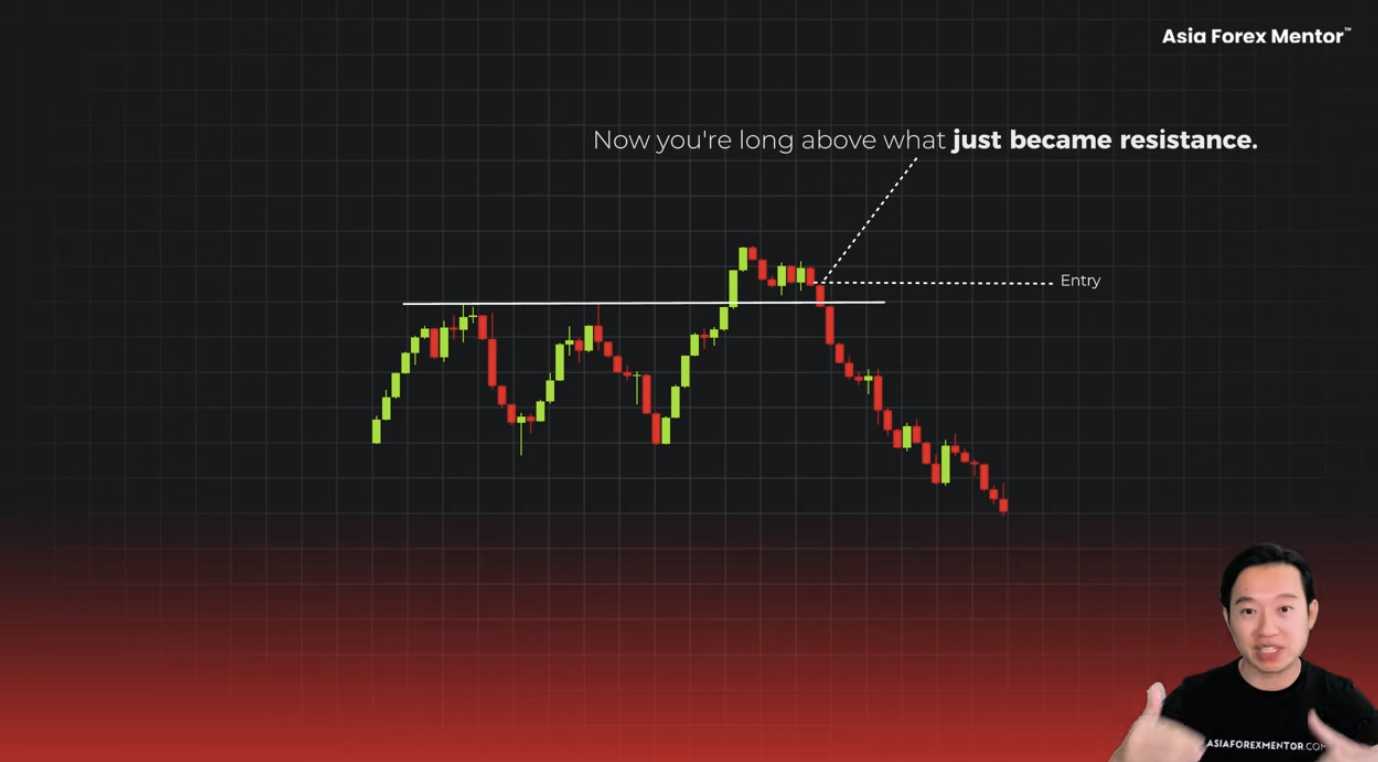
Same entry. Same timing. No context filter.
Without a context filter, in a trend, it holds up. In a range, it snaps back through the entry, past the stop loss, into a full loss.
The Third Version — Tighter Stops
Now comes the third version that tries to fix the risk instead. Tight stop beyond the wick. Fixed 2R or 3R take profit target.
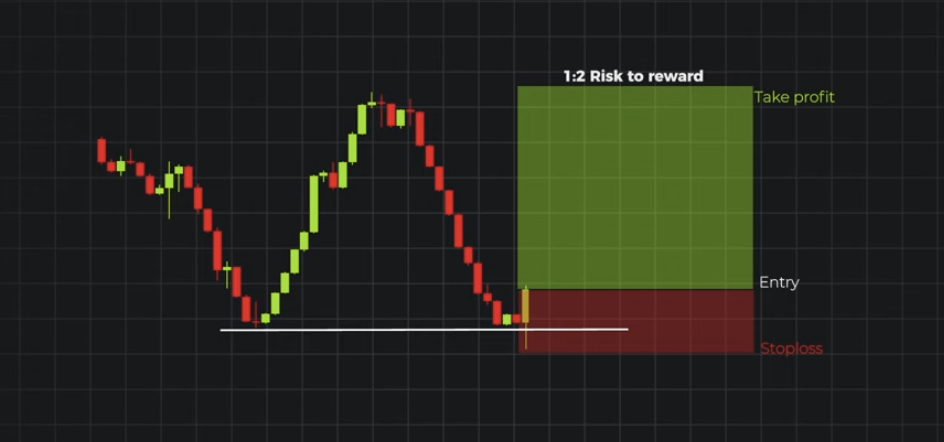
The logic goes that a small loss with a big target does not need a high win rate. Which sounds exactly like what a prop firm challenge would ask for.
But one candle after entry, normal volatility dips through the stop. That is not a new low. That is a full loss. The reversal comes two candles later. The stop was sitting inside the market’s breathing room. Wick size shifts every session, but the stop loss rule does not shift along with it.
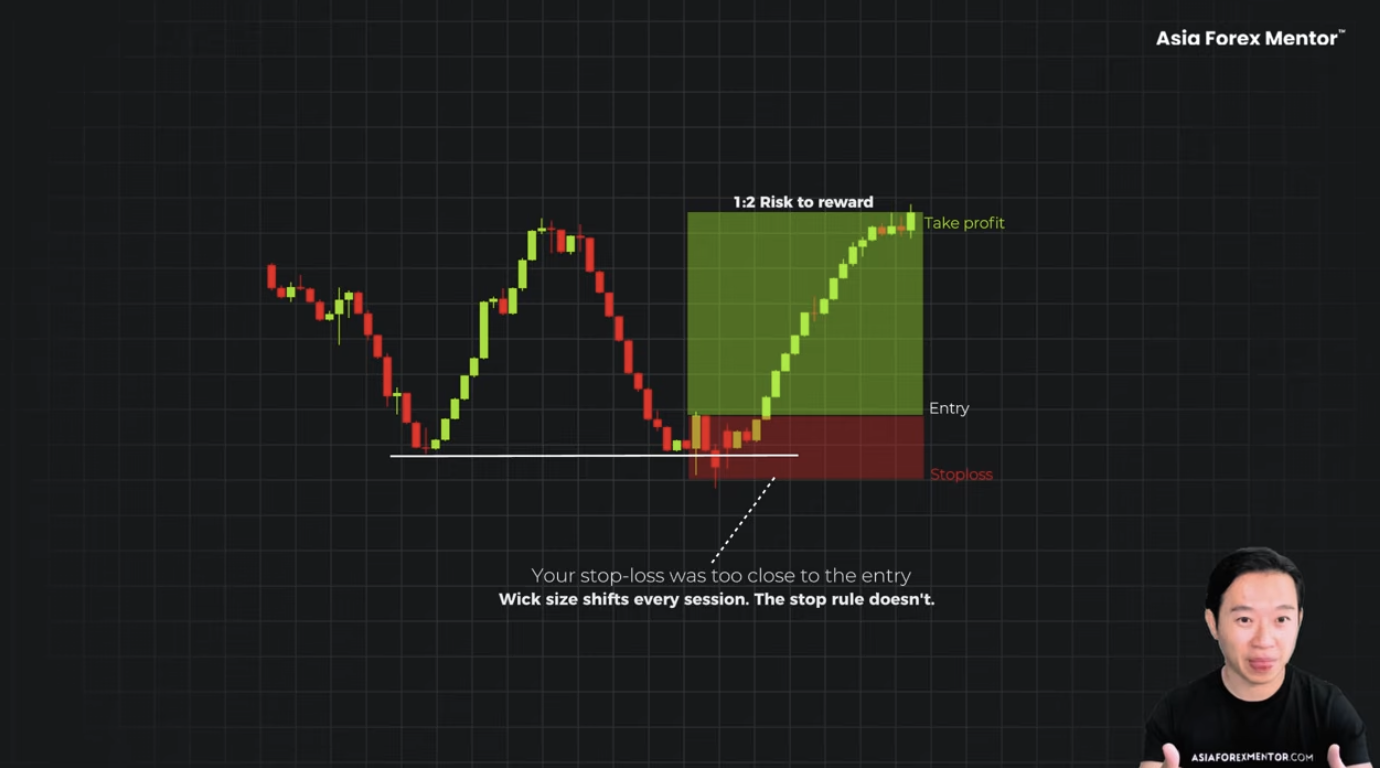
Three versions. Three different entries. Same result. Not one produced a positive expectancy as a standalone signal. That is where a $10,000 account went.
If a trader has been running one of these and watching prop trading challenges die off, this is the part nobody says. It was not about discipline. It was the version being taught. The sweep was never the signal. It is a filter. Once it is treated that way, everything changes.
The Three Filters
Here is what has to be true before a sweep actually means anything. This is what AFM Research Lab found. Three filters.
Filter 1: Structure
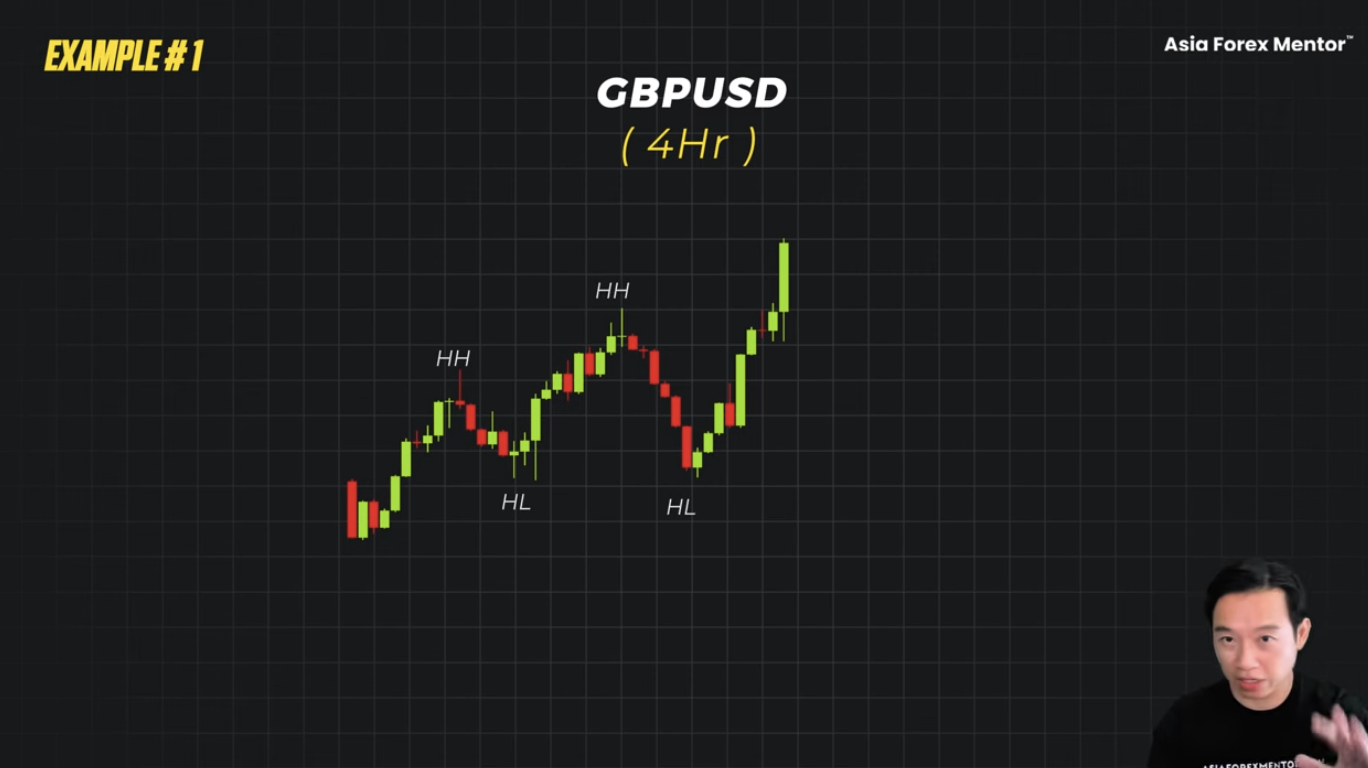
The first check has nothing to do with the sweep at all. It is the direction that price is already moving. Higher highs, higher lows. That is the regime needed.
Look at this chart. Price dips under a prior low, but every swing above it is still stepping up. That sweep is aligned with the trend. A sweep against it is a trap.
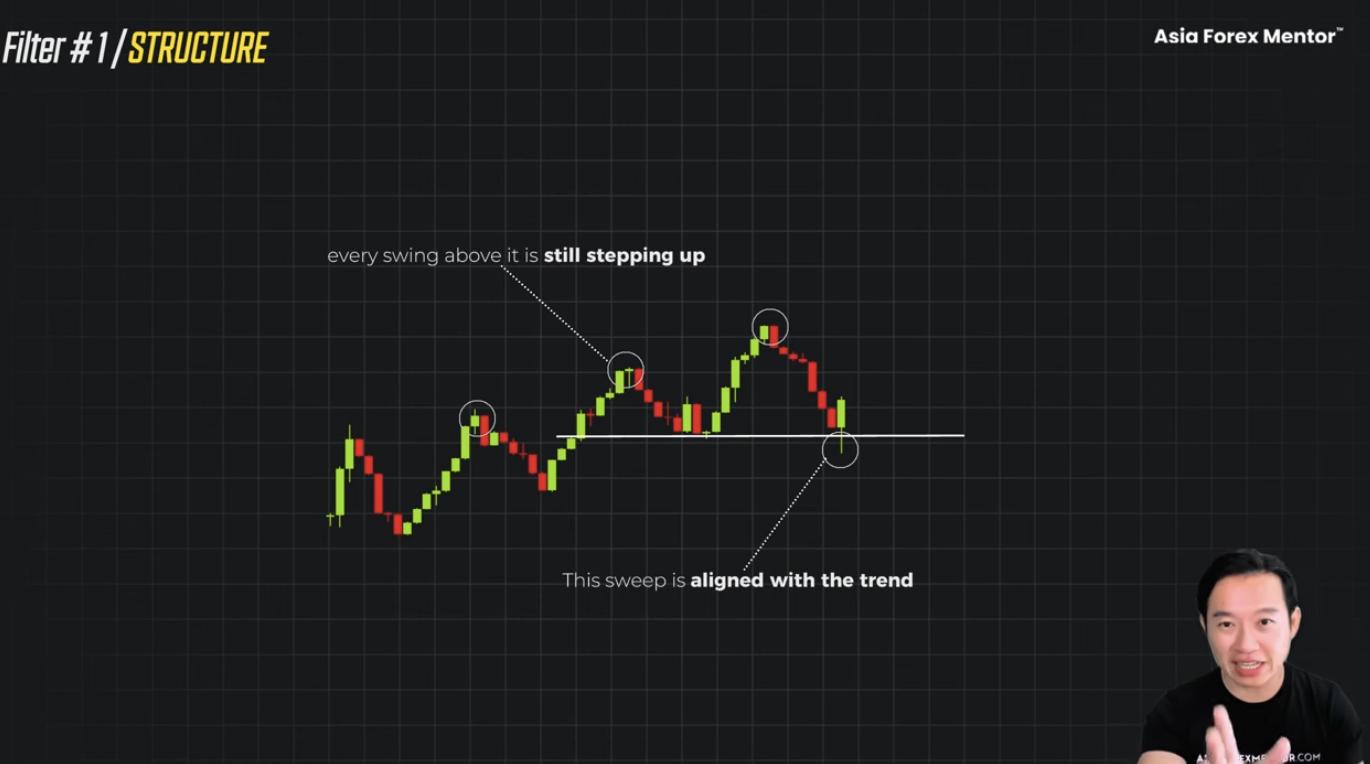
This is the filter that saves prop trading challenges. Trading against-trend sweeps is how a trader hits the daily loss limit before the day ends.
Filter 2: The Level
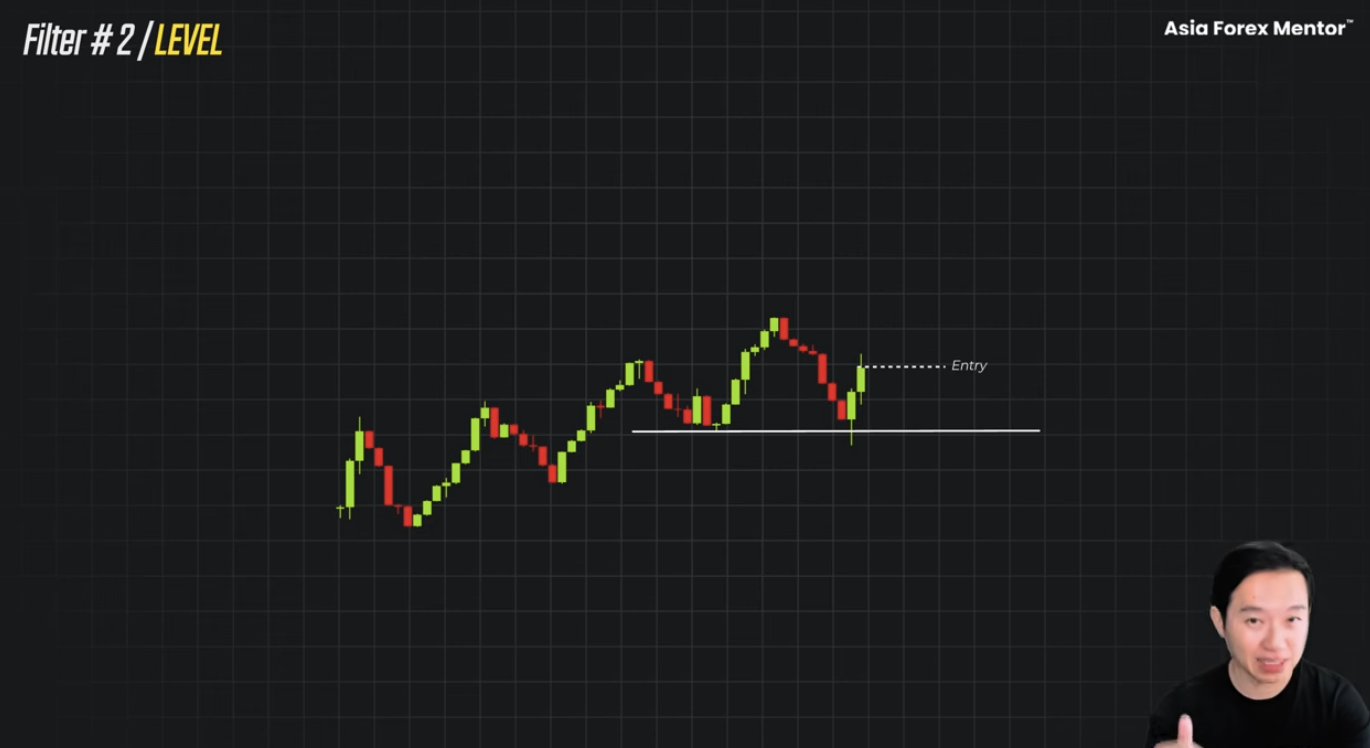
The structure tells you which direction to take the sweep. The level tells you which sweep is worth taking at all.
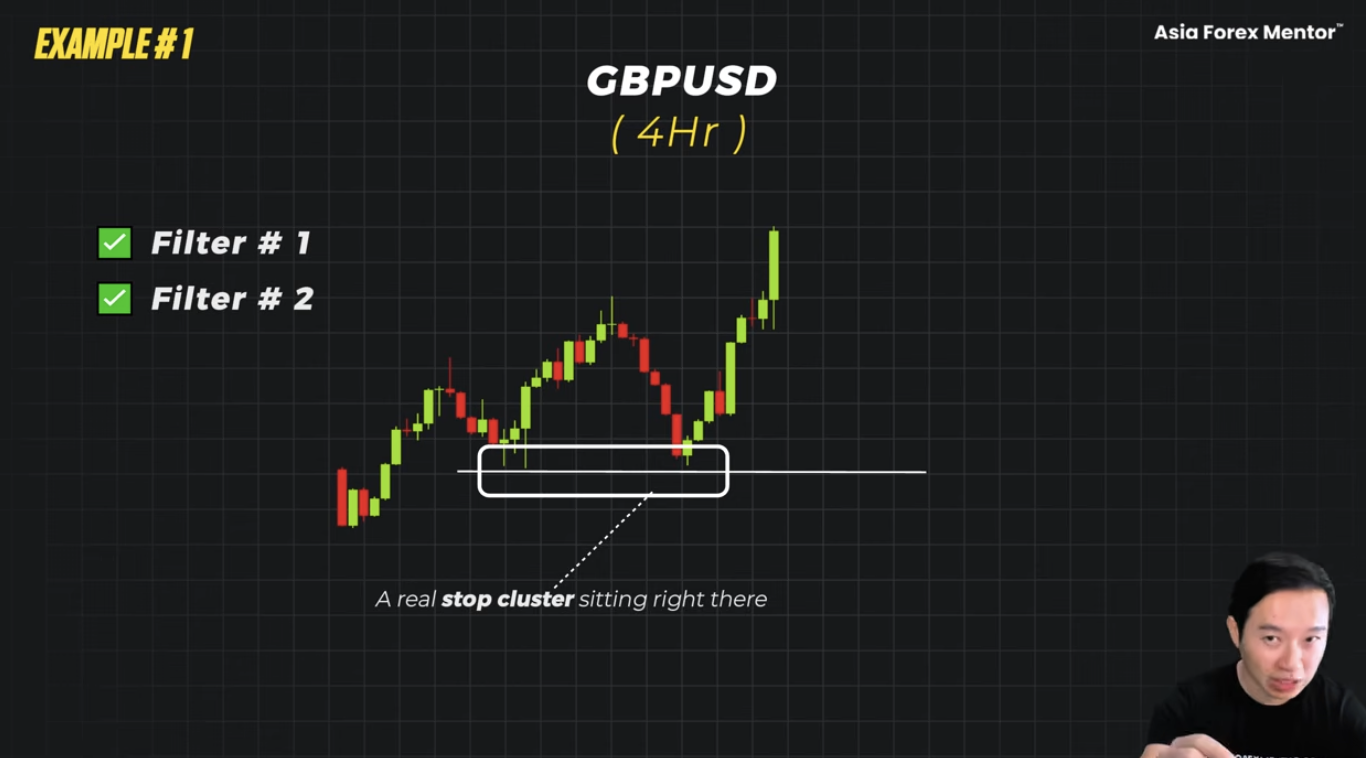
A level without a real stop cluster behind it gives nothing. Nothing gets grabbed underneath it. No power behind the move. This is how challenge fees disappear.
What the filter looks for is this. The sweep clears the stops, and price accelerates clean into an imbalance without a retest. What happened is that smart money took the liquidity to build a position and is now defending it. The entry is after liquidity has been taken. Not fading a random candle.
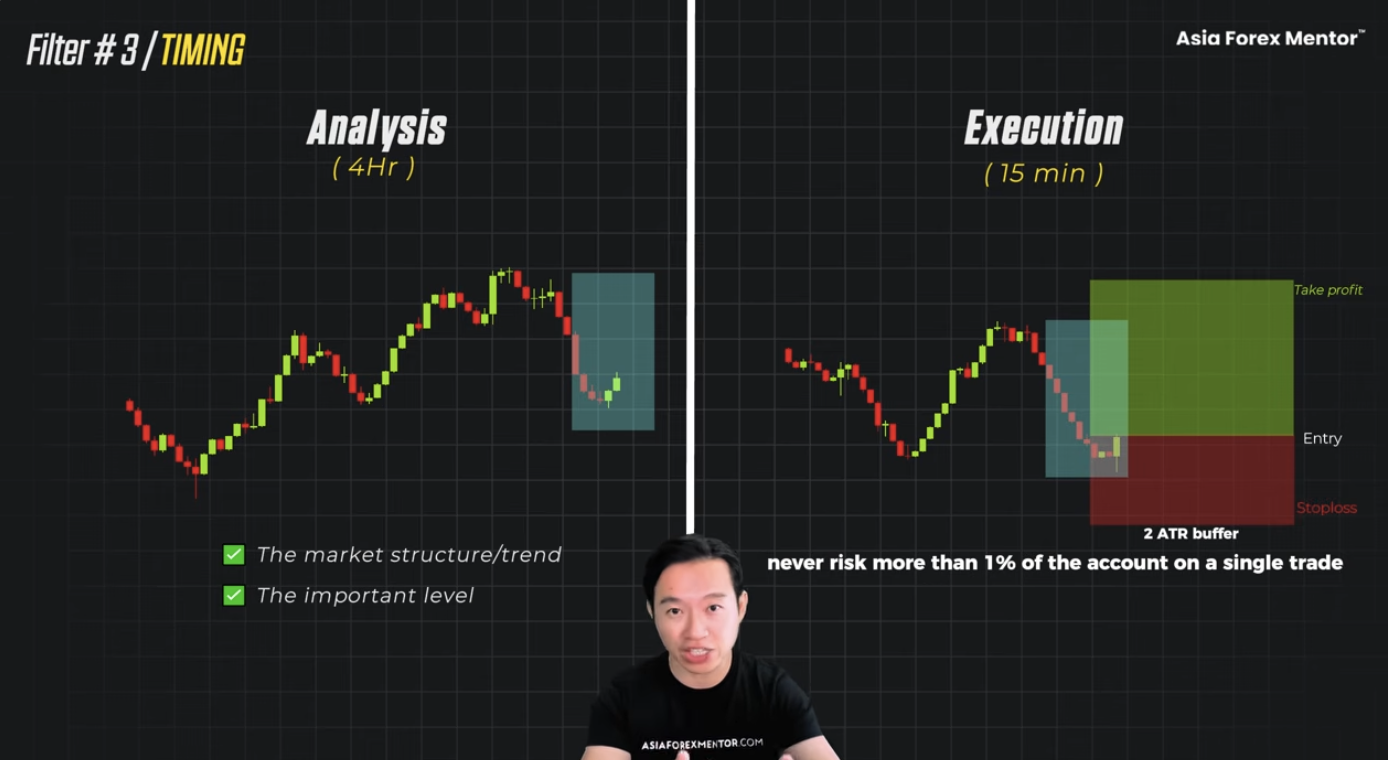
Filter 3: Timing
Structure and level tell you what qualifies. Timing tells you when.
The entry only fires inside the London open from 7 to 9 GMT, or the New York open from 1 to 3 PM GMT.
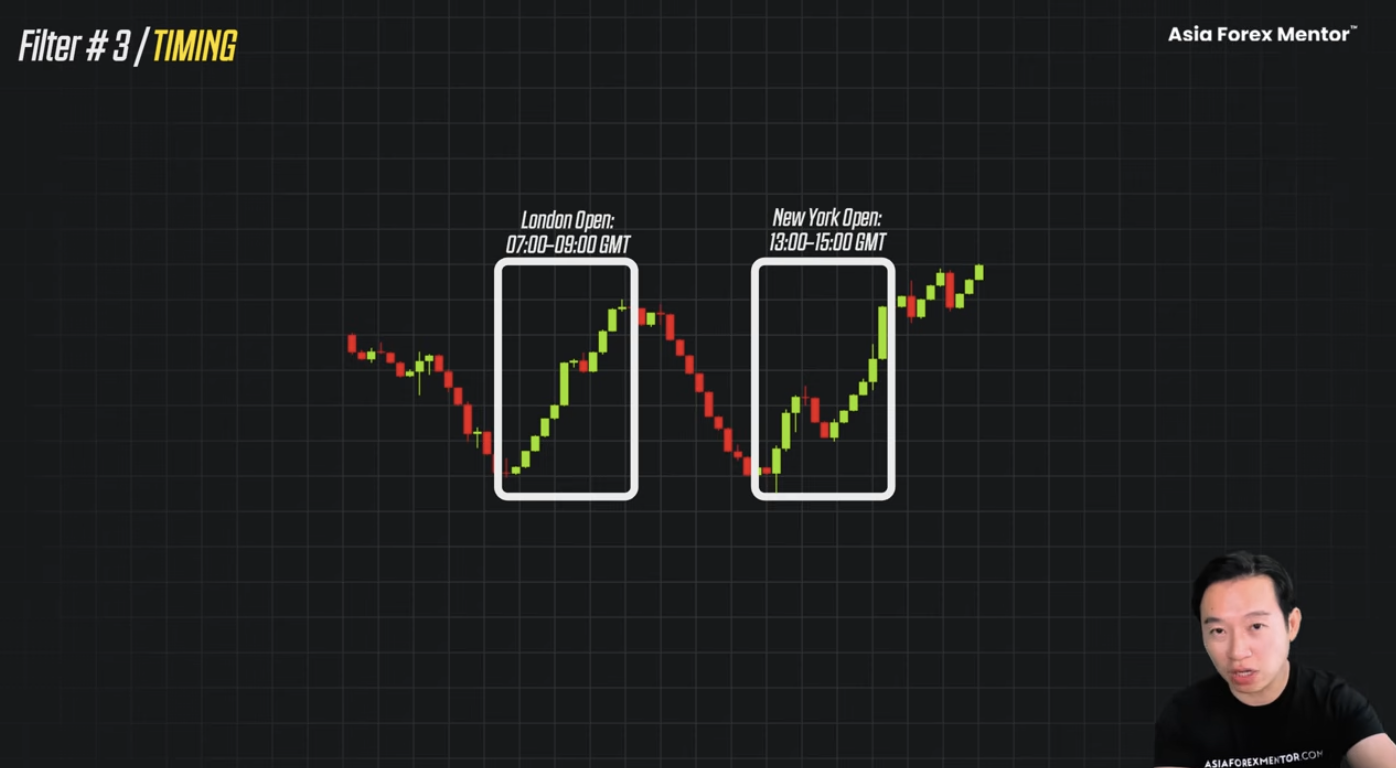
Outside those hours, a sweep is just noise. Noise is noise. It burns trading days. It is a waste of time.
All three have to align. This is where the edge comes from.
The trigger is mechanical.
The sweep candle closes back inside the level with a body close. Not a wick that is poking in. A body close. That is the signal.
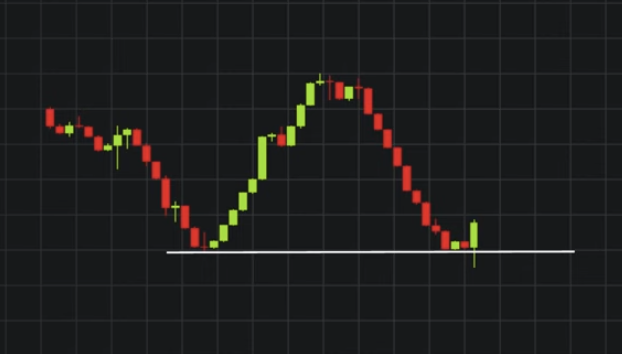
Two entry options:
- Entry one: the next candle open, opposite the sweep.
- Entry two: a limit at the 50 percent to 61.8 percent retracement of that sweep candle.
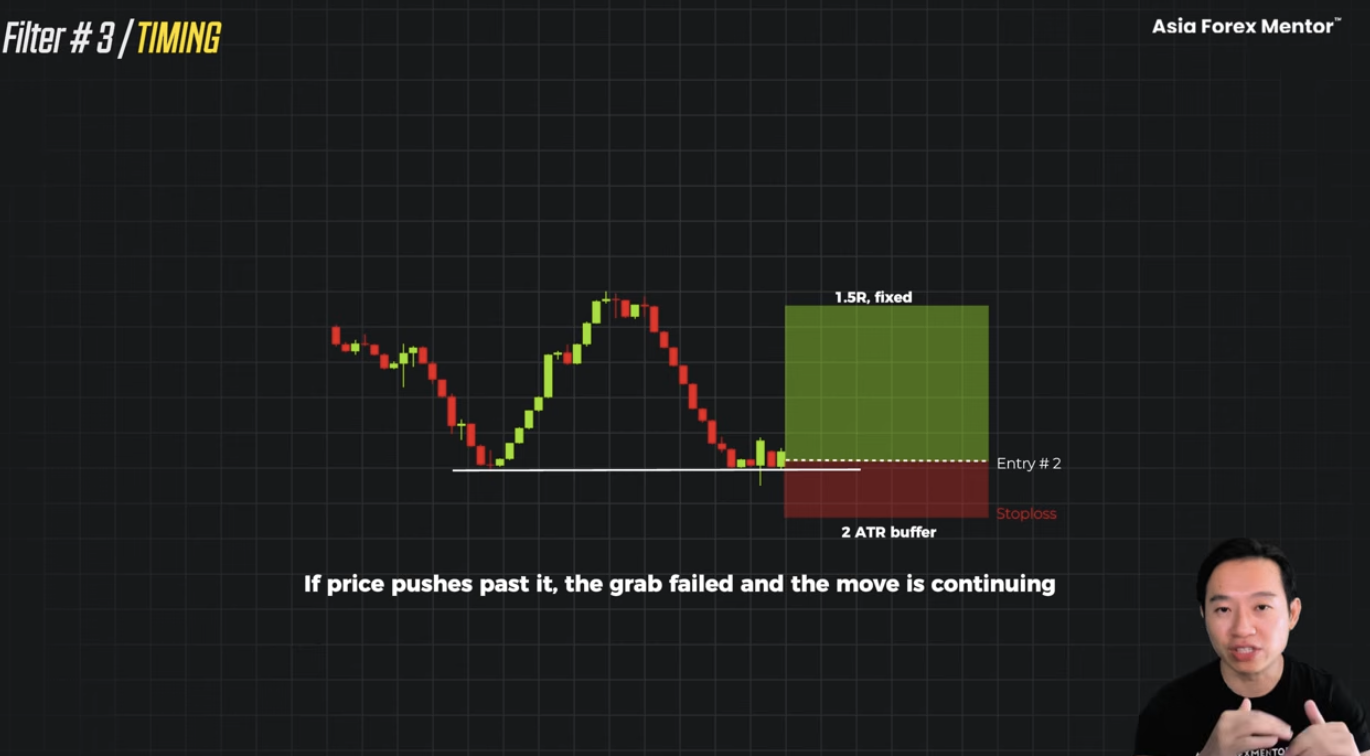
The stop loss goes beyond the tip of the sweep wick, the actual tip, plus a 2 ATR buffer. If price pushes past it, the grab has failed. The move is continuing. Accept it. The take profit target locks at 1:1.5R. Set it and let the trade go.
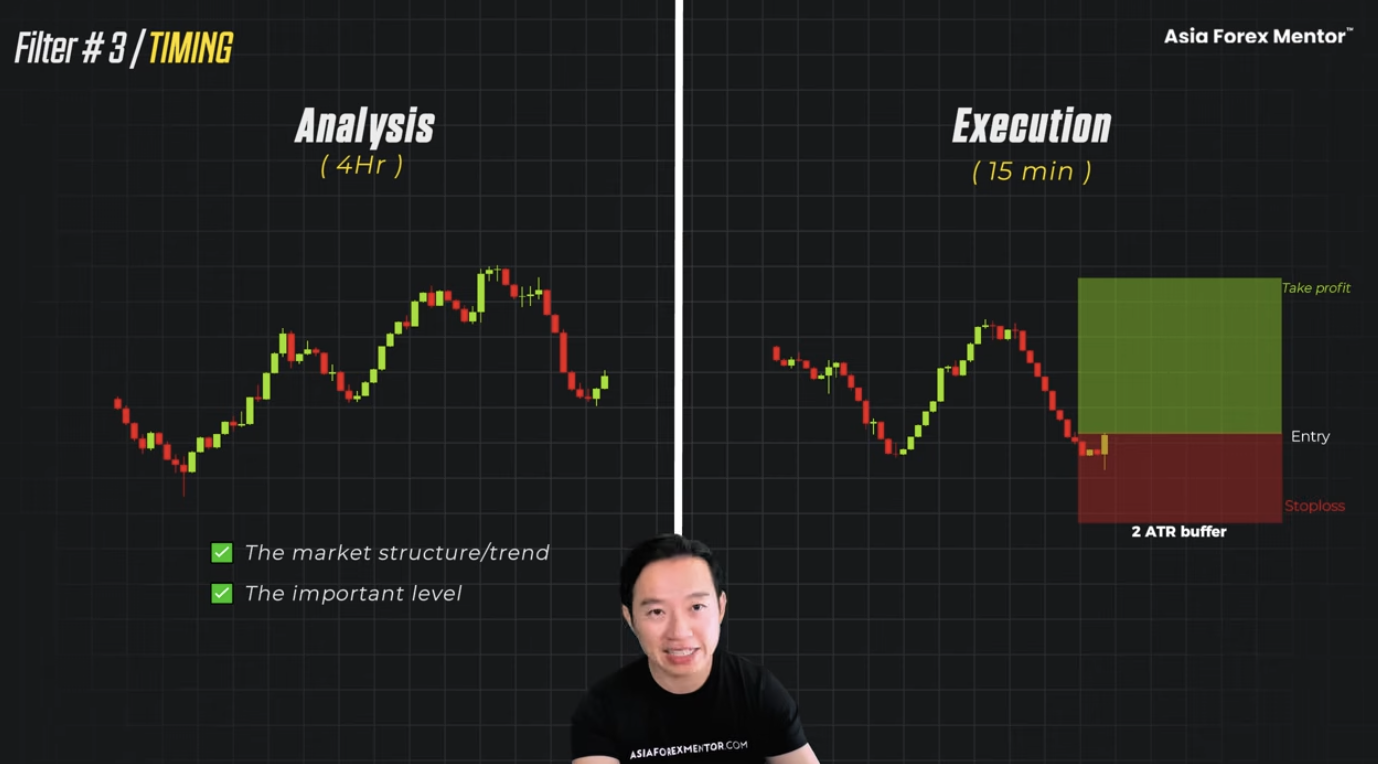
Two timeframes run this. Analysis lives on the 4-hour, where the structure is marked and the level is drawn. Execution drops to the 15-minute inside the key zone.
Risk never goes above 1 percent of the account on a single trade.
This is how a trader survives prop trading challenges. This is what keeps the daily drawdown, which is critical in prop challenges, intact even after a losing session. At 1 percent risk for a 1.5R target, every clean trade walks the account toward the profit target without ever putting the drawdown rule in play.
That is the trade a challenge is actually asking a trader to make. That is how to survive the challenge.
The Method On A Real Chart
Here is the real one. The way it plays out inside a challenge.
The pair is GBPUSD. The timing is the London open.
Start on the 4-hour. The structure is already bullish. Higher highs, higher lows. Filter one, done. Before the session even opens.
Look at this low. Two touches, same reaction. A real stop cluster sitting right there. Filter two, a level with something underneath it.
Now wait for the window. London opens. Price spikes below the equal lows. The stop losses get swept. This is where most traders jump in.
Watch what qualifies instead. The candle closes back above the level. Full body. Not a wick poking in. That is the trigger. It is firing inside the London key zone from 7 to 9 GMT. Filter three, done.
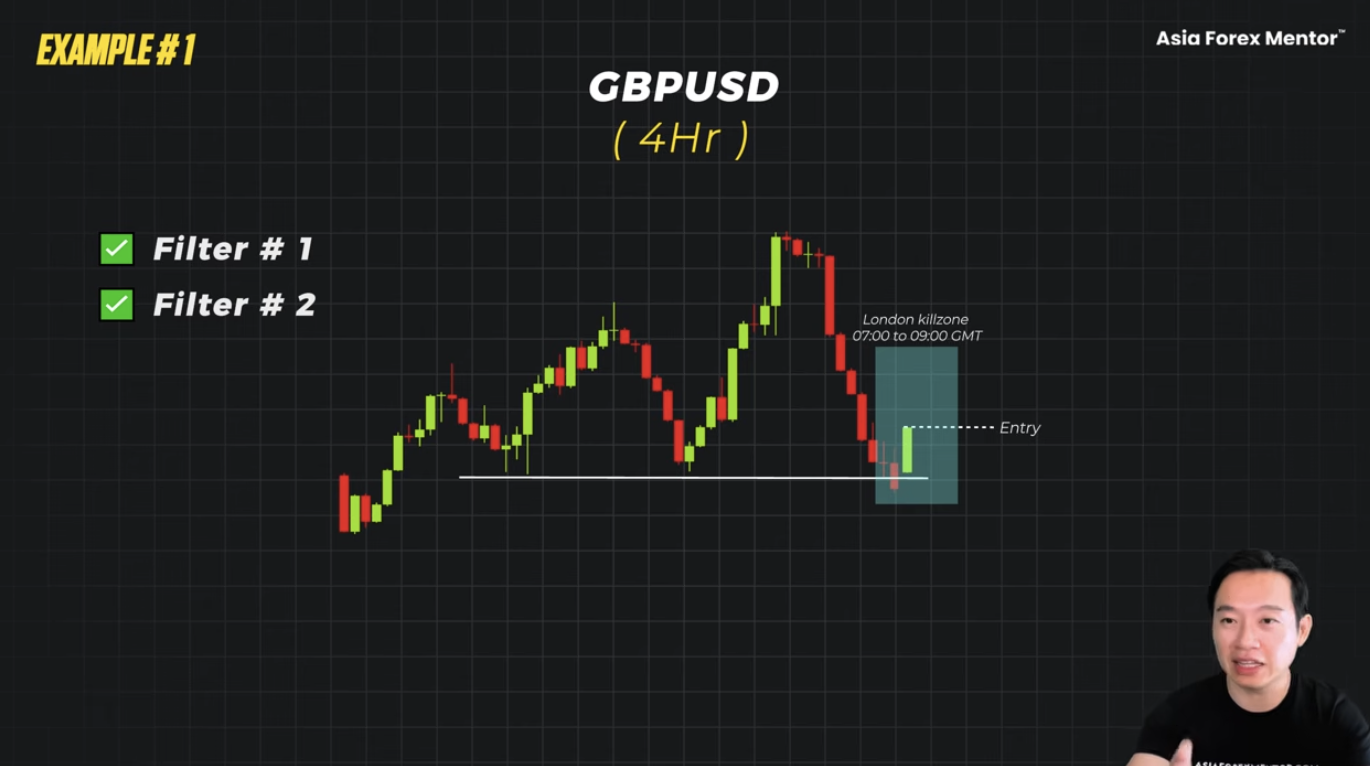
Enter on the next candle open. Stop loss goes beyond the tip of the sweep wick plus a 2 ATR buffer. Take profit target is marked at 1:1.5R before the trade goes live.
Then let it run. There is no second test of the low. No reversal. Price works its way to target and hits it clean. One percent risk. 1.5R return. Drawdown is safe.
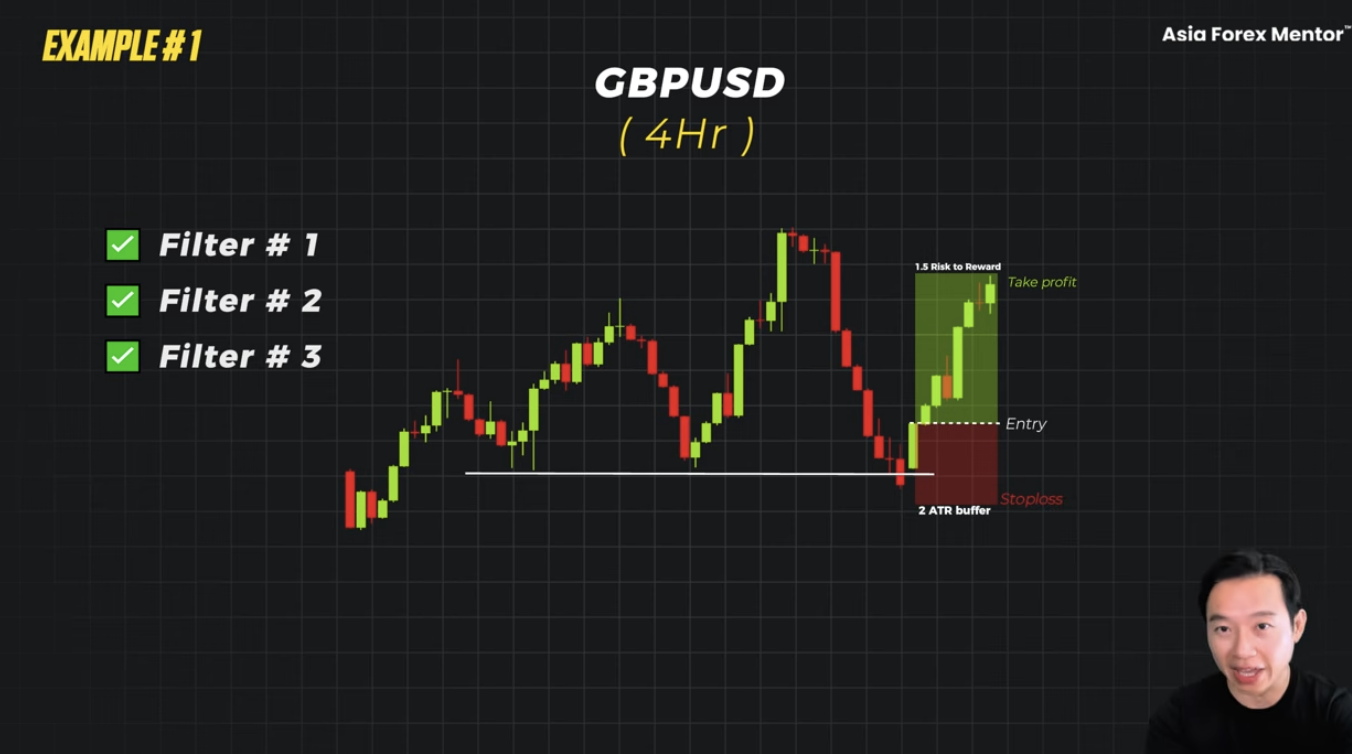
That is the whole setup.
The Trade You Do Not Take
Knowing when to pass a trade is what keeps a prop trading challenge alive.
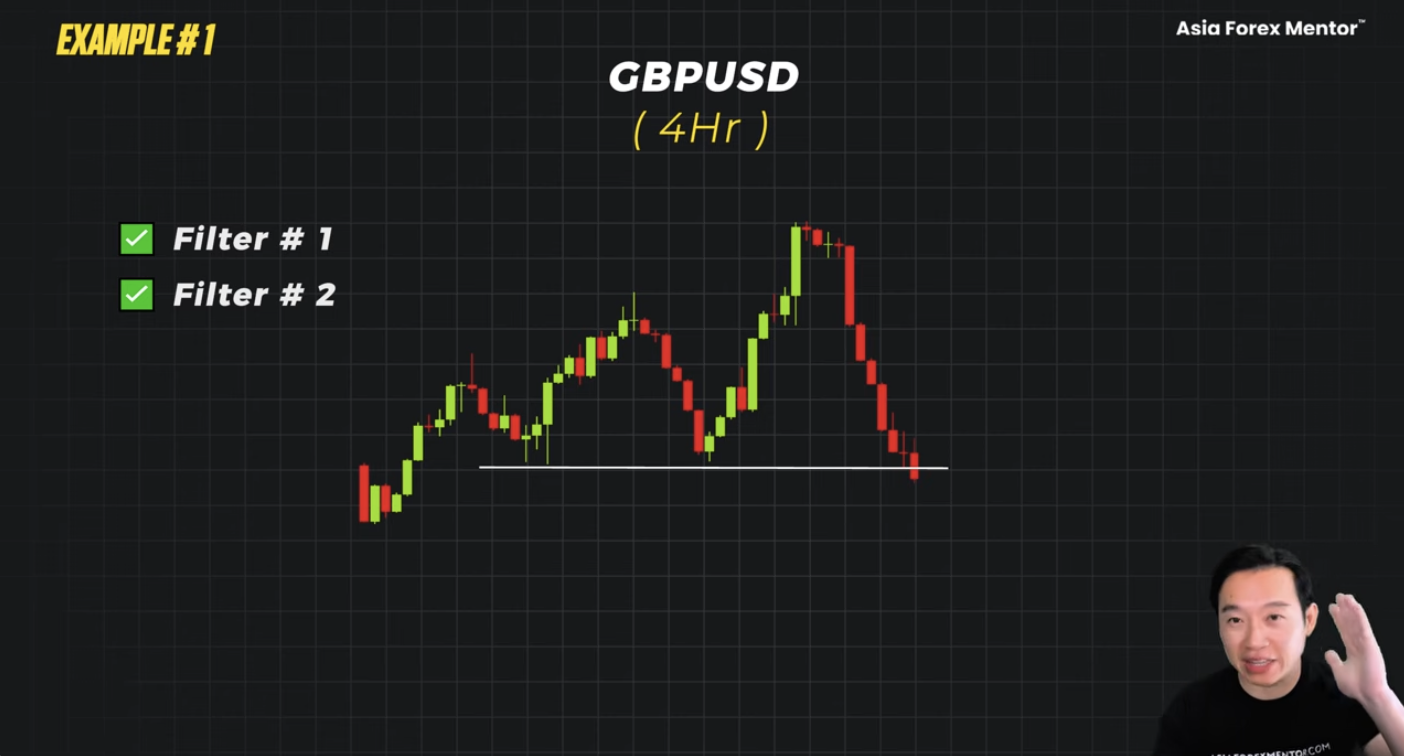
Same pair. GBPUSD. Different session. Price sweeps a low. A clean wick through the level. Stop losses triggered. The candle closes back inside.
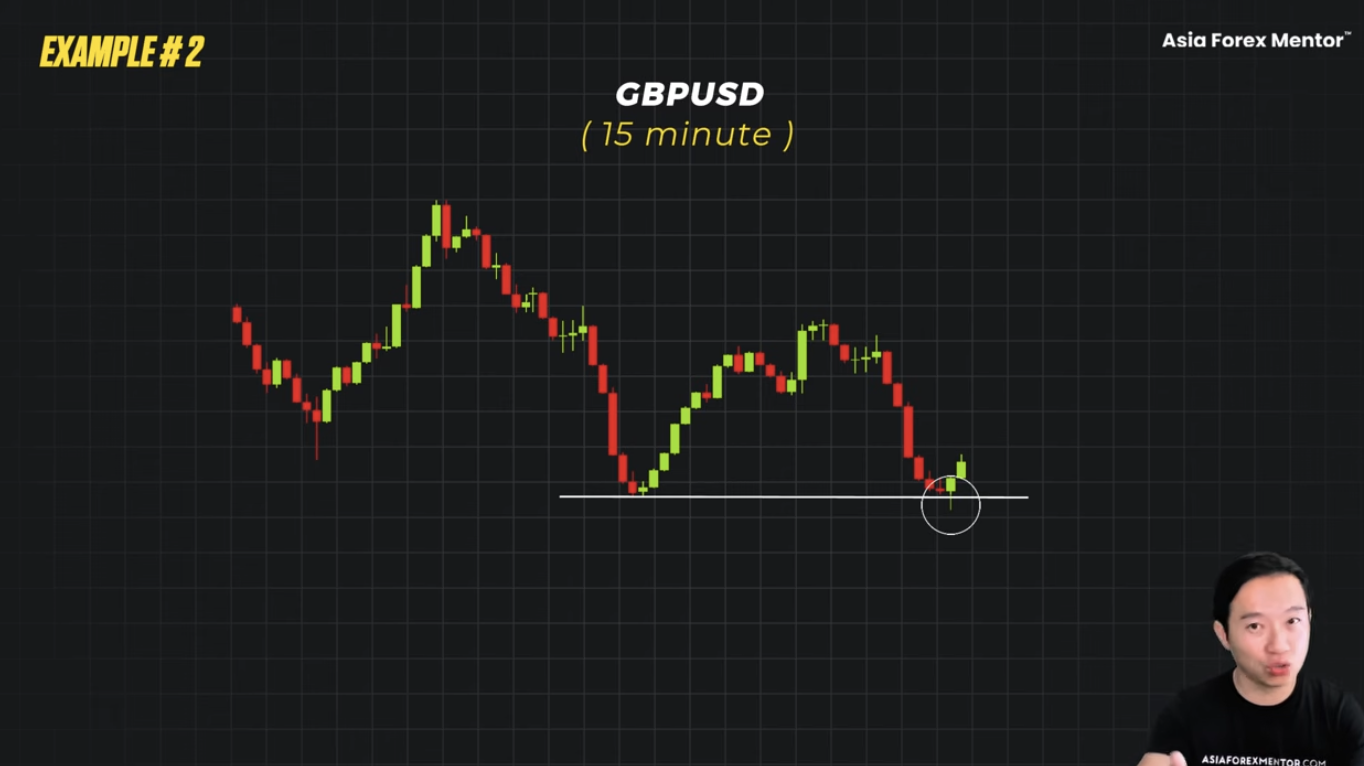
In isolation, this looks identical to the trade above. Running the trigger alone puts a trader in this trade.
But go back to the 4-hour. The structure here is bearish. Lower highs, lower lows. The sweep is not aligned with the trend. It is against the trend. Filter one fails.
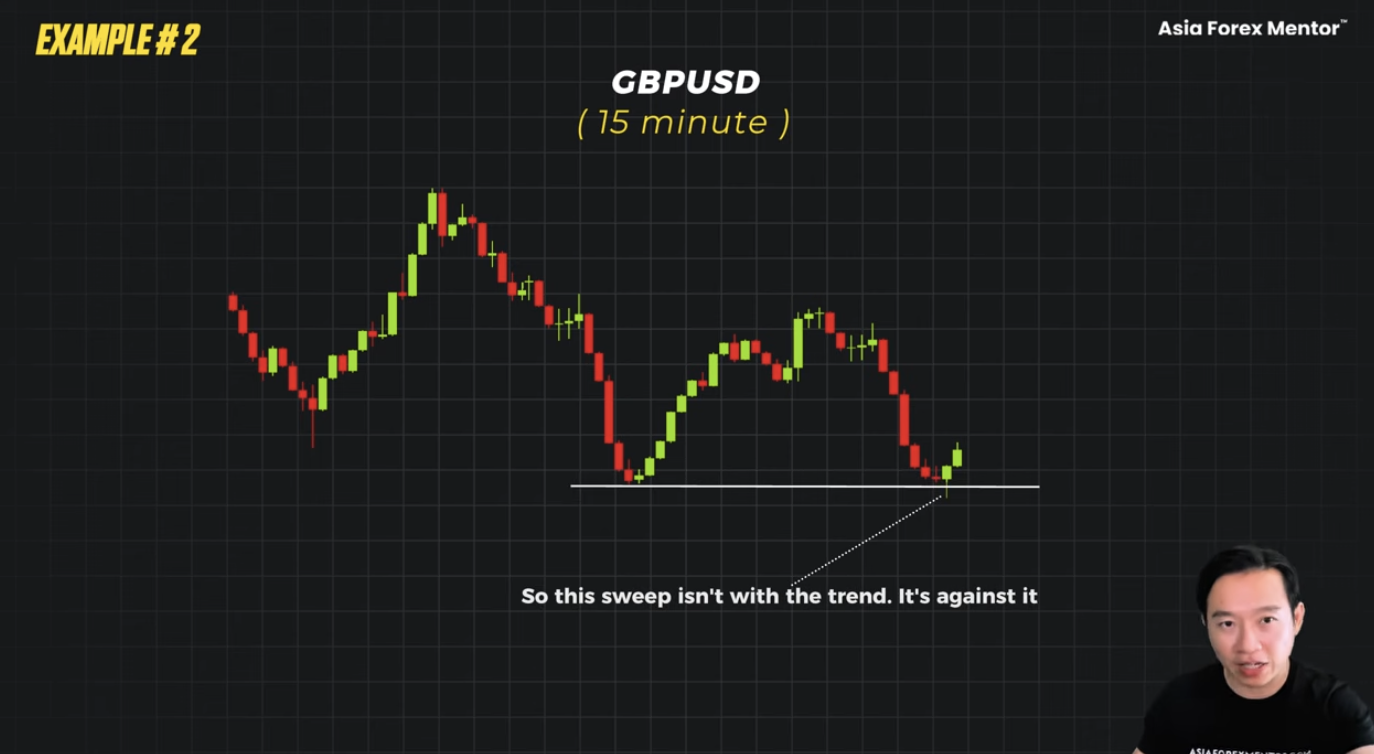
It does not matter what happens next. Even with a perfect body close. Even with a clean retracement entry. The trade still gets passed on. A sweep against the trend is not a reversal signal. It is price pausing on its way forward.
That is the version tested as a standalone signal. That is what happens to accounts that blow out.
When one filter is missing, it is not a trade. No prop trading challenge ever fails because of a trade that was missed. Challenges fail because of trades that were actually taken. Trades that did not have an edge.
Also Read: Forex Trading Strategies That Work: A Complete Guide to Consistent Profits
What It All Comes Down To
Traders do not trade the sweep. Never did. The trade is the confirmation, the moment liquidity has been taken and price is ready to commit.
Three filters: Structure. The sweep runs with the trend, not against it. Level. A real stop cluster underneath. Not a random line. A real level. Timing. Inside the New York or London kill zone. Nothing outside of it.
When all three align, wait for the body close. That is the trigger.
Across 2,452 trades in AFM Research Lab testing, the textbook version took a $10,000 account down to $242. The filtered version held its ground across 1,388 trades. Not flashy numbers. Steady growth. That is what survives a prop trading challenge.
This was the only version with a real edge.
Frequently Asked Questions
What Is A Liquidity Sweep In Forex Trading?
A liquidity sweep is when price runs past a prior high or low, triggering the stop losses of traders positioned on the wrong side of that level. The move creates the liquidity that larger participants need to open positions. Traders watch for the sweep because it often marks a turning point, but the sweep itself is not a reversal signal. It only qualifies as a valid trade setup when the sweep aligns with the higher-timeframe trend, clears a level with a real stop cluster underneath, and fires inside the London or New York kill zone.
Why Does The Liquidity Sweep Strategy Keep Losing Money?
The textbook liquidity sweep strategy loses money because the sweep is treated as the entry signal on its own. AFM Research Lab tested this version across 2,452 trades on 28 currency pairs and produced a 33 percent win rate with a negative 0.14R expectancy. A $10,000 account dropped to $242. The sweep fires whether price is about to reverse or just pausing on its way through. Without the three filters that make up the strategy, every sweep looks the same at the entry point, but the outcomes are completely different.
Does The Liquidity Sweep Strategy Work For Prop Firm Challenges?
The liquidity sweep strategy works for prop firm challenges only when the three-filter version is applied. AFM Research Lab testing showed that the textbook version drained the sample account in test conditions similar to a challenge. The filtered version, built around structure alignment, a real level with stops behind it, and a kill zone entry, held its ground across 1,388 trades. At 1 percent risk per trade for a 1.5R target, every clean trade walks the account toward the profit target without triggering the daily drawdown rule. That is the trade a challenge is actually asking a trader to make.
Where Do You Put A Stop Loss On A Liquidity Sweep Trade?
The stop loss goes beyond the tip of the sweep wick, the actual tip, plus a 2 ATR buffer. If price pushes past that, the grab has failed and the move is continuing. Placing the stop too tight, right below the wick, gets a trader taken out by normal market breathing before the reversal has time to develop. AFM Research Lab testing showed that a tight stop without the ATR buffer was one of the specific failures behind the textbook version’s negative expectancy across 2,452 trades. The buffer sits beyond noise. The trade only closes when it is genuinely wrong.
What Timeframe Is Best For Trading Liquidity Sweeps?
Two timeframes run the setup together. The 4-hour chart is where the higher-timeframe structure is confirmed and the level is drawn. The 15-minute chart is where the execution happens, dropped inside the key zone once all three filters have aligned. Anything below the 15-minute is noise. Lower timeframes produce more sweep signals but a lower percentage of winners, which is what drains challenge accounts. The 4-hour and 15-minute combination is what came back with a real edge in AFM Research Lab testing.