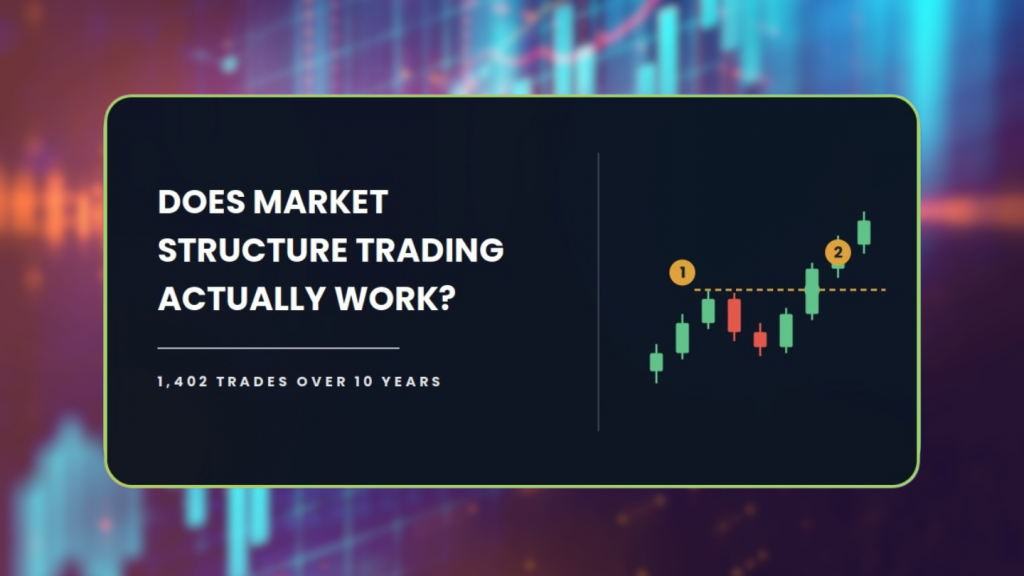
Market structure trading is the first thing most traders are taught, and the last thing most of them question.
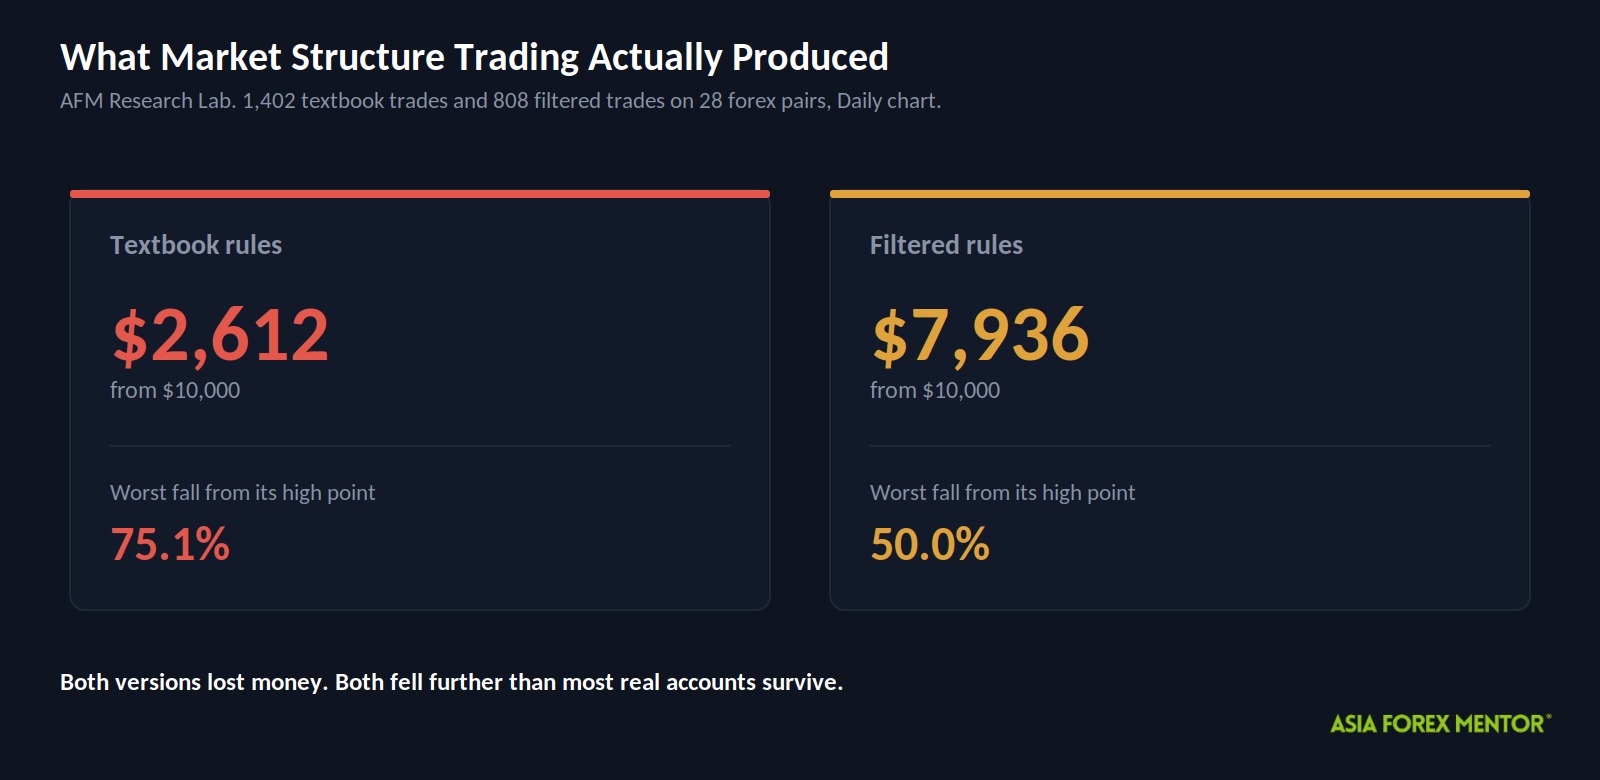
So we questioned it. 1,402 trades, 28 forex pairs, ten years of Daily data, and a $10,000 account that finished at $2,612. Then we tuned it. The best settings a search could find still lost money, and this guide shows you exactly where they broke.
| About This Guide |
|---|
| This guide explains what market structure is, how traders mark swing highs and swing lows, and the exact entry, stop and target rules we put through the AFM Research Lab. It then shows what happened when those rules were tested on 28 forex pairs across ten years of Daily data, including the losses, the drawdowns and the periods where the strategy stopped working. You will finish knowing how to read structure on a chart, what the tested results actually say, and what would have to change before the setup is worth real money. |
| Quick Answer |
|---|
| Market structure trading means reading the pattern of highs and lows to find a trend, then trading the direction of the newest break. In the AFM Research Lab, the textbook rules turned $10,000 into $2,612 across 28 pairs on the Daily chart. A tuned version lost less and still lost. Treat structure as context for reading a chart, not as a system. |
What Happened When We Tested Market Structure Trading
Two accounts, both starting at $10,000. One traded the rules you will find in most tutorials. The other traded settings the AFM Research Lab selected after testing eleven combinations.
Both finished below where they started.
| Version | Start | End | Max drawdown |
|---|---|---|---|
| Textbook | $10,000 | $2,612 | 75.1% |
| Filtered | $10,000 | $7,936 | 50.0% |
That last column needs explaining before the rest makes sense.
Drawdown is how far an account falls from its highest point. Think of a hike. Drawdown is not how far above the car park you are, it is how far you have walked back down from the summit. Max drawdown is the worst of those descents in the whole test.
A 75 percent drawdown means that at one stage, three quarters of the account’s peak value was gone. The textbook account bottomed out at roughly $2,467.
The test ran from October 11, 2016 to September 23, 2026, and charged trading costs at 0.05 percent of the entry price per round trip. Results are internal to the AFM Research Lab and the dataset is not published.
These are backtest results. Backtesting is not live trading, and past results do not guarantee future performance.
Key Takeaways
- The textbook rules lost 74 percent of the account over ten years, finishing at $2,612.
- The tuned rules lost less, ending at $7,936, but still fell 50 percent from their high point along the way.
- Those settings were chosen by testing eleven combinations against the same ten years used to score them, which flatters the result.
- One of the four time periods made money. The other three lost.
- Results split hard by pair, from a positive 0.39R on CHFJPY to a negative 0.45R on EURNZD, so no single setting worked everywhere.
What Is Market Structure Trading And How Does It Work?
Market structure trading means reading the pattern of highs and lows on a chart to work out which way price is trending, then trading in the direction of the latest break.
Start with the two building blocks.
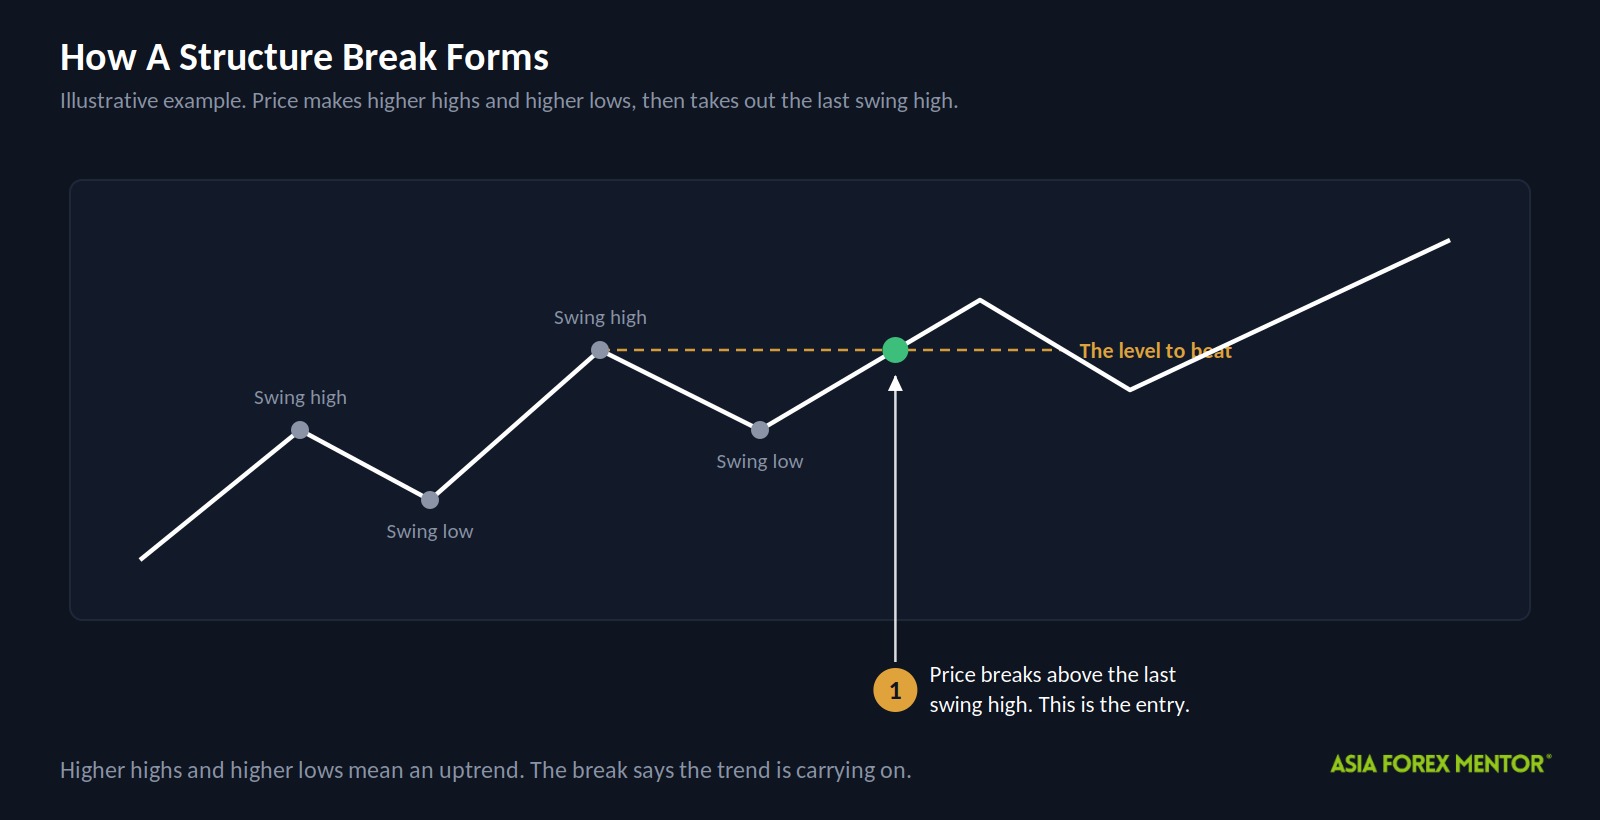
A swing high is a candle with lower highs on both sides of it. A swing low is a candle with higher lows on both sides. Each candle on the Daily chart is one day of trading, and we call each one a bar.
String those points together and you get a trend. Higher highs and higher lows mean an uptrend. Lower highs and lower lows mean a downtrend.
A structure break happens when price pushes past the last swing high in an uptrend, or the last swing low in a downtrend. Traders read it as the trend announcing itself again, and that break is the trade.
The appeal is obvious. No indicators, no settings to argue about, just the shape of price on the screen. That simplicity is also why it is the first thing most traders are taught.
How Do Most Traders Trade Market Structure?
They mark the swings, wait for a break, and let a stop and a fixed target handle the rest.
Two terms you need first.
ATR means Average True Range. It is how much a pair usually moves in a day, so a stop set in ATR adjusts itself to each pair instead of using the same number of pips everywhere.
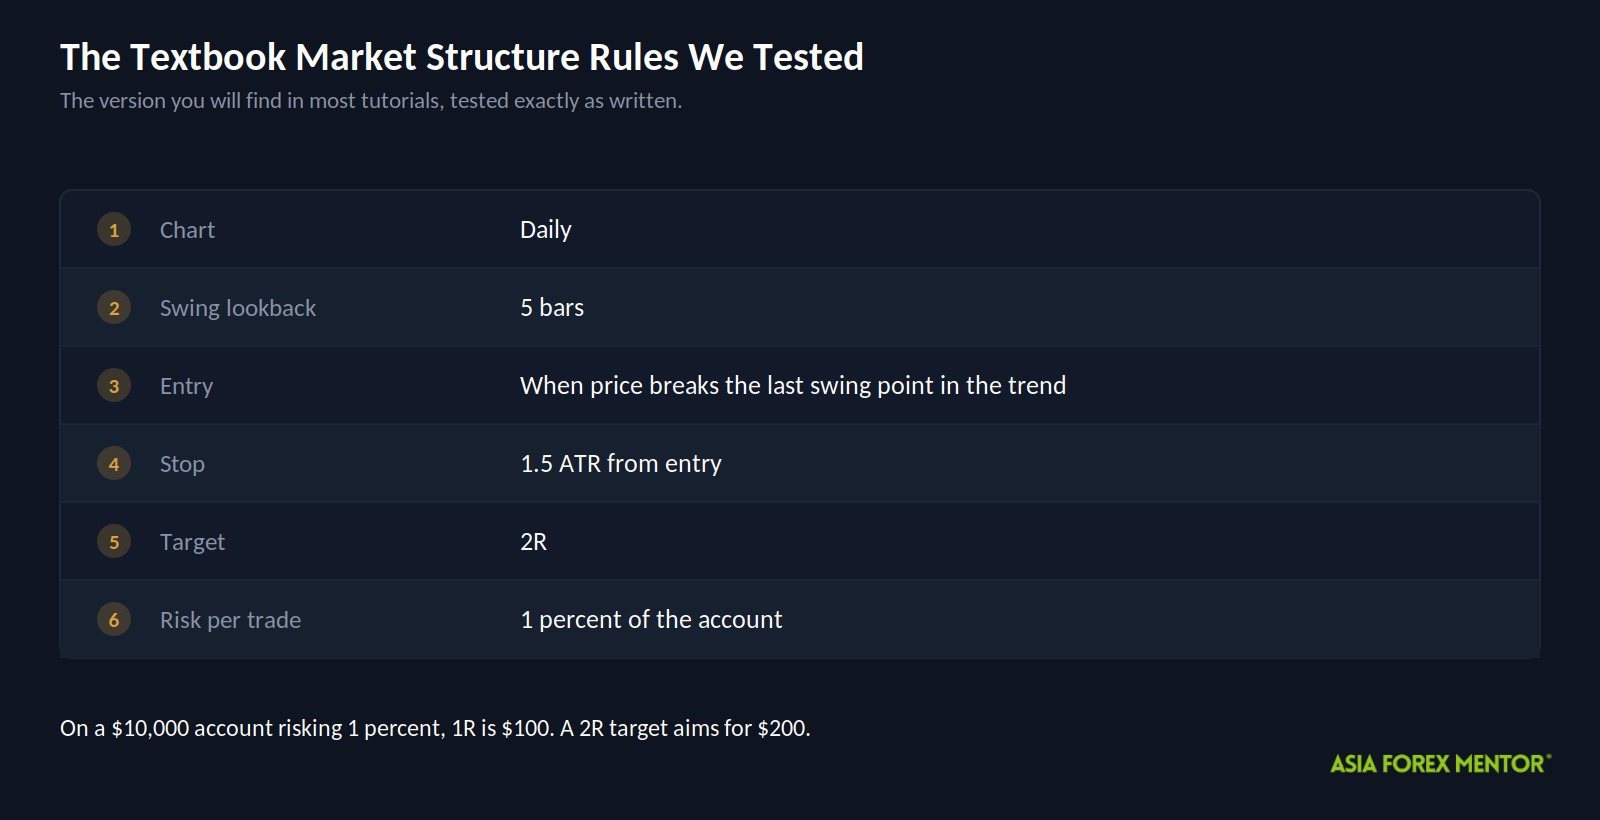
R is what you risk on one trade, measured from entry to stop. On a $10,000 account risking 1 percent, 1R is $100. A 2R target aims for $200.
Here are the rules exactly as we tested them.
- Mark swing highs and swing lows using a 5 bar lookback.
- Wait for price to break the most recent swing point in the direction of the trend.
- Enter on that break.
- Place the stop 1.5 ATR from entry.
- Set the target at 2R.
- Risk 1 percent of the account on every trade.
Does The Textbook Version Make Money?
No. Over 1,402 trades and ten years, it lost nearly three quarters of the account.
| Metric | Textbook |
|---|---|
| Trades | 1,402 |
| Win rate | 37% |
| Expectancy | -0.09R |
| Profit factor | 0.85 |
| CAGR | -12.3% |
| Max drawdown | 75.1% |
| Ending balance from $10,000 | $2,612 |
Three of those need defining.
Expectancy is what the average trade earns or loses, measured in R. At negative 0.09R, every trade gave back roughly a tenth of what it risked.
Profit factor is total winnings divided by total losses. Above 1 means the strategy made money. At 0.85, the losses were comfortably larger.
CAGR is the yearly rate the account grew or shrank. Negative 12.3 percent a year, compounding, is what turns $10,000 into $2,612.
A 37 percent win rate is not the problem on its own. Plenty of good systems win less than that. The problem is that the winners were not big enough to pay for the losers, and the drawdown reached 75.1 percent on the way down.
Cutting your risk per trade would shrink that drawdown. It would not fix anything. You cannot risk manage your way out of a strategy that loses on average, you can only lose more slowly.
What Settings Did We Change And Why?
The AFM Research Lab tested eleven combinations across the full ten years and kept whichever scored highest. Three things moved.
| Setting | Textbook | Filtered | The idea behind it |
|---|---|---|---|
| Swing lookback | 5 bars | 13 bars | Ignore small noisy swings and only mark bigger structure |
| Stop distance | 1.5 ATR | 2.5 ATR | Give the trade more room before it gets stopped out |
| Target | 2R | 1.5R | Take the win sooner instead of waiting for a bigger move |
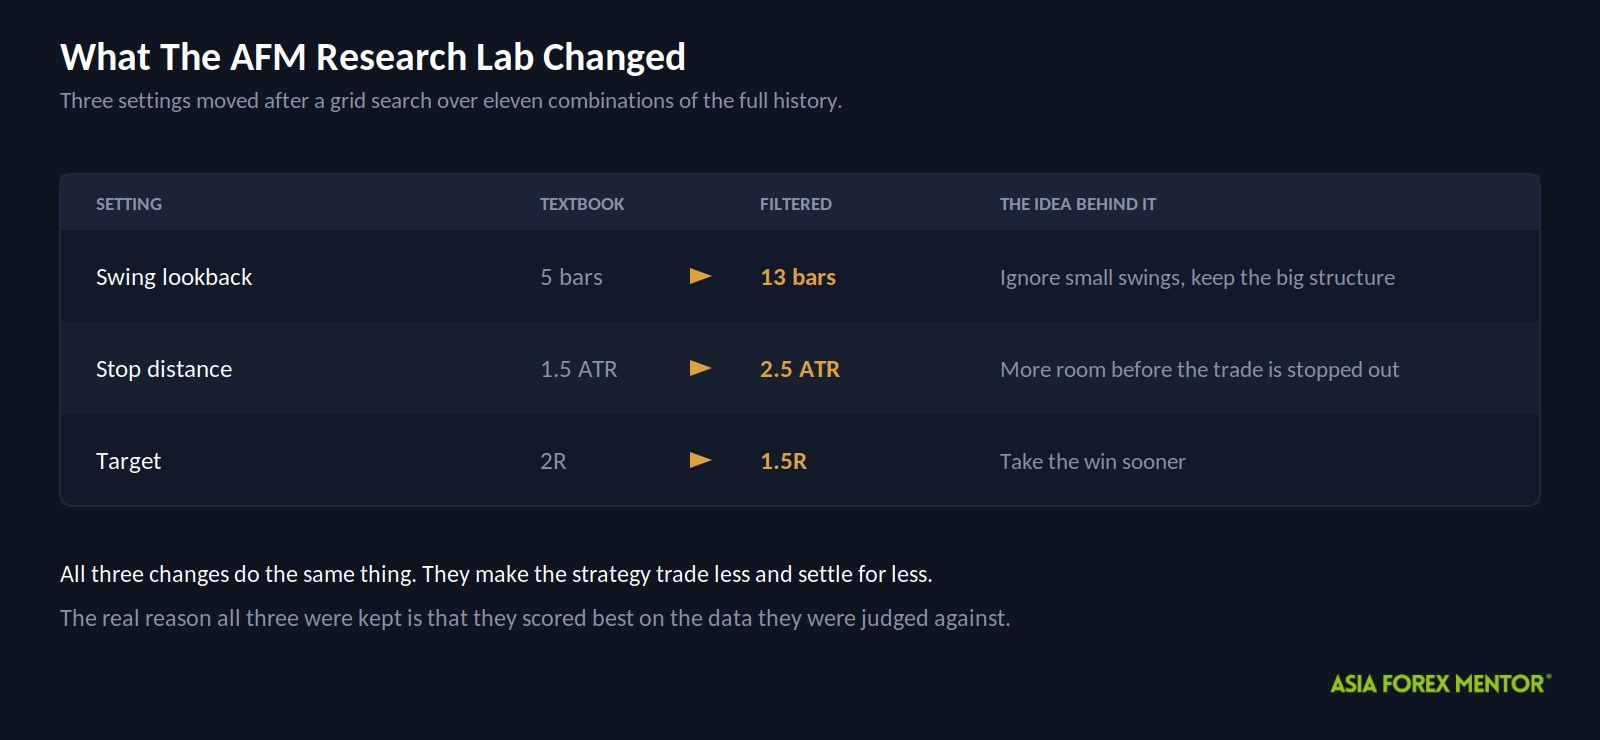
Each of those has a sensible story attached. The honest reason all three were kept is that they scored best on the data they were then judged against.
That has a name. In-sample optimization means the settings were tuned on the very history used to test them, so the test already knew the answers. Live results are almost always worse.
Notice what the three changes have in common. A longer lookback means fewer setups. A wider stop means fewer stop outs. A smaller target means more winners. Every change makes the strategy trade less and settle for less.
Did The New Settings Work?
They cut the losses. They did not produce a profit.
| Metric | Textbook | Filtered |
|---|---|---|
| Trades | 1,402 | 808 |
| Win rate | 37% | 44% |
| Expectancy | -0.09R | -0.02R |
| Profit factor | 0.85 | 0.95 |
| CAGR | -12.3% | -2.3% |
| Max drawdown | 75.1% | 50.0% |
| Average win | Not published | 1.03R |
| Average loss | Not published | -0.86R |
| Ending balance from $10,000 | $2,612 | $7,936 |
The win rate climbed seven points and the expectancy nearly reached breakeven. Profit factor still sits under 1, which means the losses still won.
And a 50 percent drawdown is not a repair. The limit most traders work to is 30 percent. This version is still well past it.
Did The Result Hold In Every Time Period?
We split the filtered trades into four slices by date and scored each one on its own. This is walk forward testing, and it is the difference between a student’s year end average and their report card term by term.
| Fold | Period | Trades | Win rate | Expectancy | CAGR | Max drawdown |
|---|---|---|---|---|---|---|
| 1 | Oct 2016 to Apr 2019 | 185 | 45% | -0.02R | -2.0% | 17.2% |
| 2 | Apr 2019 to Oct 2021 | 210 | 55% | +0.21R | +19.3% | 18.4% |
| 3 | Oct 2021 to Mar 2024 | 205 | 38% | -0.18R | -14.5% | 34.1% |
| 4 | Mar 2024 to Sep 2026 | 207 | 40% | -0.11R | -9.1% | 22.1% |
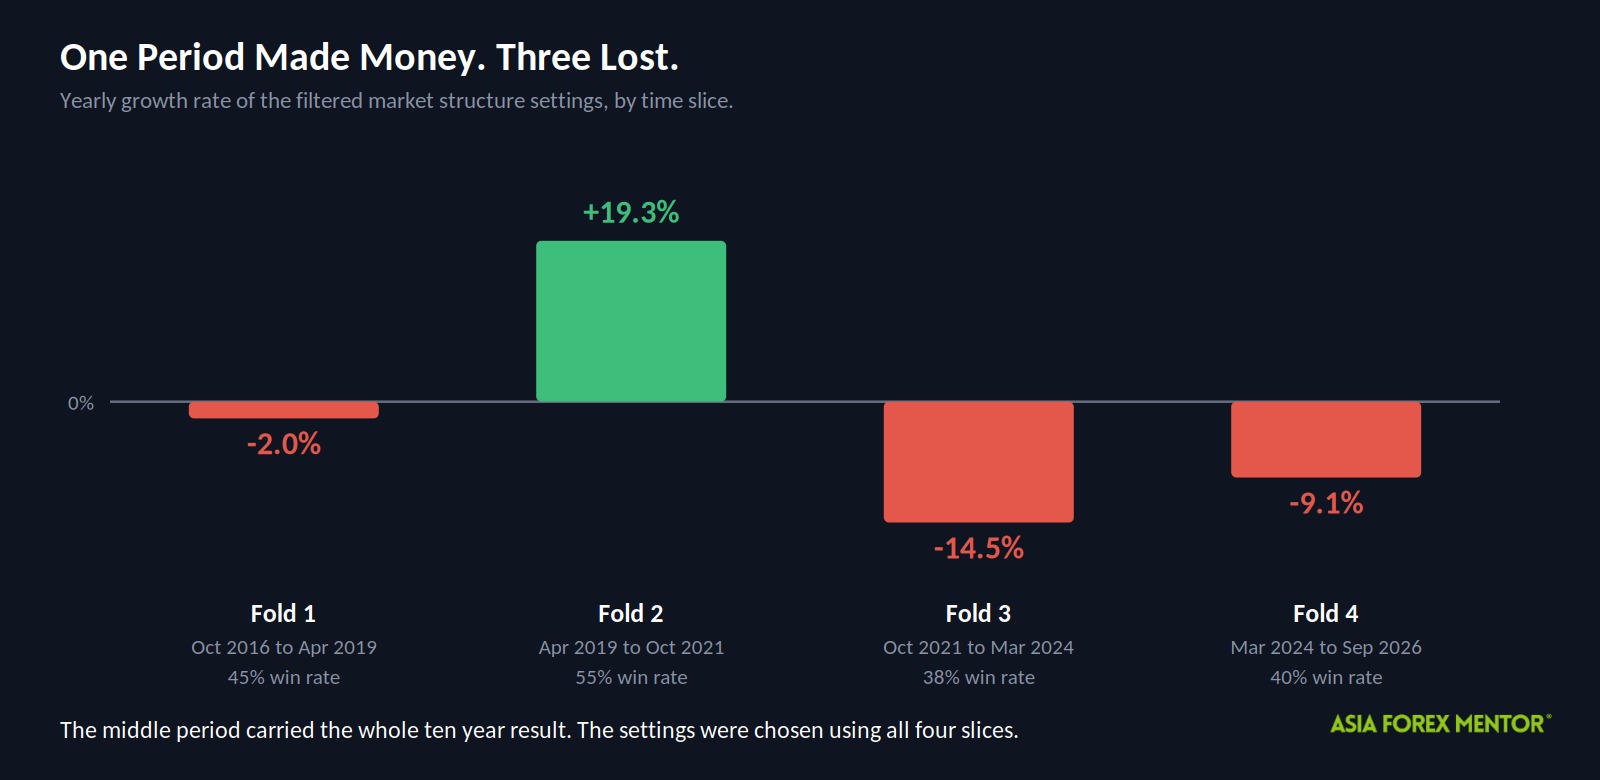
One slice made money. Fold 2 returned 19.3 percent for the year with an 18.4 percent drawdown, and it is the only period that did.
Look at the win rate column. Forty five, fifty five, thirty eight, forty. The middle period is the outlier and everything either side of it loses.
There is a catch on top of that. Those settings were chosen using all four periods, fold 2 included. So this is a consistency check on data the optimizer already saw, not a test on anything new. The real thing would look worse.
How Bad Could The Drawdown Get?
We also shuffled the order of the trades a thousand times to see what paths the account could have taken. Reordering trades cannot change the final return, so the growth figures came back identical every time and tell us nothing.
The drawdowns are the useful part. Across those thousand shuffles the typical worst fall was 35.1 percent, and even the unluckiest five percent of runs stopped at 45.4 percent. None of them wiped out the account.
The real sequence delivered 50.0 percent. Deeper than every shuffle we generated.
That is what happens when losses arrive in a clump instead of spread out. The market delivered them in a clump.
What Does A Winning Trade Look Like?
This is a real trade from the tested sample. It is also one of the better ones, so read it as the rules working rather than a typical week.
| Detail | Value |
|---|---|
| Pair and chart | AUDUSD, Daily |
| Direction | Long, meaning a buy |
| Entry | December 20, 2020 at 0.75876 |
| Stop | 0.74362 |
| Target | 0.78990 |
| Exit | February 21, 2021 at the target |
| Result | +2.01R in 43 bars |
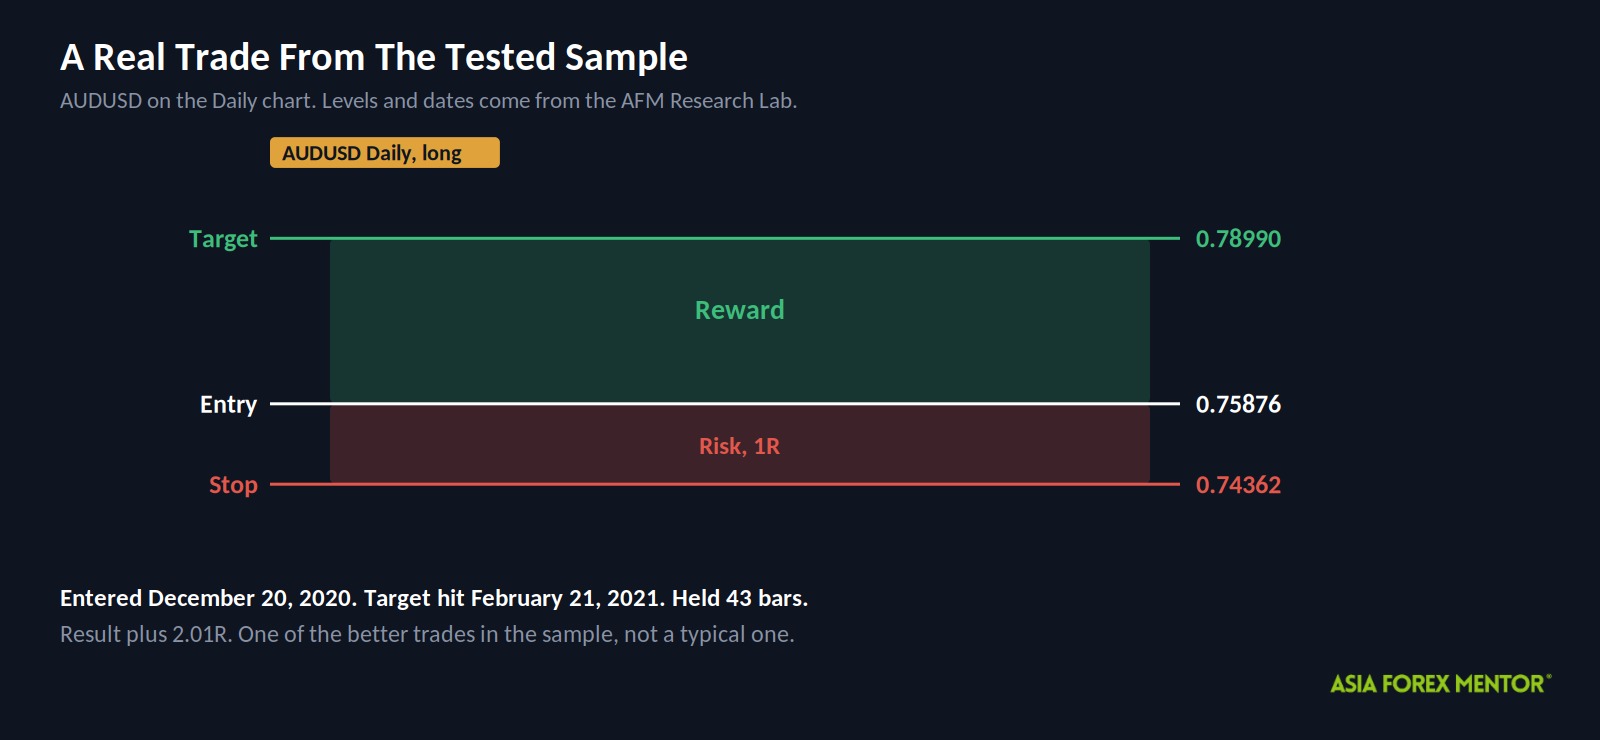
Price broke above the last swing high, the rules bought at 0.75876, and the stop went 2.5 ATR below at 0.74362. That put roughly $151 at risk on a $10,000 account.
Then it took two months. Price ground its way up and reached the target on February 21, 2021, 43 trading days later.
What About The Losing Trades?
Six out of ten trades in this version lost.
The average win was 1.03R. The average loss was 0.86R. Those two numbers sitting that close together is the whole problem in miniature, because at a 44 percent win rate you need your winners to be far bigger than your losers, and they are not.
The worst group was USDZAR, where trades lost close to 1.05R each.
The split by pair is just as uncomfortable. CHFJPY returned a positive 0.39R a trade and CADJPY a positive 0.37R, while EURNZD lost 0.45R. A set of rules that works on three pairs out of twenty eight is not a system, it is a coincidence with a spreadsheet.
How Should You Practice Market Structure Trading?
I would not trade these rules with real money. Reading structure is still a skill worth having, so here is how I would build it.
- Open a Daily chart on one pair and mark the last ten swing highs and swing lows by eye, using a 5 bar lookback.
- Find one structure break and write down the entry, the stop and the target it would have used.
- Walk the chart forward one bar at a time and record whether the stop or the target came first.
- Do that for at least twenty trades by hand before you trust any automated version.
- Run the same twenty with a 13 bar lookback and a wider stop, then compare the expectancy of each.
- Check your results pair by pair, because the Lab found some pairs behaved nothing like others.
- Split your results into four date ranges and check whether each one made money on its own.
Step seven is the one most people skip. It is also the only step that would have caught this.
Is Market Structure Trading Worth Your Time?
As a system, no. As a way of reading a chart, yes.
- The textbook rules turned $10,000 into $2,612 across 1,402 trades, with a 75.1 percent max drawdown.
- The filtered rules were chosen from eleven combinations on the same data that scored them, and still carried a 50.0 percent max drawdown.
- Results ranged from a positive 0.39R on CHFJPY to a negative 0.45R on EURNZD, so no single setting worked across all 28 pairs.
Knowing where the last swing high sits tells you something real about a chart. It just does not tell you enough, on its own, to risk money on.
Also Read: Breakout Trading Techniques You Must Know
Frequently Asked Questions
Is Market Structure Trading Profitable On Its Own?
Not as a mechanical system, going by this test. Neither the textbook version nor the tuned version made money over ten years, and both fell further from their highs than most accounts survive.
What Is A Swing High And A Swing Low?
A swing high is a candle with lower highs on both sides of it. A swing low is a candle with higher lows on both sides. Chain them together and you can see whether price is making higher highs or lower lows, which is the trend.
What Does ATR Mean In A Stop Loss Rule?
ATR stands for Average True Range, which is how much a pair usually moves in a day. Setting a stop in ATR means the stop sizes itself to each pair, instead of using the same pip distance on a quiet pair and a wild one.
Why Does A Walk Forward Test Matter?
Because an average can hide everything. Splitting ten years into four periods showed that one period carried the whole result and three lost money. Without that split, the strategy looks merely weak instead of broken.
Is An Optimized Version Safe To Trade Live?
No, not on its own. Settings picked by searching combinations are tuned to the exact history they were tested on, and that history is the one thing you will never trade again. Live results are usually worse.