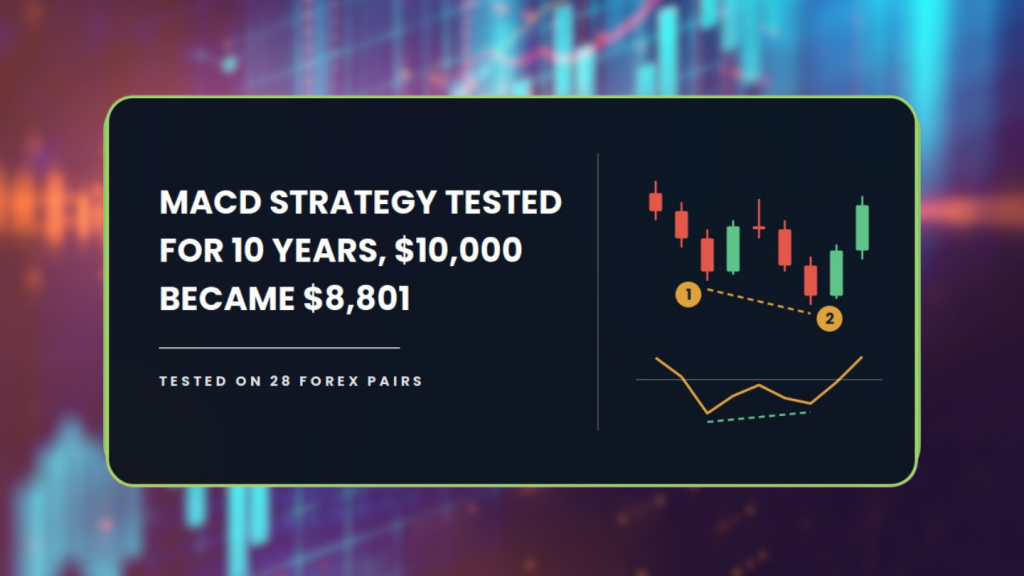
Most MACD strategy guides show you one chart where divergence worked perfectly. We tested it 895 times across 28 forex pairs on ten years of Daily data.
The textbook version turned $10,000 into $8,801. The filtered version finished ahead and is still not worth trading.
By the end of this you will understand why both of those are true at the same time, and how to spot the same trap in any strategy someone hands you.
| About This Guide |
|---|
| This guide explains what MACD is, what divergence means, and the exact entry, stop and target rules we put through the AFM Research Lab. It then shows what happened when those rules were tested on 28 forex pairs across ten years of Daily data, including the losses, the drawdowns and the point where the strategy stopped working. You will finish knowing how to spot a divergence, what the tested results actually say, and what would have to change before the setup is worth real money. |
| Quick Answer |
|---|
| MACD divergence is a disagreement between price and the MACD line, where price makes a new high or low and MACD refuses to follow. Traders read it as a trend running out of strength. In the AFM Research Lab, the textbook rules lost money across 28 pairs on the Daily chart, and the tuned rules made money in only one of four time periods. Treat it as context for reading a chart, not as a system. |
What Happened When We Tested It
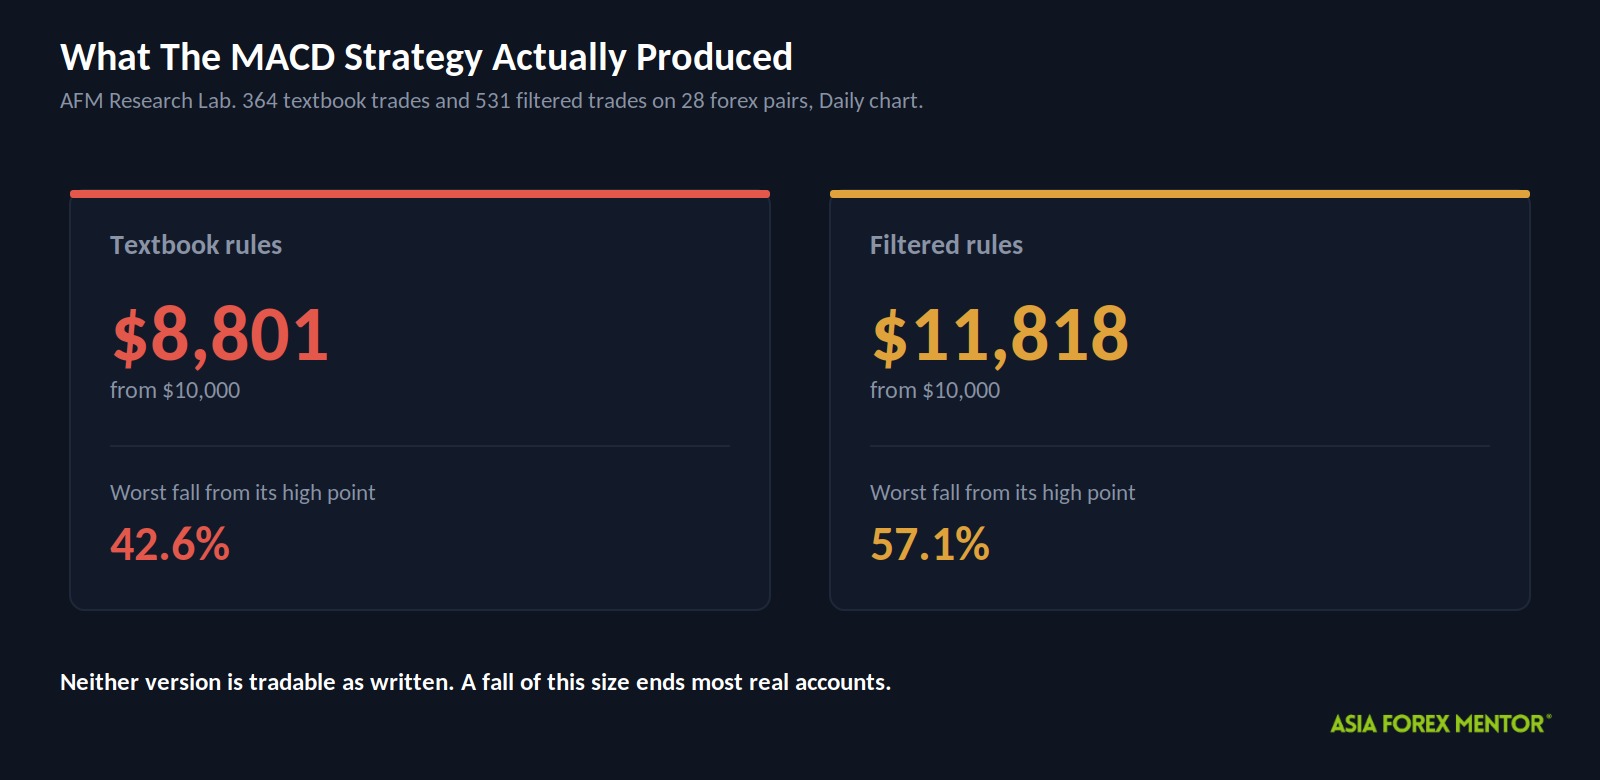
Two accounts, both starting at $10,000. One traded the rules you will find in most tutorials. The other traded settings the AFM Research Lab selected after testing twelve combinations.
| Version | Start | End | Max drawdown |
|---|---|---|---|
| Textbook | $10,000 | $8,801 | 42.6% |
| Filtered | $10,000 | $11,818 | 57.1% |
The second number in that last column is the one that matters, and it needs explaining.
Drawdown is how far an account falls from its highest point. Picture a hike. Drawdown is not how far you are above the car park, it is how far you have walked back down from the summit. Max drawdown is the worst of those descents across the whole test.
So the filtered version finished up, but at one stage it had given back 57.1 percent of its peak. Most people close the account long before that.
These are backtest results from the AFM Research Lab. Backtesting is not live trading, and past results do not guarantee future performance.
Key Takeaways
- The textbook rules lost money over ten years, finishing at $8,801 from a $10,000 start.
- The tuned settings finished at $11,818, but only after falling 57.1 percent from their high point.
- Those settings were chosen by testing twelve combinations on the same data they were then scored on, which flatters the result.
- The strategy made money in the first quarter of the test period and lost in the other three.
What Is The MACD Strategy?
The MACD strategy tested here is built on divergence, which is a disagreement between price and an indicator. Price pushes to a new high or low, the indicator refuses to follow, and traders read that as a trend running out of fuel.
MACD stands for Moving Average Convergence Divergence. The name is heavier than the idea.
A moving average is simply the average closing price over a set number of recent days. MACD uses two of them, one fast and one slow, and subtracts the slow from the fast. When price accelerates, the gap widens. When it stalls, the gap closes.
That is all MACD is. A speedometer for a trend.
Now picture price climbing to a fresh high while MACD quietly makes a lower high. Price is still rising, but with less force behind it each time. That is a bearish divergence, and traders treat it as a reason to sell.
Flip it over and you have the bullish version. Price grinds to a new low, MACD makes a higher low, and the selling is running out of sellers.
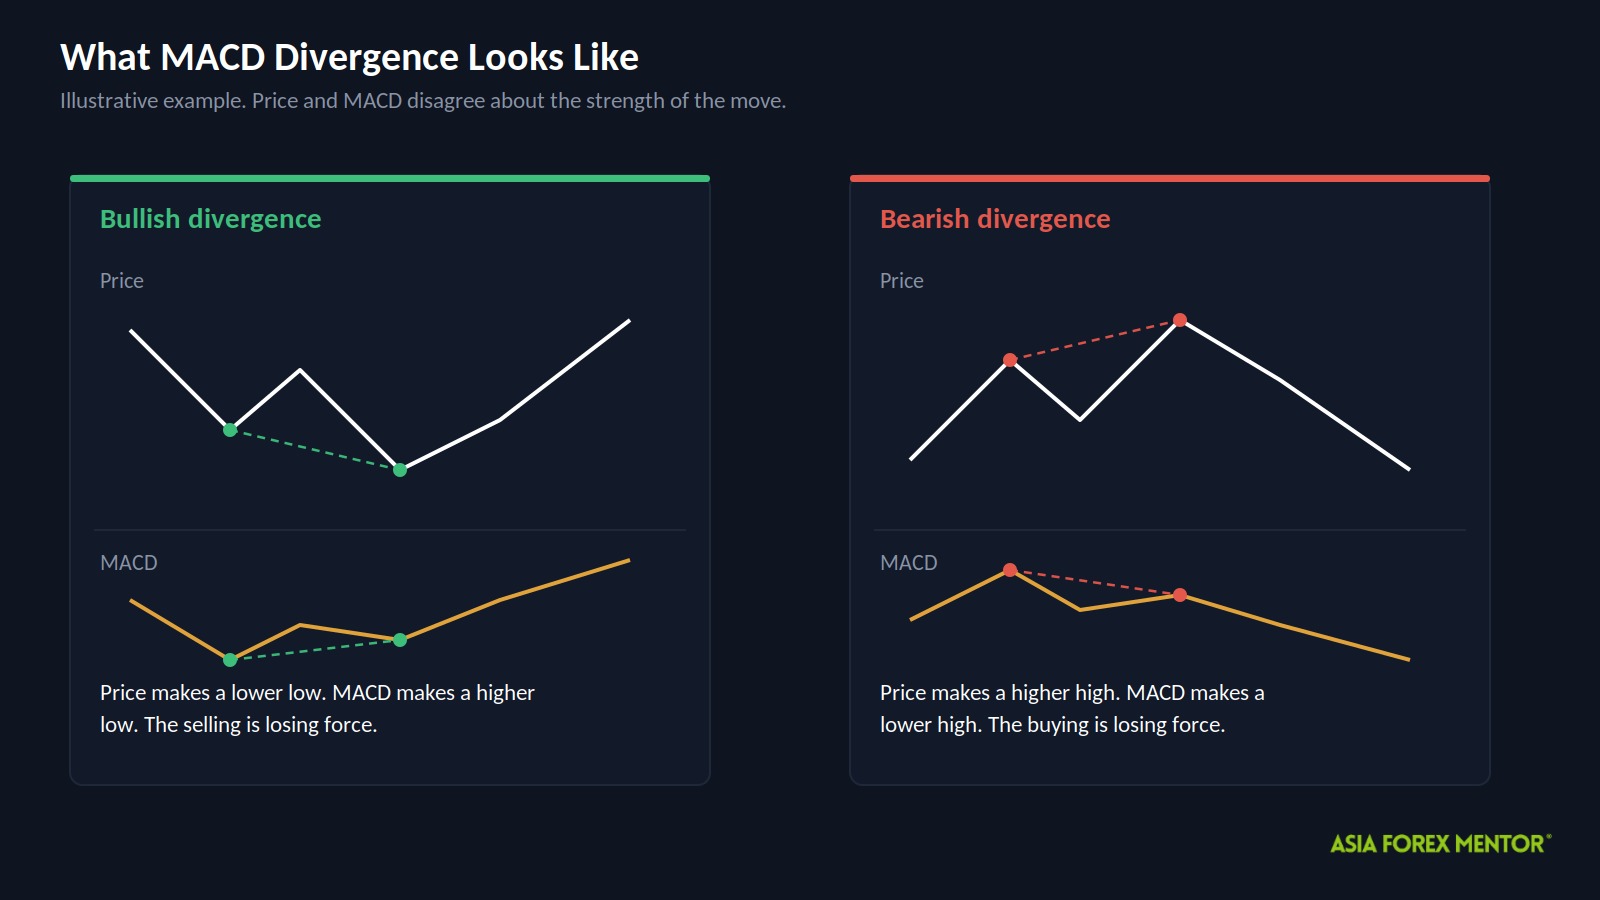
To find either one you need swings. A swing high is a peak with lower candles on both sides. A swing low is a dip with higher candles on both sides. Divergence compares two of them in a row.
One warning before any of this becomes a trade. A divergence tells you a trend is tiring. It does not tell you when it will stop. Price can keep running while the divergence gets bigger and bigger, which is exactly why every version we tested carries a stop, a target and a time limit.
How Do Most Traders Trade MACD Divergence?
They find a divergence between two swings, buy or sell in the new direction, and let a stop and a fixed target decide the rest.
Two terms you need first.
ATR means Average True Range. It is the average size of a day’s move over recent days, so it works like a weather report for price. A pair with a wide ATR swings around more than one with a narrow ATR.
R is whatever you put at risk on a single trade, measured from your entry price to your stop. On a $10,000 account risking 1 percent, 1R is $100. A 2R target is aiming for $200.
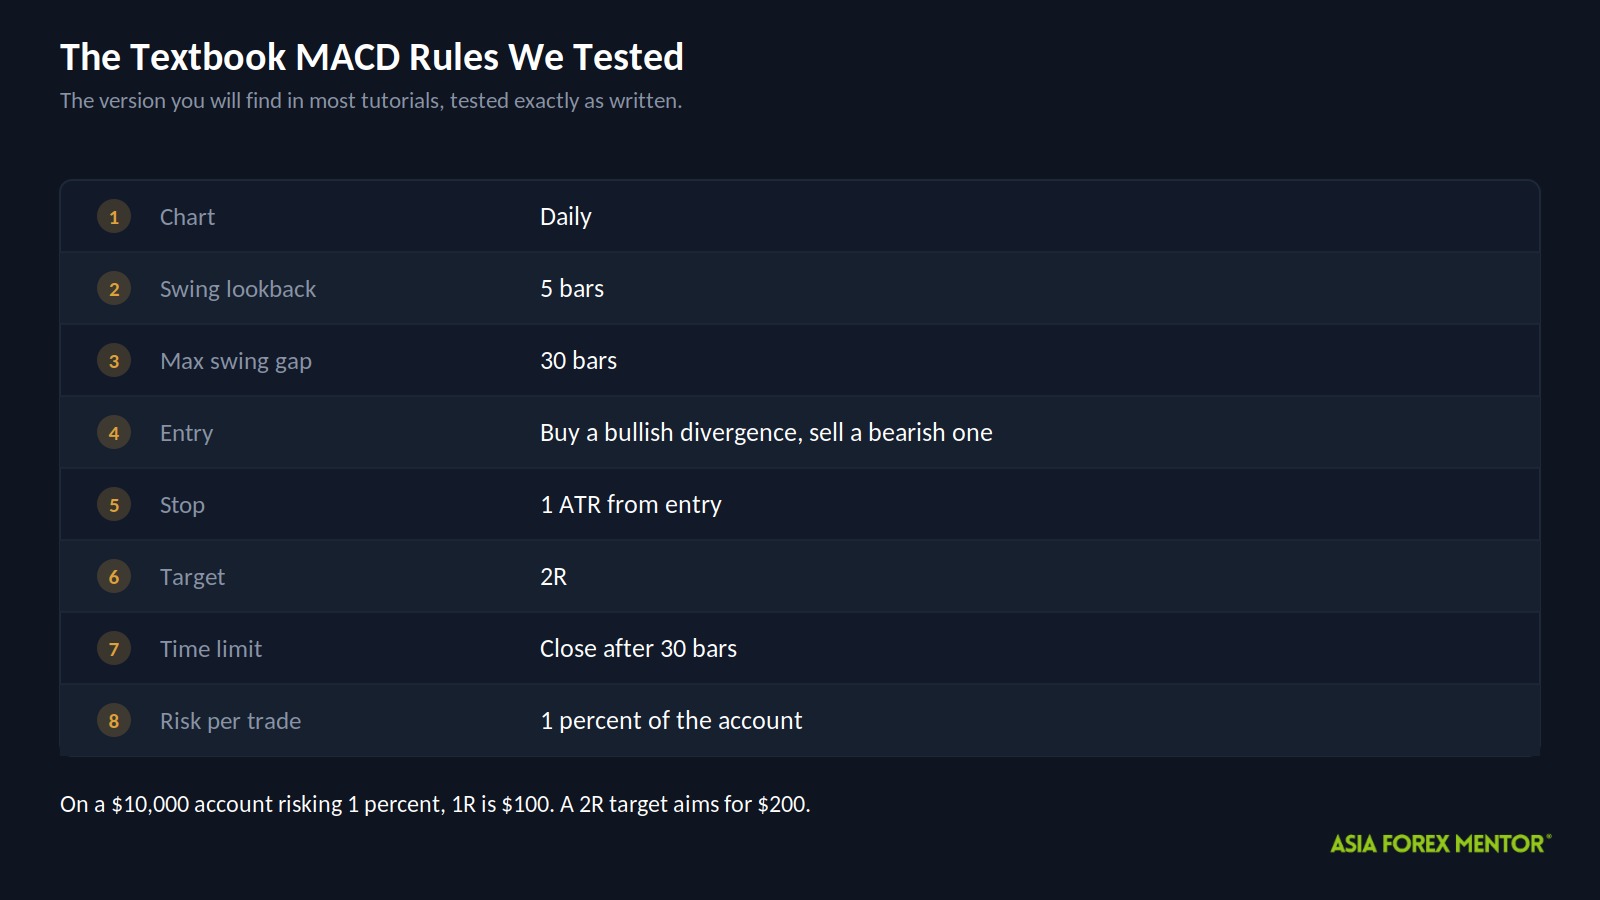
Here are the rules exactly as we tested them.
- Open the Daily chart and add MACD below price.
- Mark swing highs and lows using a lookback of 5 bars, where a bar is one daily candle.
- Only compare two swings sitting no more than 30 bars apart.
- Buy a bullish divergence. Sell a bearish one.
- Place the stop 1 ATR away from the entry price.
- Place the target at 2R.
- Close the trade after 30 bars if neither level is hit.
Does The Textbook MACD Strategy Make Money?
Over ten years and 364 trades, this version lost money.
It won 41 percent of those trades, which sounds survivable until you look at what the winners were worth. The average win came in at 1.27R, well short of the 2R target, meaning most winning trades were closed by the clock before price ever got there. The average loss was 0.92R.
| Metric | Textbook |
|---|---|
| Trades | 364 |
| Win rate | 41% |
| Expectancy | -0.03R |
| Profit factor | 0.95 |
| CAGR | -1.3% |
| Max drawdown | 42.6% |
| Ending balance from $10,000 | $8,801 |
Expectancy is what the average trade earns or loses, measured in R. At -0.03R, each trade bled a sliver of its own risk. Profit factor is total winnings divided by total losses, so anything under 1 means the losses won, and 0.95 means they won by a nose.
A 42.6 percent drawdown rules this version out on its own. Cutting your risk per trade would shrink the drawdown, but it would also shrink an edge that is already negative. You cannot risk-manage your way out of a strategy that loses on average.
What Settings Did We Change And Why?
The Lab tested twelve combinations of settings across the full ten years and kept whichever scored highest. Four things moved.
| Setting | Textbook | Filtered | What it does |
|---|---|---|---|
| Swing lookback | 5 bars | 3 bars | Marks smaller swings, so more divergences appear |
| Max swing gap | 30 bars | 50 bars | Lets swings further apart count as a pair |
| Stop distance | 1 ATR | 0.5 ATR | Tighter stop, so the same 1R sits closer to entry |
| Target | 2R | 2R | Unchanged |
| Time limit | 30 bars | 10 bars | Closes dead trades sooner |
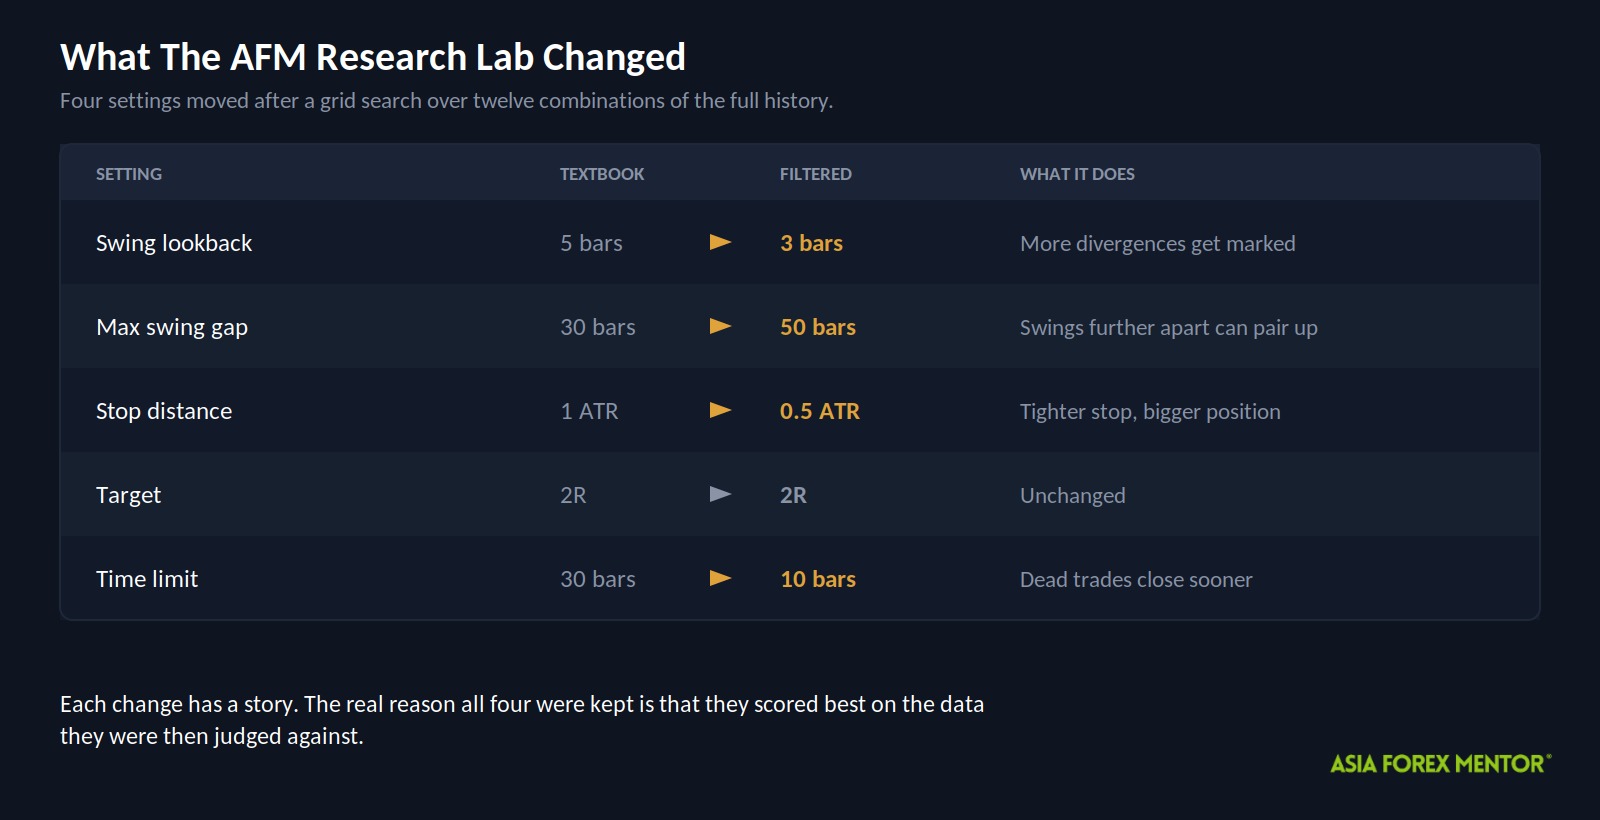
Each of those has a story you could tell about why it should help. The honest answer is simpler. They were kept because they scored best on the data they were tested against.
That approach has a name. In-sample optimization means the settings were tuned on the very history used to judge them, so the test already knew the answers. Live results are almost always worse.
The tighter stop does more than it looks. Risk stays fixed at 1 percent, so halving the stop distance doubles the position size. The trade gets bigger, the target gets closer, and ordinary market noise now reaches the stop far more easily.
Did The New MACD Settings Work?
The account finished higher, at $11,818, with a max drawdown of 57.1 percent.
| Metric | Textbook | Filtered |
|---|---|---|
| Trades | 364 | 531 |
| Win rate | 41% | 40% |
| Expectancy | -0.03R | +0.04R |
| Profit factor | 0.95 | 1.07 |
| CAGR | -1.3% | +1.7% |
| Max drawdown | 42.6% | 57.1% |
| Average win | 1.27R | 1.61R |
| Average loss | -0.92R | -1.00R |
| Ending balance from $10,000 | $8,801 | $11,818 |
Expectancy crossed into positive territory, but only just. At 0.04R a trade, a small rise in spreads or a slight shift in market behaviour erases it entirely. Meanwhile the drawdown got considerably worse, not better.
Did The Result Hold In Every Time Period?
We cut the filtered trades into four slices by date and scored each one separately. This is called walk forward testing. It is the difference between a student’s year-end average and their report card term by term.
| Fold | Period | Trades | Win rate | Expectancy | CAGR | Max drawdown |
|---|---|---|---|---|---|---|
| 1 | Aug 2016 to Feb 2019 | 131 | 56% | +0.56R | +32.8% | 12.2% |
| 2 | Feb 2019 to Aug 2021 | 140 | 36% | -0.05R | -3.2% | 32.2% |
| 3 | Aug 2021 to Mar 2024 | 122 | 33% | -0.25R | -12.0% | 30.0% |
| 4 | Mar 2024 to Sep 2026 | 137 | 34% | -0.11R | -6.3% | 18.3% |
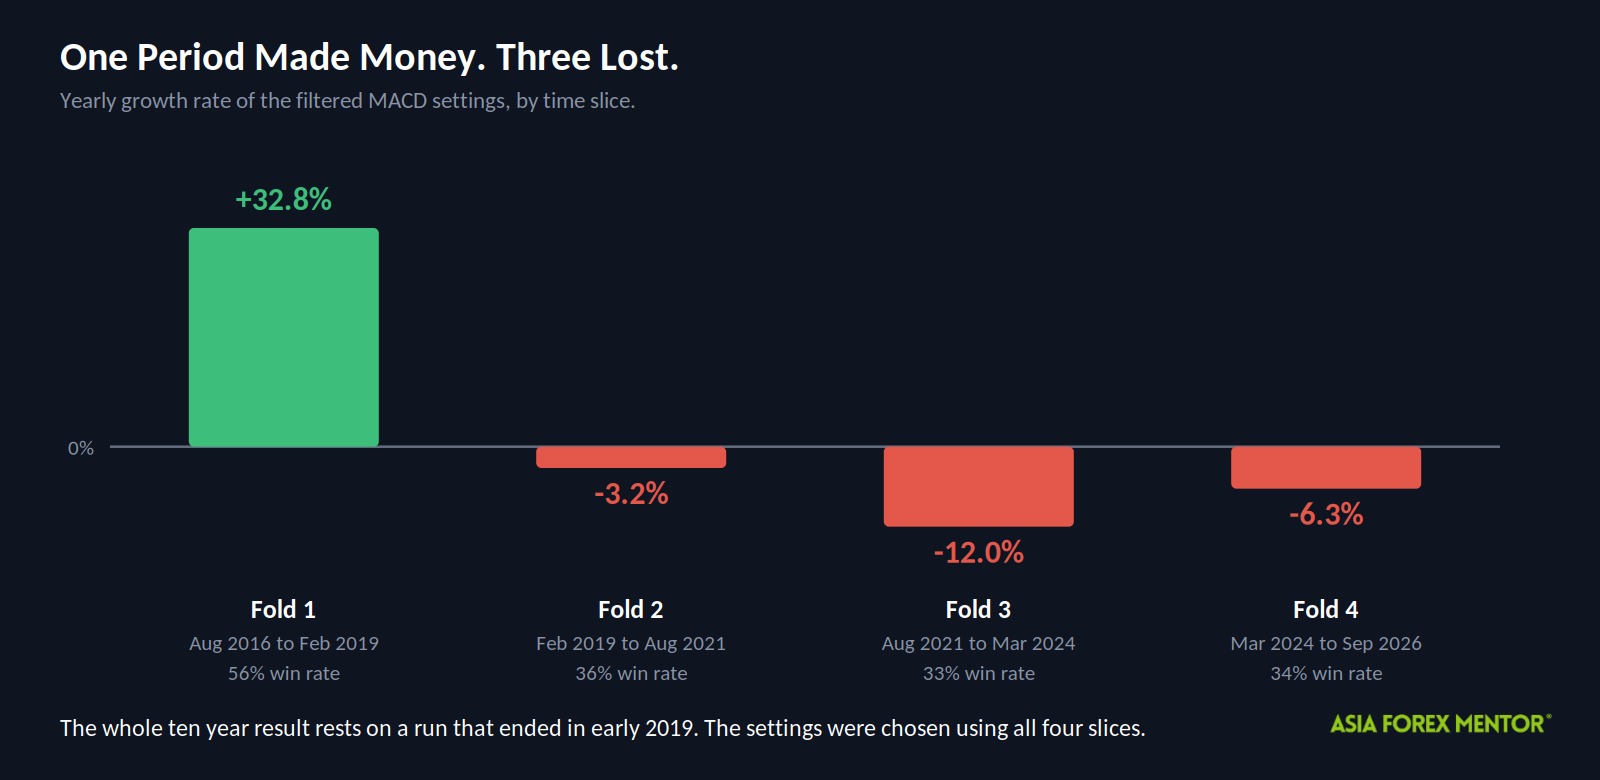
One slice made money. Three lost.
Read down that win rate column and you can watch the strategy decay. Fifty six percent in the first period, then thirty six, thirty three, thirty four. The entire ten year result rests on a run that ended in early 2019 and never came back.
That is not a strategy with a rough patch. That is a strategy that worked in one market and has been losing since.
There is a catch on top of the catch. Those settings were chosen using all four periods, so this is a consistency check, not a test on data the strategy had never seen. The real thing would look worse.
How Bad Could The Drawdown Get?
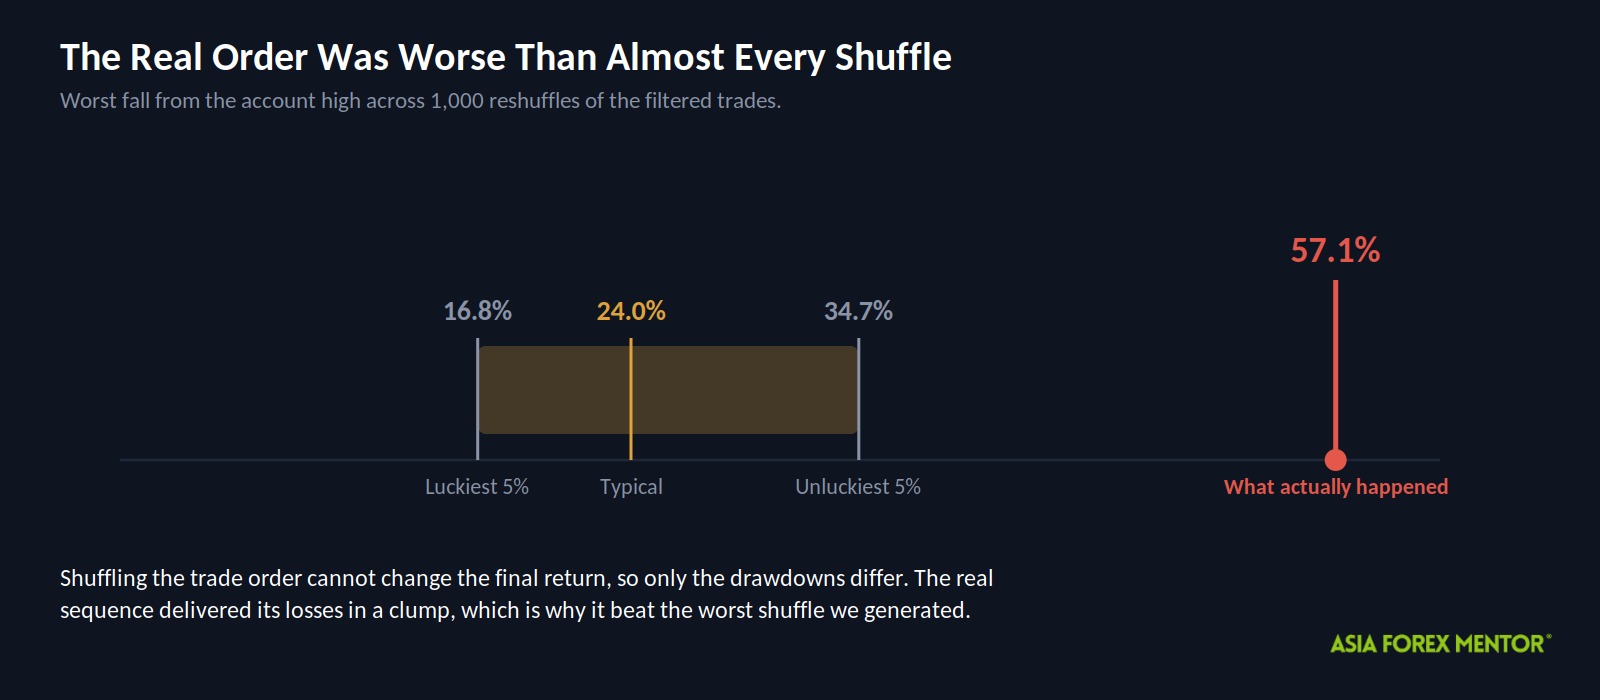
We also shuffled the order of the trades a thousand times to see how the account path could have gone. Changing the order cannot change the final return, so the growth figures came back identical every time, which tells us nothing.
The drawdowns are where it gets interesting. Across those thousand shuffles the typical worst drawdown was 24.0 percent, and even the unluckiest five percent of runs stayed under 34.7 percent.
The real order produced 57.1 percent. Worse than virtually every shuffle we generated.
That happens when losses arrive in a clump rather than spread out. The real market delivered them in a clump.
Pair by pair, the picture is noise. USDHKD looks superb at +0.88R a trade, but that is 14 trades. AUDNZD looks terrible at -0.71R, on 12. Neither number means anything at that sample size, and choosing the winners after the fact is just in-sample fitting wearing a different hat.
What Does A Winning Trade Look Like?
This is a real trade from the tested sample. It is also one of the best in it, so treat it as an example of the rules working rather than a typical day.
| Detail | Value |
|---|---|
| Pair and chart | AUDCAD, Daily, filtered version |
| Direction | Long, meaning a buy |
| Entry | May 15, 2018 at 0.96176 |
| Stop | 0.95292 |
| Target | 0.97945 |
| Exit | May 24, 2018 at the target |
| Result | +1.95R in 7 bars |
The Lab found a bullish divergence here. Price had made a lower low while MACD made a higher low, so the rules bought at 0.96176.
The stop went 0.5 ATR below, at 0.95292. The target sat 2R above, at 0.97945. Price covered the distance in seven days, inside the ten bar limit, and the trade closed for slightly under 2R once trading costs came out.
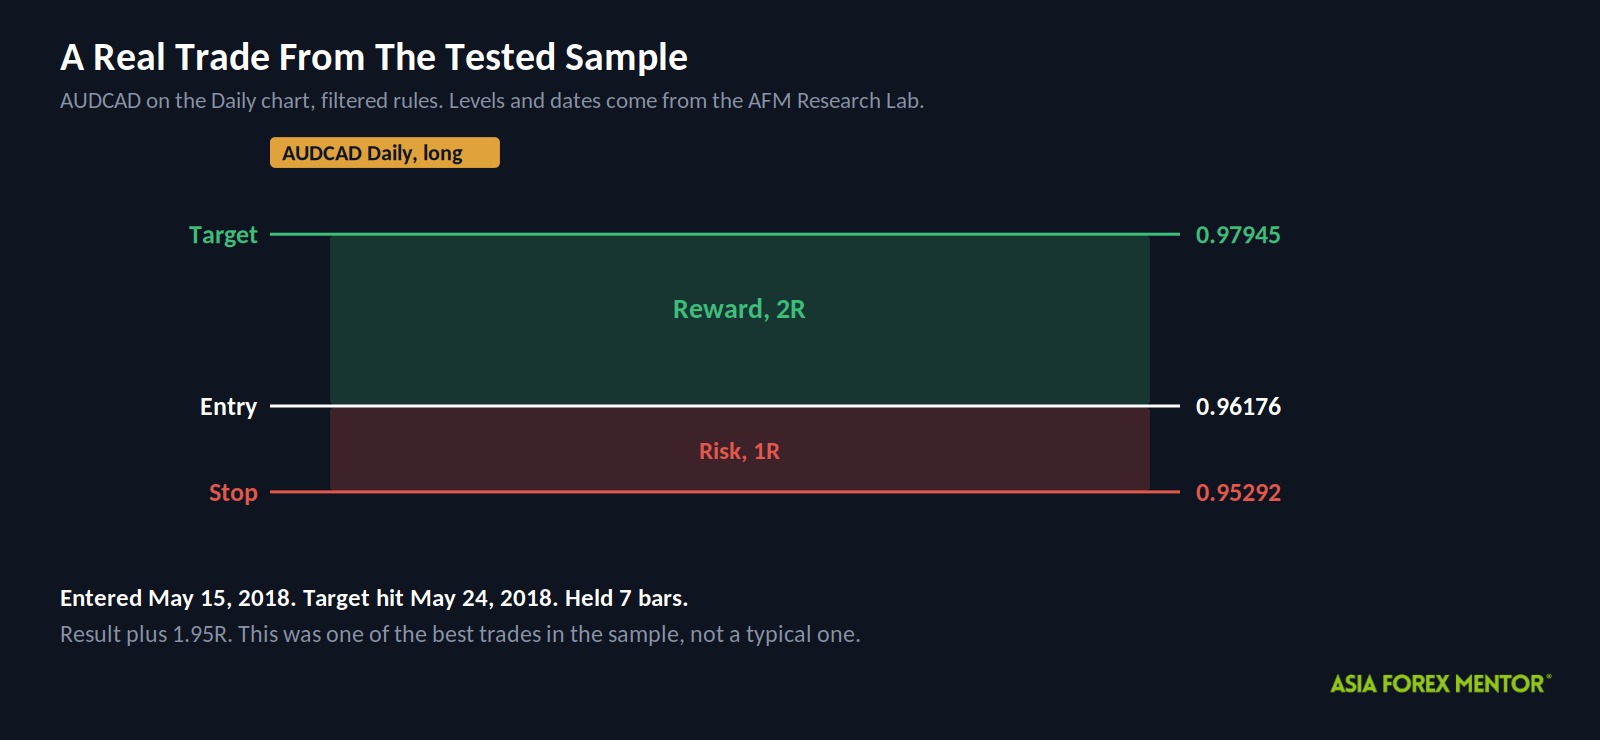
On a $10,000 account at 1 percent risk, that trade made just under $200.
Now the other side. This version won 40 percent of its trades, so six in ten lost. The five worst in the entire sample were all the same pair, USDZAR, and all of them were stops.
How Should You Practice MACD Divergence?
I would not trade these rules with real money. I would still spend time with them, because learning to spot a tiring trend is worth something even when the mechanical version fails.
- Open a Daily chart and add MACD below price.
- Mark swing highs and lows with a 3 bar lookback.
- Find two swings within 50 bars of each other and check whether price and MACD disagree.
- Write down each divergence you find, bullish or bearish, with its date.
- Read the ATR on the entry day and mark a stop 0.5 ATR away.
- Mark a 2R target and count ten bars forward as your deadline.
- Record every result in R in a spreadsheet, losers included.
- Split your results into four date ranges and check whether each one made money on its own.
- Trade it on a demo account going forward, because that is the only data these settings have never seen.
Step nine is the one most people skip, and it is the only step that tells you anything new.
Also Read: MACD Histogram Ultimate Guide
Conclusion
MACD divergence did not hold up as a system in our test. I would use it as context for reading a chart and nothing more.
- The textbook rules lost money, finishing at $8,801 with a 0.95 profit factor and a 42.6 percent max drawdown across 364 trades.
- The filtered settings were picked from twelve combinations on the same data that scored them, and still carried a 57.1 percent max drawdown.
- Only the first of four time slices made money, so the ten year result rests entirely on a period that ended in 2019.
If a divergence makes you check your position more carefully, it has done its job. If it is the only reason you are in a trade, the data says you are guessing.
Frequently Asked Questions
Is MACD Divergence A Reliable Signal?
Not on its own, going by this test. The textbook rules lost money and the tuned settings made money in only the first of four periods. Treat divergence as a warning light, not a trade signal.
What Timeframe Did The AFM Research Lab Test?
The Daily chart only, where each candle is one day of trading. Other timeframes were not part of this test, so we cannot tell you how they behave.
What Does A Profit Factor Below 1 Mean?
It means the losses outweighed the wins. The textbook version came in at 0.95, so for every dollar it made, it lost slightly more than a dollar.
Should I Use The Filtered MACD Settings?
I would not. They were chosen from twelve combinations tested on the same data that scored them, and the max drawdown was 57.1 percent. Settings picked that way almost always perform worse live.
Why Did Some Pairs Do Better Than Others?
Mostly luck. Each pair had somewhere between 12 and 27 trades in the filtered test, which is far too few to mean anything. Picking the best performers afterwards is just another way of fitting to the past.