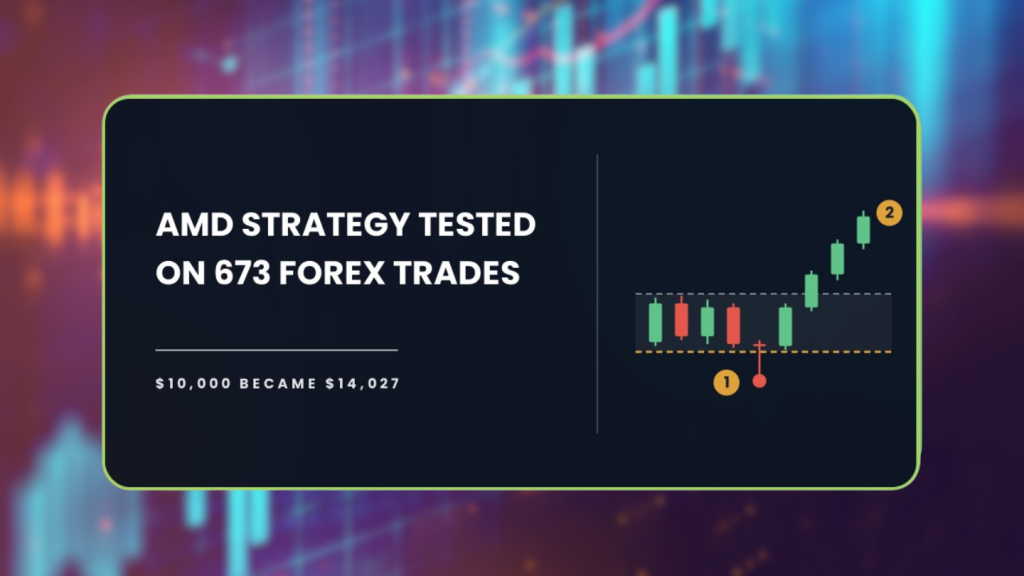
The AMD strategy turned $10,000 into $14,027, untuned, across 673 trades and ten years. The three setups I tested before it all failed. Here is what held up, and the one number that should still worry you.
| About This Guide |
|---|
| This guide explains what the AMD strategy is, the exact entry, stop and target rules we put through the AFM Research Lab, and what happened across 28 forex pairs and ten years of Daily data. You will finish knowing what the tested results say, where the weak spot is, and whether the setup is worth real money. |
| Quick Answer |
|---|
| AMD stands for accumulation, manipulation, distribution. The setup waits for price to range, fake its way out of that range, then reverse. In the AFM Research Lab the textbook rules turned $10,000 into $14,027 across 28 pairs on the Daily chart, with a 25 percent worst fall along the way. |
What Happened When We Tested The AMD Strategy
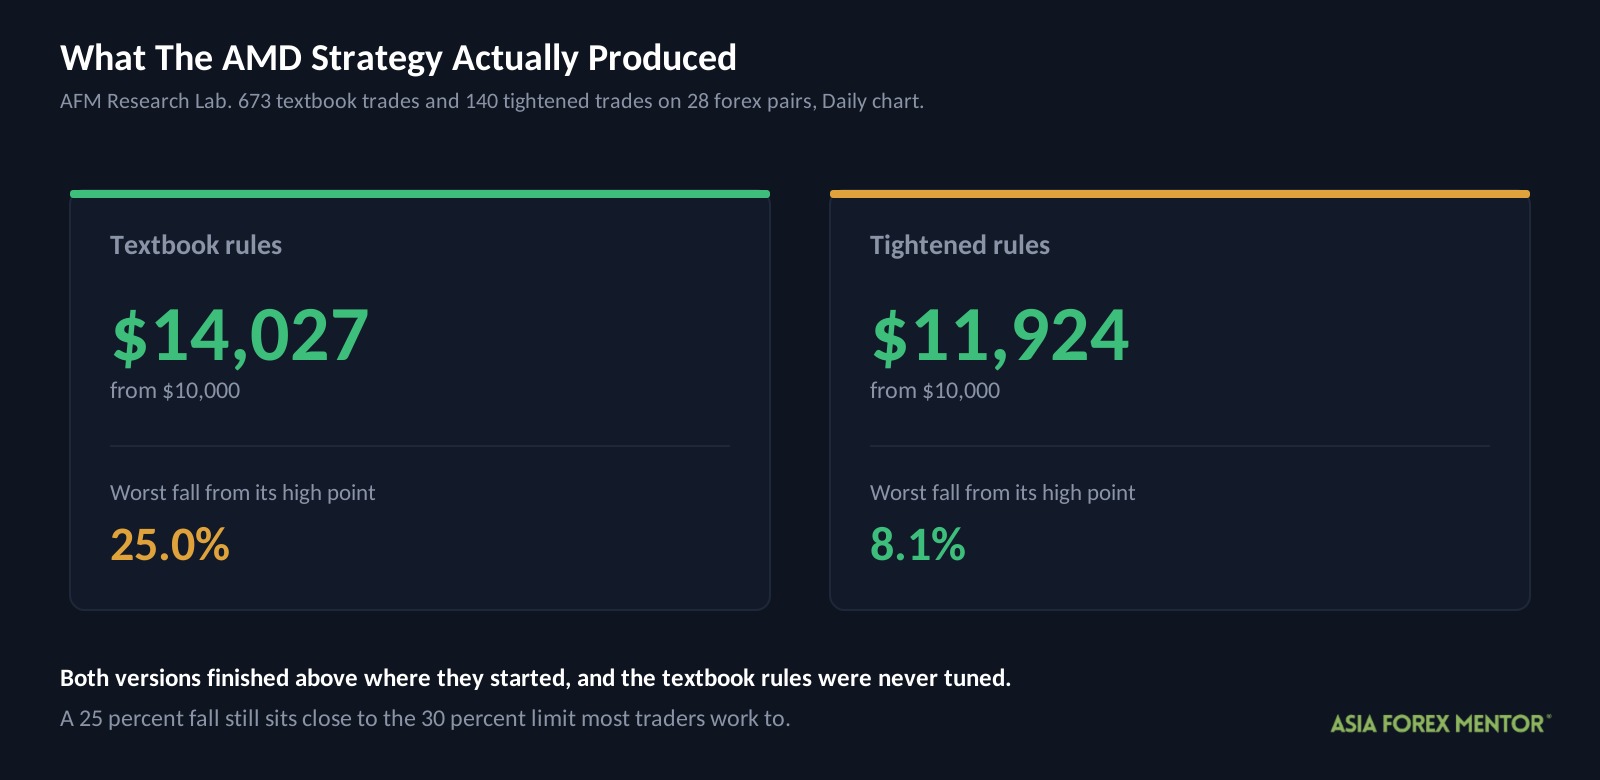
Two accounts, both starting at $10,000. One traded the rules you will find in most tutorials. The other traded a tightened version the AFM Research Lab built on top of them.
Both finished above where they started, which has not happened in any test we have published.
| Version | Start | End | Max drawdown |
|---|---|---|---|
| Textbook | $10,000 | $14,027 | 25.0% |
| Tightened | $10,000 | $11,924 | 8.1% |
That last column needs explaining before the rest makes sense.
Drawdown is how far an account falls from its highest point. It is not how far you are up or down overall, it is the size of the worst slide from a peak to the low that followed.
A 25 percent drawdown means that at one stage a quarter of the account’s peak value was gone. At its lowest point the textbook account was worth about $9,568, below where it started.
The test ran from June 26, 2016 to September 2, 2026, across 28 currency pairs on the Daily chart. Each trade risked 1 percent of the account, and trading costs were charged at 0.05 percent of the entry price per round trip.
These are backtest results. Backtesting is not live trading, and past results do not guarantee future performance.
Key Takeaways
- The textbook rules made money, turning $10,000 into $14,027 across 673 trades over ten years.
- That version was never tuned, which makes it the more trustworthy of the two results here.
- The worst fall was 25 percent, inside the 30 percent limit most traders work to, but not comfortably inside it.
- Tightening the rules cut the worst fall to 8.1 percent and raised the win rate to 56 percent, but the account grew more slowly and only took 140 trades in a decade.
- Three of the four time periods made money. The fourth lost 0.4 percent, so the edge is real but thin.
What Is The AMD Strategy And How Does It Work?
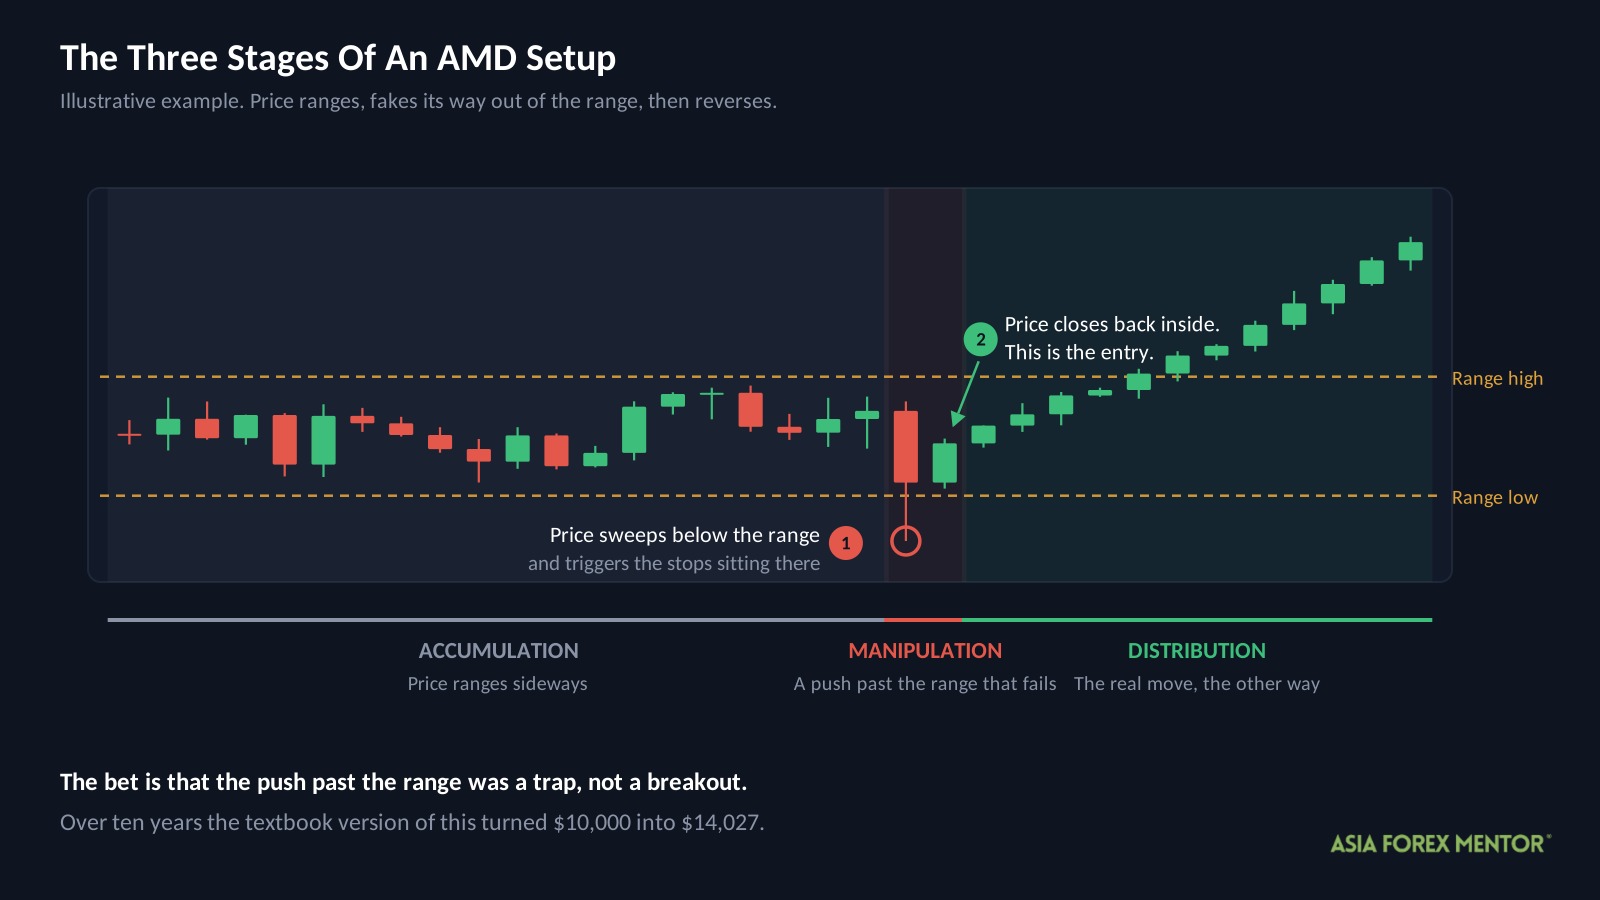
The AMD strategy reads a three stage sequence on the chart, and the letters stand for accumulation, manipulation and distribution. It is a way of trading the moment a breakout turns out to be false, rather than trading the breakout itself.
Accumulation is the quiet part. Price moves sideways in a range for a stretch of bars, and neither buyers nor sellers take control.
Manipulation is the fake out. Price pushes out of that range, far enough to look like a real breakout and to trigger the stop losses sitting just beyond it, then fails to continue.
Distribution is the move that pays. Price turns back through the range and runs the other way, and the AMD trader enters on that turn.
The whole idea rests on one observation, which is that the most obvious level on a chart is also where the most stop losses sit. A push through that level and straight back is the signal.
How Do Most Traders Trade AMD?
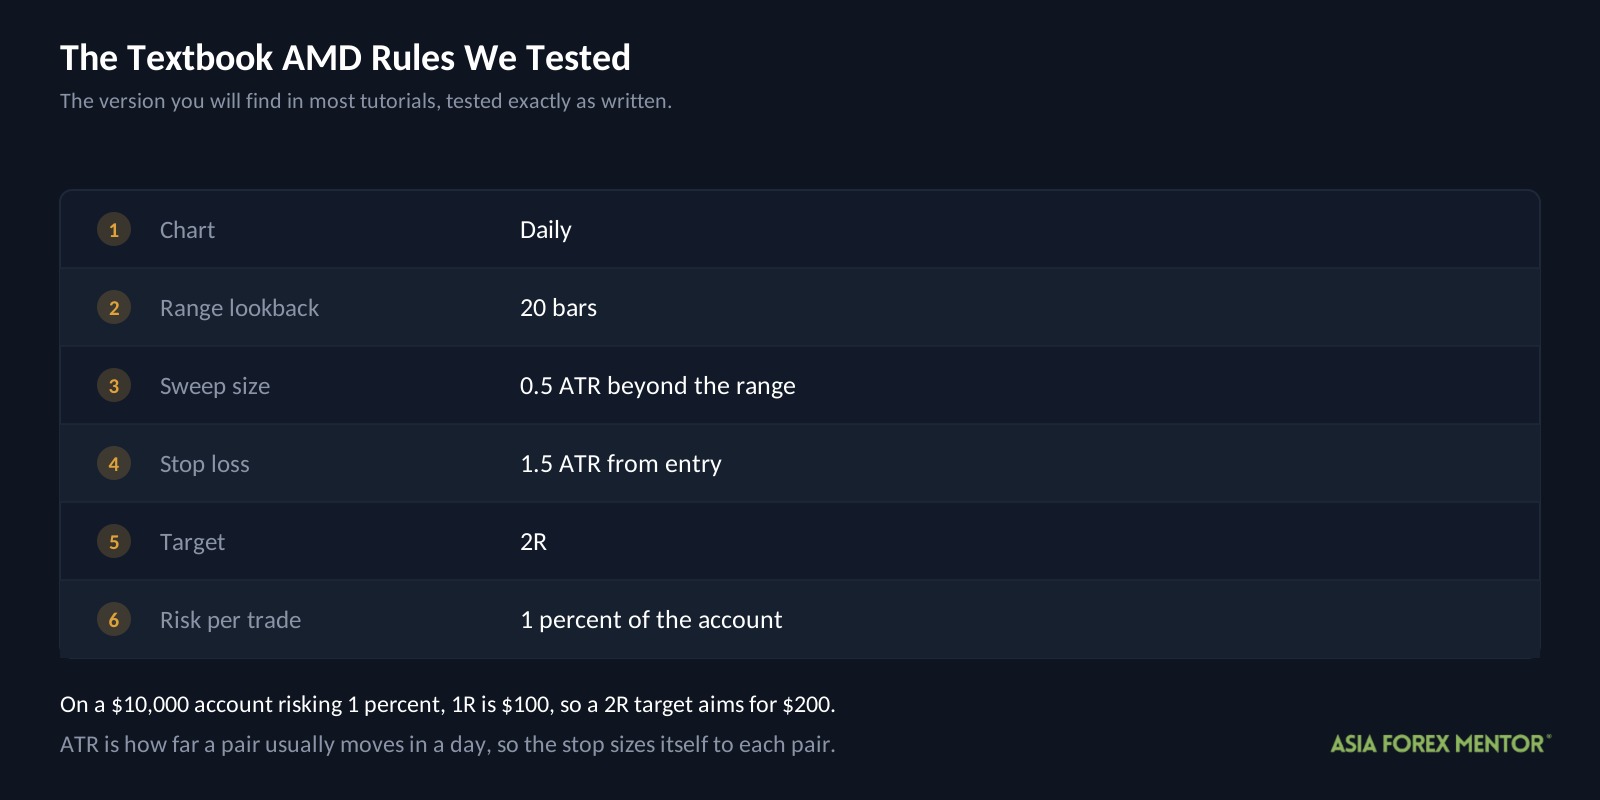
They define the range, wait for a push beyond it, and let a stop and a fixed target handle the rest.
Two terms you need first.
ATR means Average True Range. It is how much a pair usually moves in a day, so a stop set in ATR sizes itself to each pair instead of using the same pip distance everywhere.
R is what you risk on one trade, measured from entry to stop. On a $10,000 account risking 1 percent, 1R is $100, so a 2R target aims for $200.
Here are the rules exactly as we tested them.
| Rule | Setting |
|---|---|
| Chart | Daily |
| Range lookback | 20 bars |
| Sweep size | 0.5 ATR beyond the range |
| Stop loss | 1.5 ATR from entry |
| Target | 2R |
| Risk per trade | 1 percent of the account |
The sweep size is the part people get wrong. It sets how far price has to push past the range before the move counts as manipulation rather than noise, and at 0.5 ATR that bar is deliberately low.
Does The Textbook Version Make Money?
Yes. Over 673 trades and ten years it grew the account by just over 40 percent.
| Metric | Textbook |
|---|---|
| Trades | 673 |
| Win rate | 45% |
| Expectancy | +0.06R |
| Profit factor | 1.11 |
| Yearly growth rate | 3.3% |
| Max drawdown | 25.0% |
| Ending balance from $10,000 | $14,027 |
Three of those need defining.
Expectancy is what the average trade earns or loses, measured in R. At plus 0.06R, every trade made back about a sixteenth of what it risked, and 673 of those compound into the result above.
Profit factor is total winnings divided by total losses. Above 1 means the strategy made money, so 1.11 says it took in $1.11 for every dollar it paid out.
Yearly growth rate, often written as CAGR, is the rate the account grew each year on average. At 3.3 percent a year, compounding over a decade, $10,000 becomes $14,027.
Now the honest part. A 3.3 percent yearly return is lower than what most savings accounts paid over the same decade, and you carried a 25 percent drawdown to get it. The strategy works, but working and being worth the risk are two different questions.
What Settings Did AFM Change And Why?
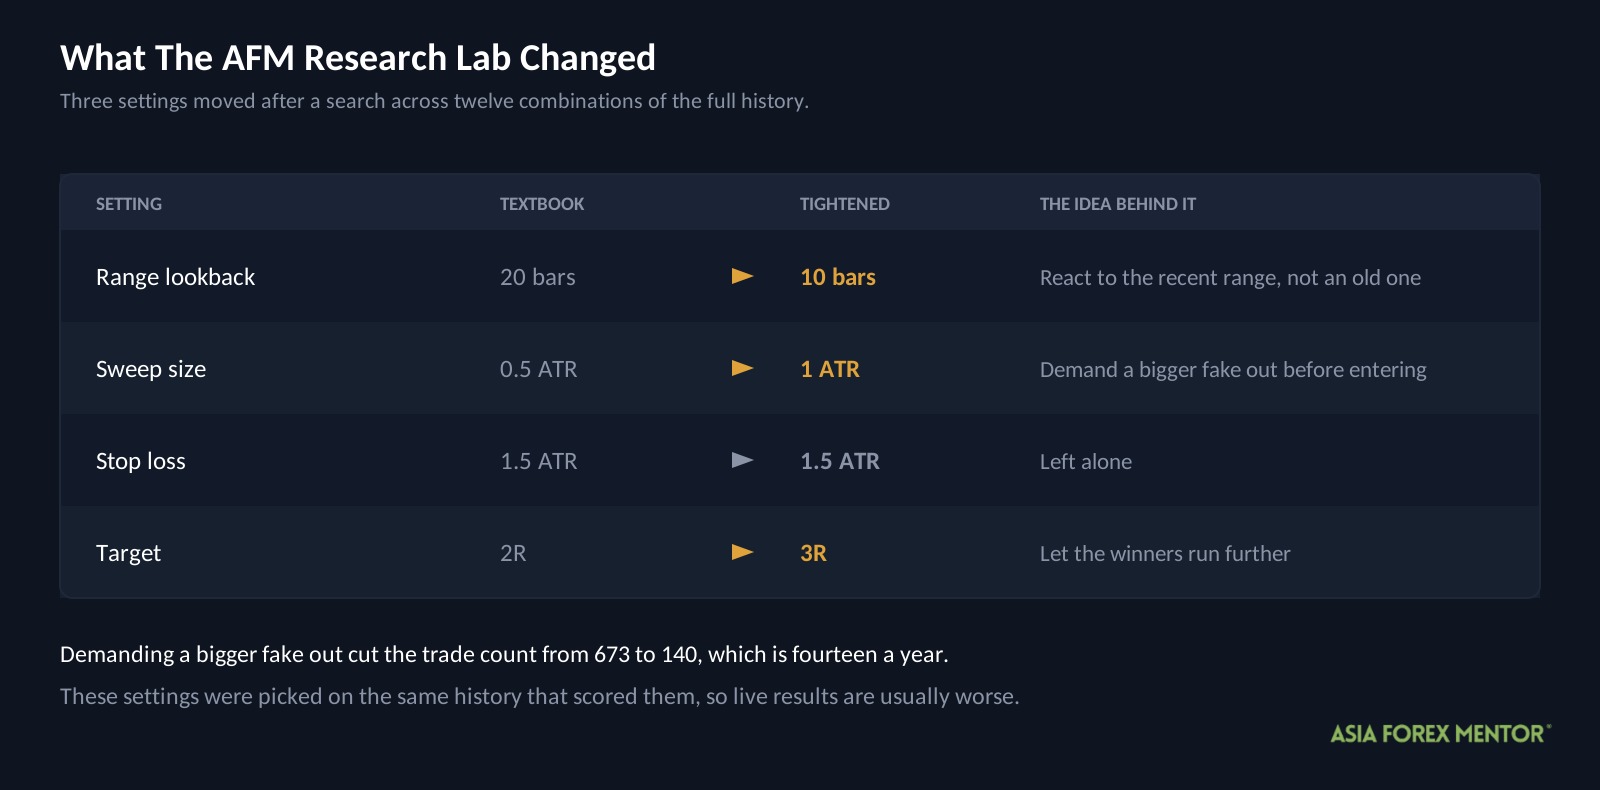
The textbook version made money with a thin margin, so the question was whether a stricter filter could widen it. The AFM Research Lab tested 12 combinations and kept the one that scored highest.
| Setting | Textbook | Tightened | The idea behind it |
|---|---|---|---|
| Range lookback | 20 bars | 10 bars | React to the recent range, not an old one |
| Sweep size | 0.5 ATR | 1 ATR | Demand a bigger fake out before entering |
| Stop loss | 1.5 ATR | 1.5 ATR | Unchanged |
| Target | 2R | 3R | Let the winners run further |
Each change has a sensible story attached. The honest reason all three were kept is that they scored best on the very data they were then judged against.
That has a name. In sample optimization means the settings were tuned on the same history used to test them, so the test already knew the answers, and live results are almost always worse.
This matters more here than in the other tests we have run. The textbook result was not tuned at all, so it is the number you should weigh most heavily.
Did The New Settings Work?
They made the ride far smoother. They did not make more money.
| Metric | Textbook | Tightened |
|---|---|---|
| Trades | 673 | 140 |
| Win rate | 45% | 56% |
| Expectancy | +0.06R | +0.13R |
| Profit factor | 1.11 | 1.32 |
| Yearly growth rate | 3.3% | 1.7% |
| Max drawdown | 25.0% | 8.1% |
| Ending balance from $10,000 | $14,027 | $11,924 |
Every quality measure improved. The win rate climbed eleven points, expectancy more than doubled, and the worst fall dropped from 25 percent to 8.1 percent.
The account still grew more slowly, and the reason is simple arithmetic. Demanding a 1 ATR sweep cut the trade count from 673 to 140, which is fourteen trades a year, so a better edge applied far less often produces less money.
At its lowest the tightened account was worth about $9,984, which is barely below the starting balance. That is a very different experience from watching a quarter of your account disappear.
This is the trade off the table is really showing. You can have the higher return with the 25 percent fall, or the gentler ride with roughly half the growth, and the data does not tell you which one suits you.
Did The Result Hold In Every Time Period?
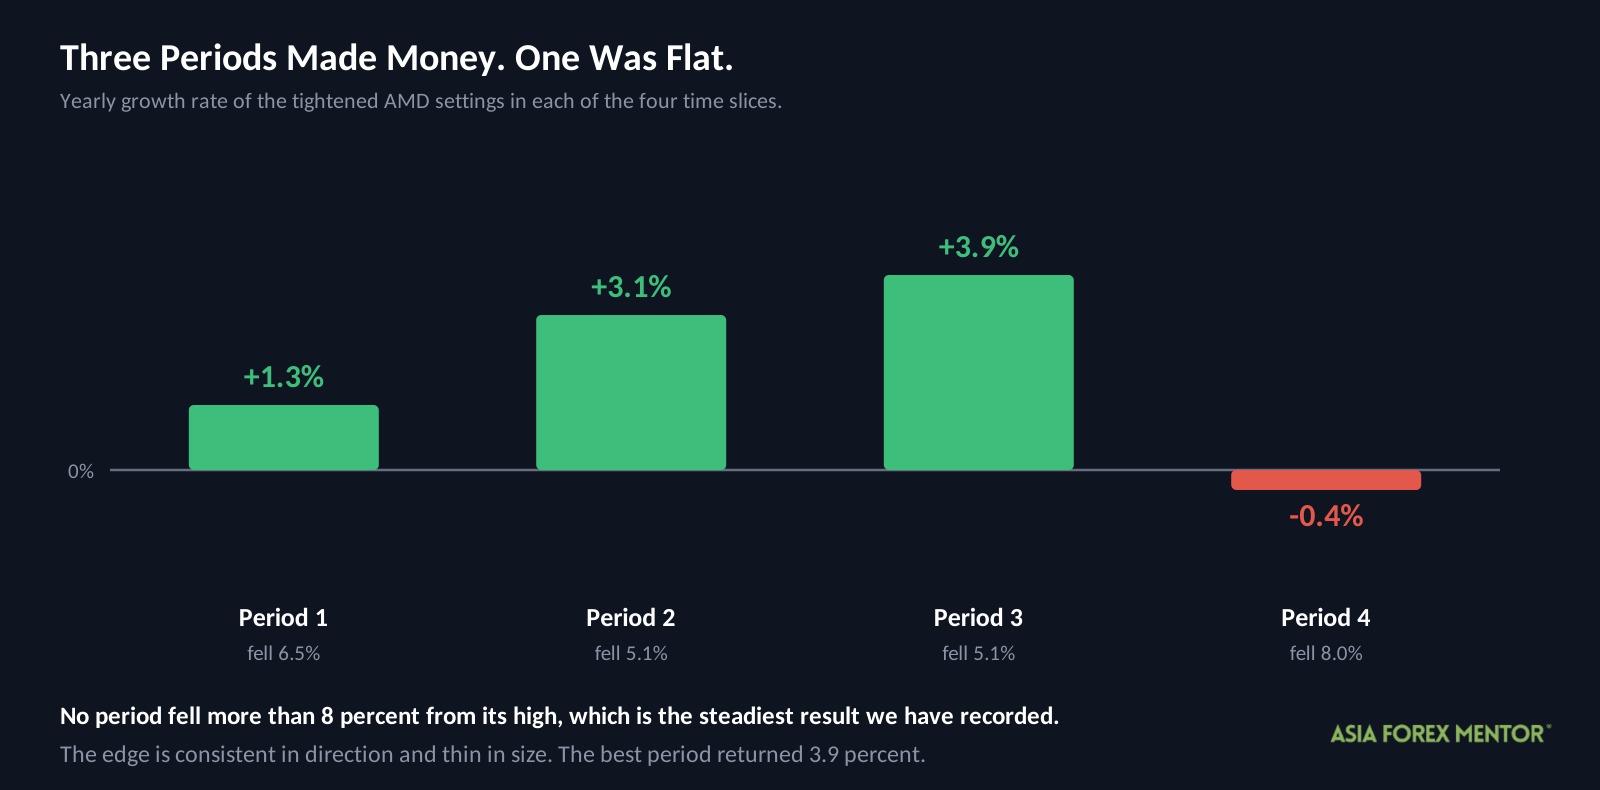
A single ten year number can hide a lot. A strategy might have made all its money in one unusual stretch and lost steadily everywhere else.
To check for that, the AFM Research Lab split the decade into four periods and scored the tightened rules separately in each. This is called walk forward testing, and it is the difference between a student’s year end average and their report card term by term.
| Period | Yearly growth rate | Max drawdown |
|---|---|---|
| 1 | +1.3% | 6.5% |
| 2 | +3.1% | 5.1% |
| 3 | +3.9% | 5.1% |
| 4 | -0.4% | 8.0% |
Three periods made money and one lost 0.4 percent, which is close enough to flat to call it a wash. That is the most consistent result we have recorded, and it is still not a strong one.
The drawdown column is the genuinely impressive part. No period fell more than 8 percent from its high, and that steadiness across four separate stretches of market history is harder to fake than a good return.
What stops this being conclusive is the size of the edge rather than its direction. A best period of 3.9 percent leaves very little room between a working strategy and a flat one, and a slightly wider spread or a slower fill would eat a meaningful share of it.
What Does A Winning Trade Look Like?
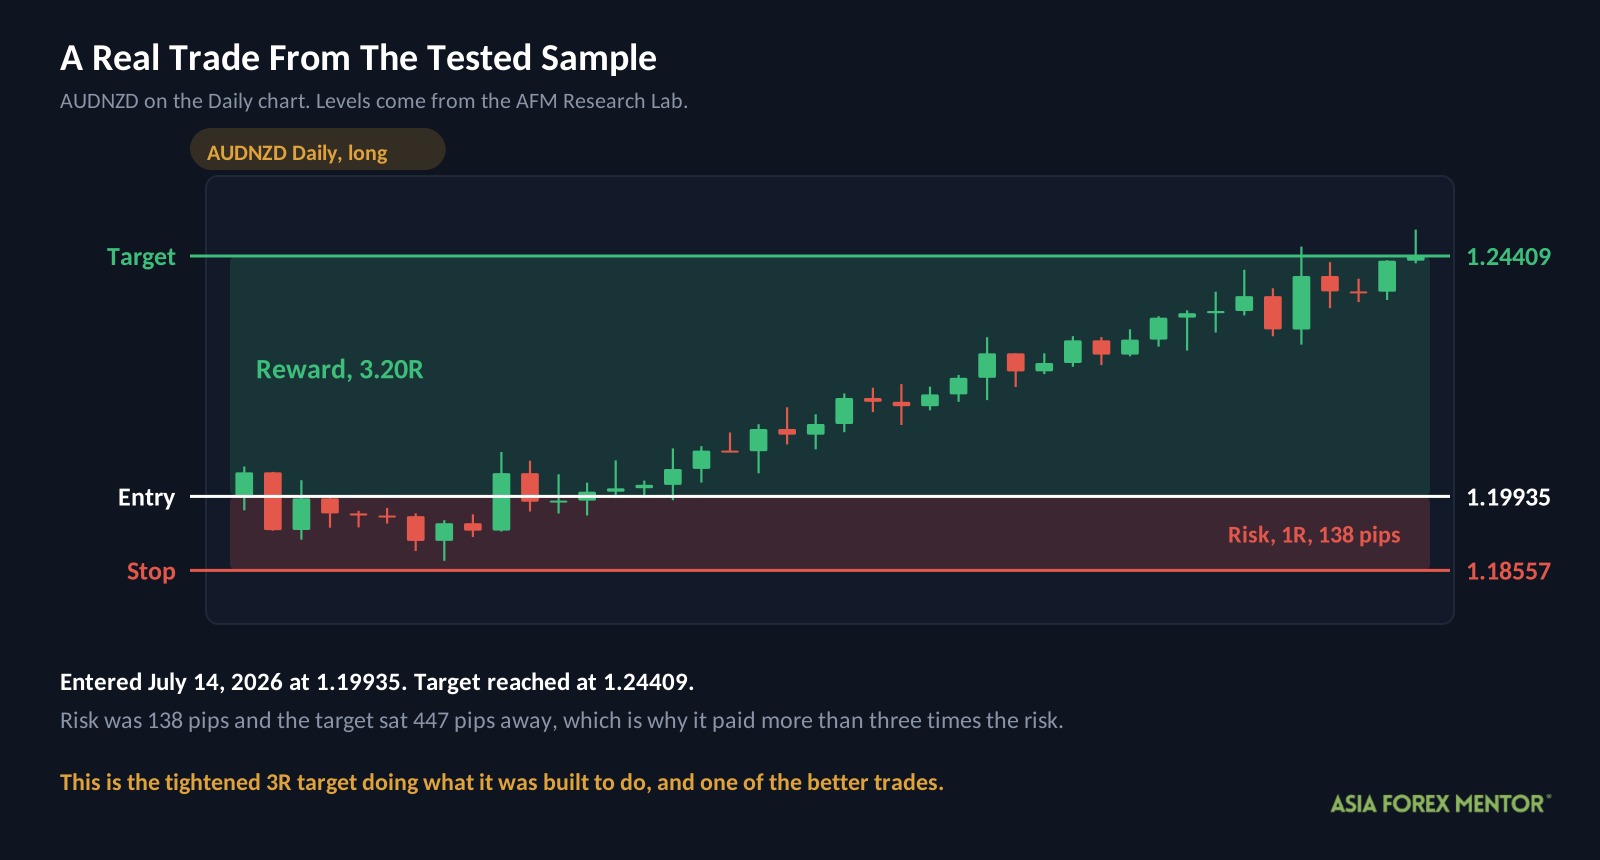
This is a real trade from the tested sample, and it is one of the better ones rather than an average week.
| Detail | Value |
|---|---|
| Pair and chart | AUDNZD, Daily |
| Direction | Long, meaning a buy |
| Entry | July 14, 2026 at 1.19935 |
| Stop | 1.18557 |
| Target | 1.24409 |
| Result | +3.20R |
The risk on this trade was 138 pips, the distance from 1.19935 down to the stop at 1.18557. The target sat 447 pips away, which is why reaching it paid more than three times what the trade risked.
This is the tightened version doing exactly what it was built to do. The 3R target is what turns a 56 percent win rate into a real edge, because at that win rate you only need roughly one trade in four to pay to break even.
Why This One Worked When Others Did Not
Three previous tests all failed, and comparing them points at one likely reason.
Mean reversion took 2,205 trades in a decade and market structure took 1,402. AMD took 673, and the tightened version took 140. It is by far the most selective of the four.
Selectivity is not magic, but it does change what you are betting on. A band touch or a structure break happens often enough that most of them are noise, while a range, a failed push beyond it and a reversal is a sequence that has to complete before anything triggers.
The other difference is what the trade is betting against. Reading market structure or an indicator means betting that a move continues, while AMD bets that an obvious move was a trap. Those are not the same bet, and over this decade only one of them paid.
How Should You Practice The AMD Strategy?
This is the first setup I would say is worth practising rather than only studying. That is not the same as trading it tomorrow.
- Open a Daily chart on one pair and mark the high and low of the last 20 bars.
- Scroll forward and find every point where price pushed beyond that range by at least half the daily ATR.
- For each one, record whether price closed back inside the range within the next few bars.
- Where it did, write down the entry, a 1.5 ATR stop and a 2R target.
- Walk the chart forward one bar at a time and record whether the stop or the target came first.
- Do at least 30 of them by hand before you trust any automated version.
- Repeat the exercise with a 10 bar range and a 1 ATR sweep, then compare the two sets.
- Split your results into four date ranges and check whether each one made money on its own.
Sound risk management is what makes that last stage survivable. A strategy with a 25 percent drawdown in its history will hand you a losing run at some point, and position size is what decides whether it is uncomfortable or fatal.
Is The AMD Strategy Worth Your Time?
As a system, this one earns a qualified yes, which is more than the previous three managed.
- The textbook rules turned $10,000 into $14,027 across 673 trades, untuned, with a 25 percent max drawdown.
- The tightened rules cut the worst fall to 8.1 percent and lifted the win rate to 56 percent, at the cost of growth.
- Three of four periods made money, and no period fell more than 8 percent from its high.
What holds it back is the size of the return rather than any flaw in the logic. A 3.3 percent yearly growth rate is a real edge and a small one, and whether it justifies the drawdown depends on what else you could do with the money.
What I would take from this is that the sequence matters more than the level. Price reaching a level tells you very little, and price reaching a level, failing there and reversing tells you considerably more.
Also Read: ICT Order Block Strategy Proven Across 5,242 Real Trades
Frequently Asked Questions
What Does AMD Stand For In Trading?
Accumulation, manipulation and distribution. It describes a three stage sequence where price ranges quietly, pushes out of that range to trigger stop losses, then reverses and runs the other way.
Does The AMD Strategy Actually Work?
In this test, yes. The AFM Research Lab ran it across 673 trades and ten years of Daily data and a $10,000 account finished at $14,027, with a worst fall of 25 percent along the way.
Why Did The Tightened Version Make Less Money?
Because it traded far less often. Demanding a larger fake out cut the trade count from 673 to 140, so a better edge applied fourteen times a year produces less growth than a thinner edge applied sixty times a year.
Is A 25 Percent Drawdown Acceptable?
It sits inside the 30 percent ceiling most traders work to, but not comfortably. An account down 25 percent needs a 33 percent gain to get back to even, and many people abandon a system before they reach that point.
What Timeframe Does AMD Work Best On?
This test used the Daily chart across 28 currency pairs from June 2016 to September 2026. Lower timeframes were not tested here, and a sequence that depends on stop losses clustering at an obvious level may behave differently when the level is less widely watched.
What Is A Liquidity Sweep?
It is the manipulation stage described above. Price pushes past an obvious high or low, triggers the stop losses resting there, and then reverses, which is the move AMD is built to catch.
Why Does Walk Forward Testing Matter?
Because an average can hide everything. Splitting ten years into four periods showed that three made money and one lost 0.4 percent, which tells you the edge is consistent in direction but thin in size.