Learn To Trade Forex • Best Forex Trading Course • AsiaForexMentor

How to Trade the Flat Top Pattern

Written by

Ezekiel Chew

Updated on

January 20, 2025

i

How to Trade the Flat Top Pattern

Written by:

Ezekiel Chew

Last updated on:

January 20, 2025

Trading in the financial market requires a deep understanding of various chart patterns and technical analysis tools. One such pattern that traders often rely on is the Flat Top Pattern. Recognizing and effectively trading this pattern can lead to profitable trades and strong momentum in the market. This article will guide you through understanding, spotting, and trading the Flat Top Pattern, along with tips on managing risks and identifying breakout signals.

What is the Flat Top Pattern?
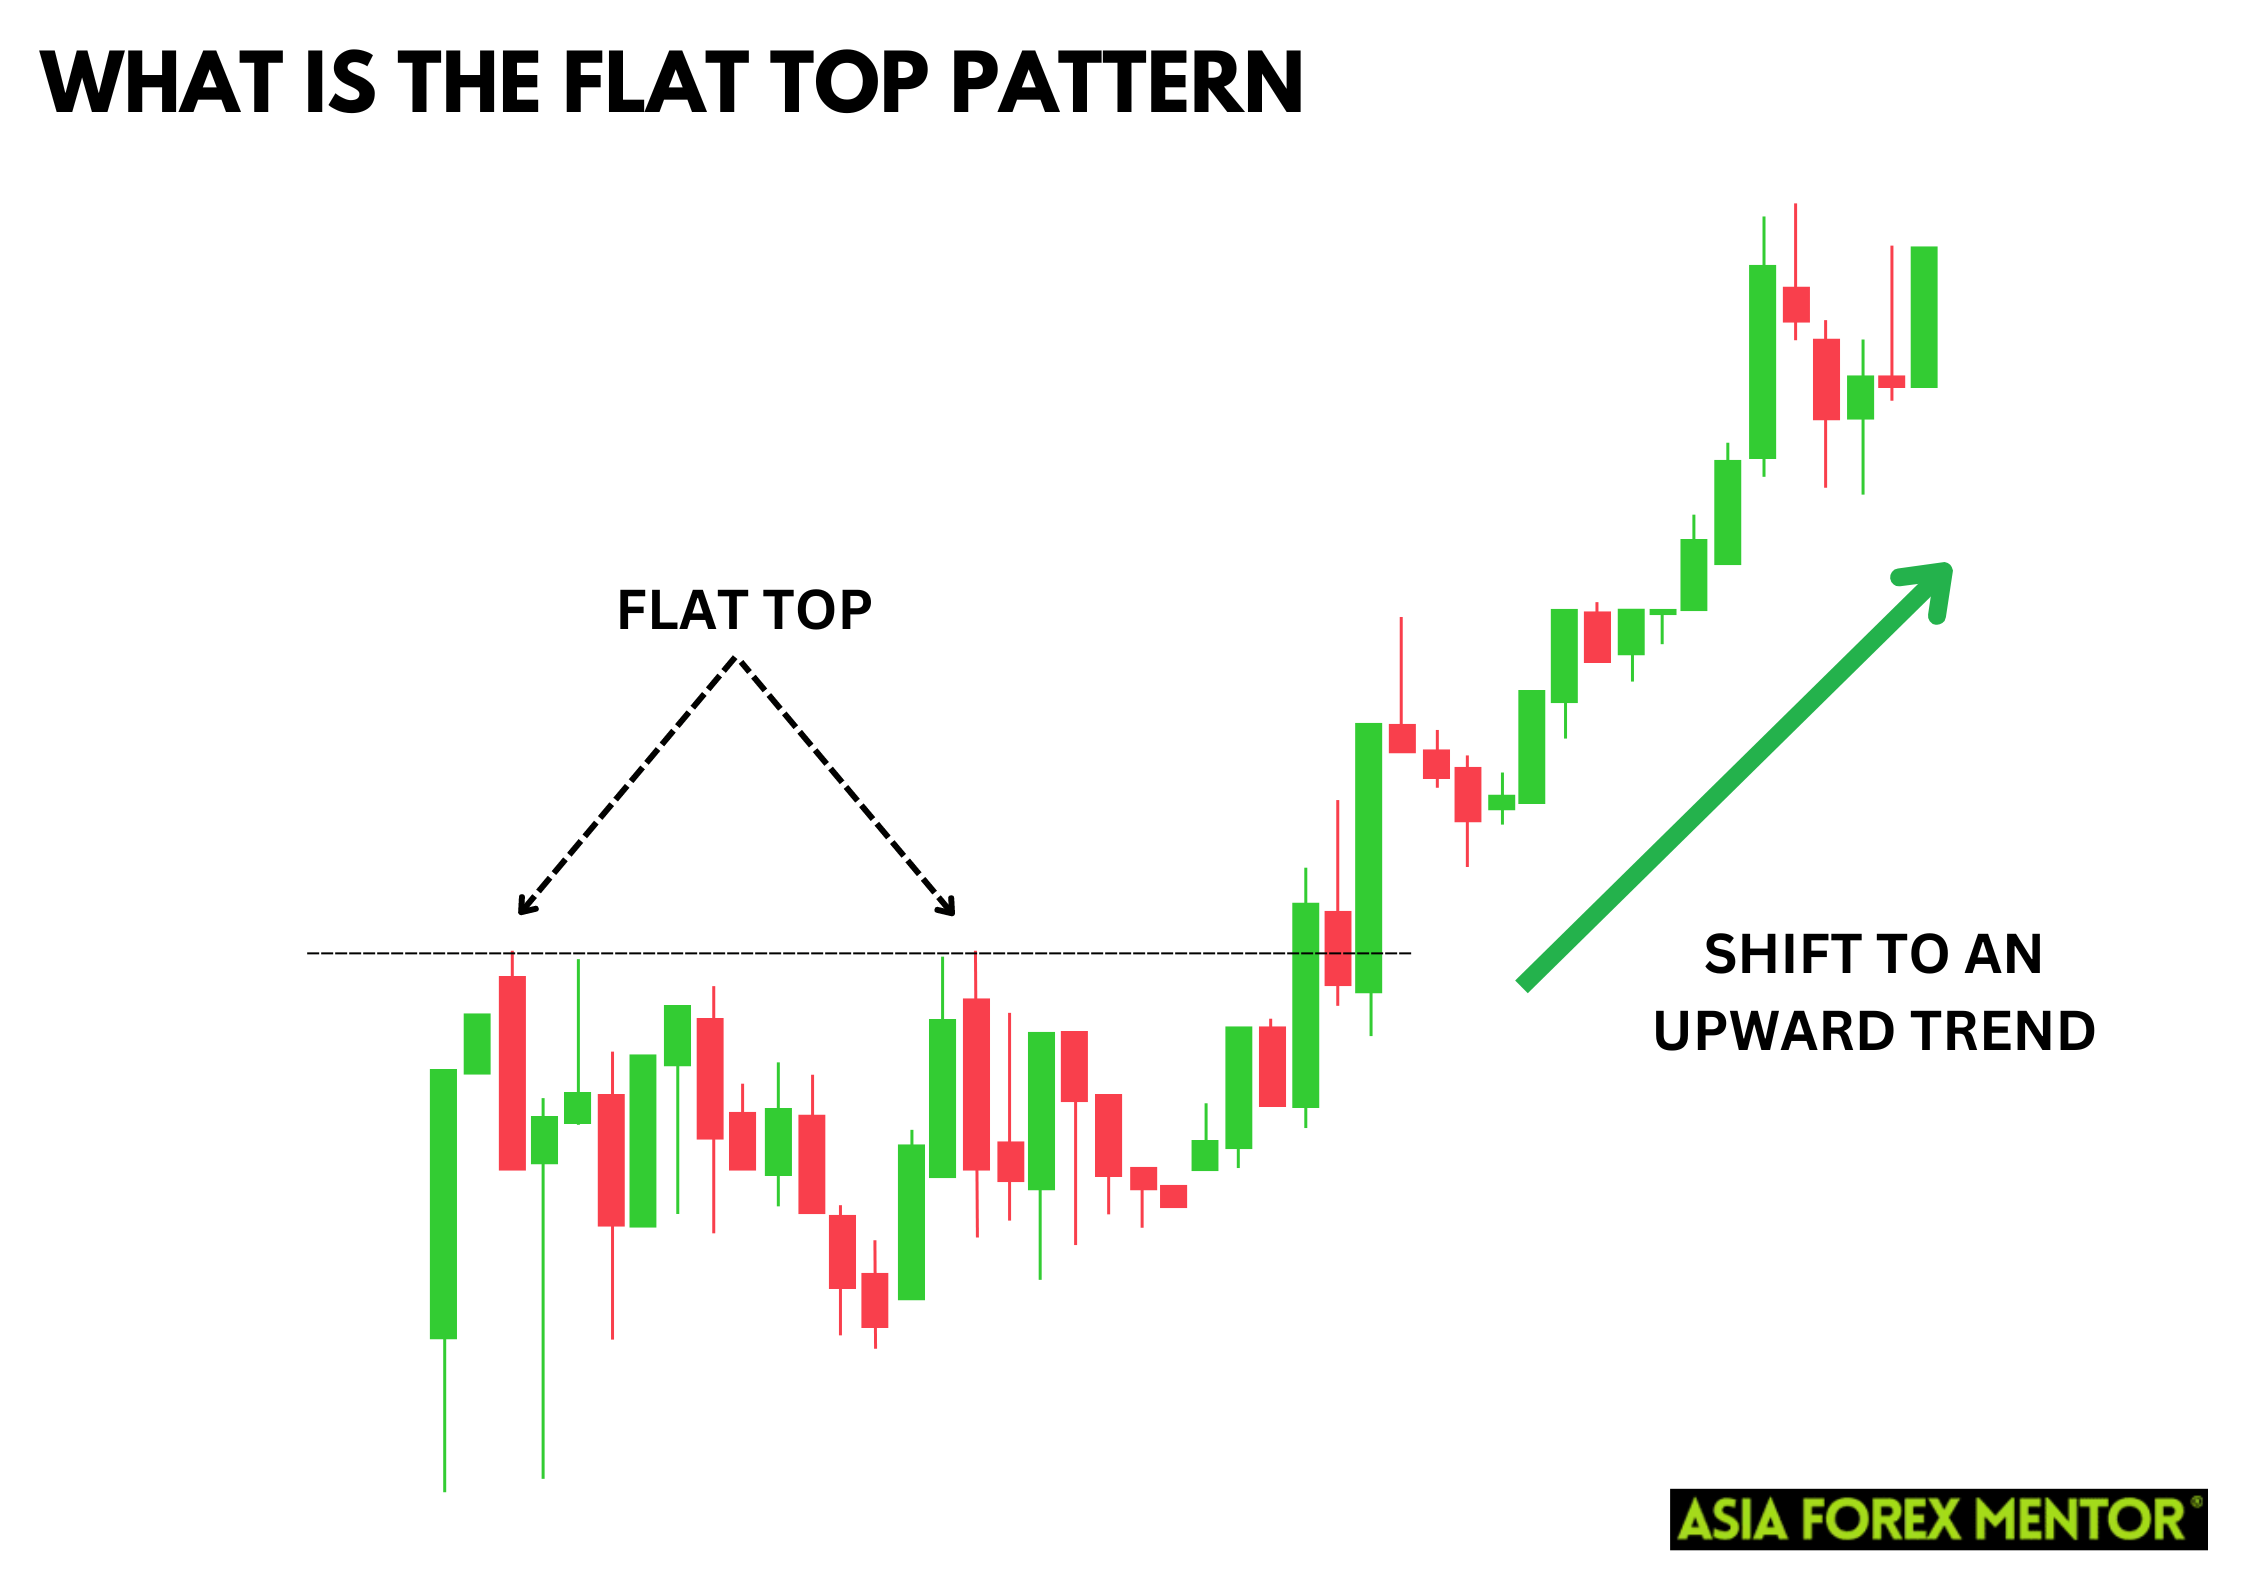
The Flat Top Pattern is a bullish continuation pattern that occurs during an upward movement. It is characterized by a series of price movements that reach the same resistance level, creating a flat top on the price chart. This pattern indicates that selling pressure is not strong enough to push the price lower, suggesting an upcoming breakout.

The Flat Top Pattern moves sideways within a narrow range and can signal a shift in market sentiment, indicating the beginning of an upward trend. This pattern is formed when two or more candlesticks share the same highest point, regardless of their color, length, or whether they have shadows in their real bodies.

Also Read: Mastering Japanese Candlestick Patterns

How to Spot the Flat Top Pattern
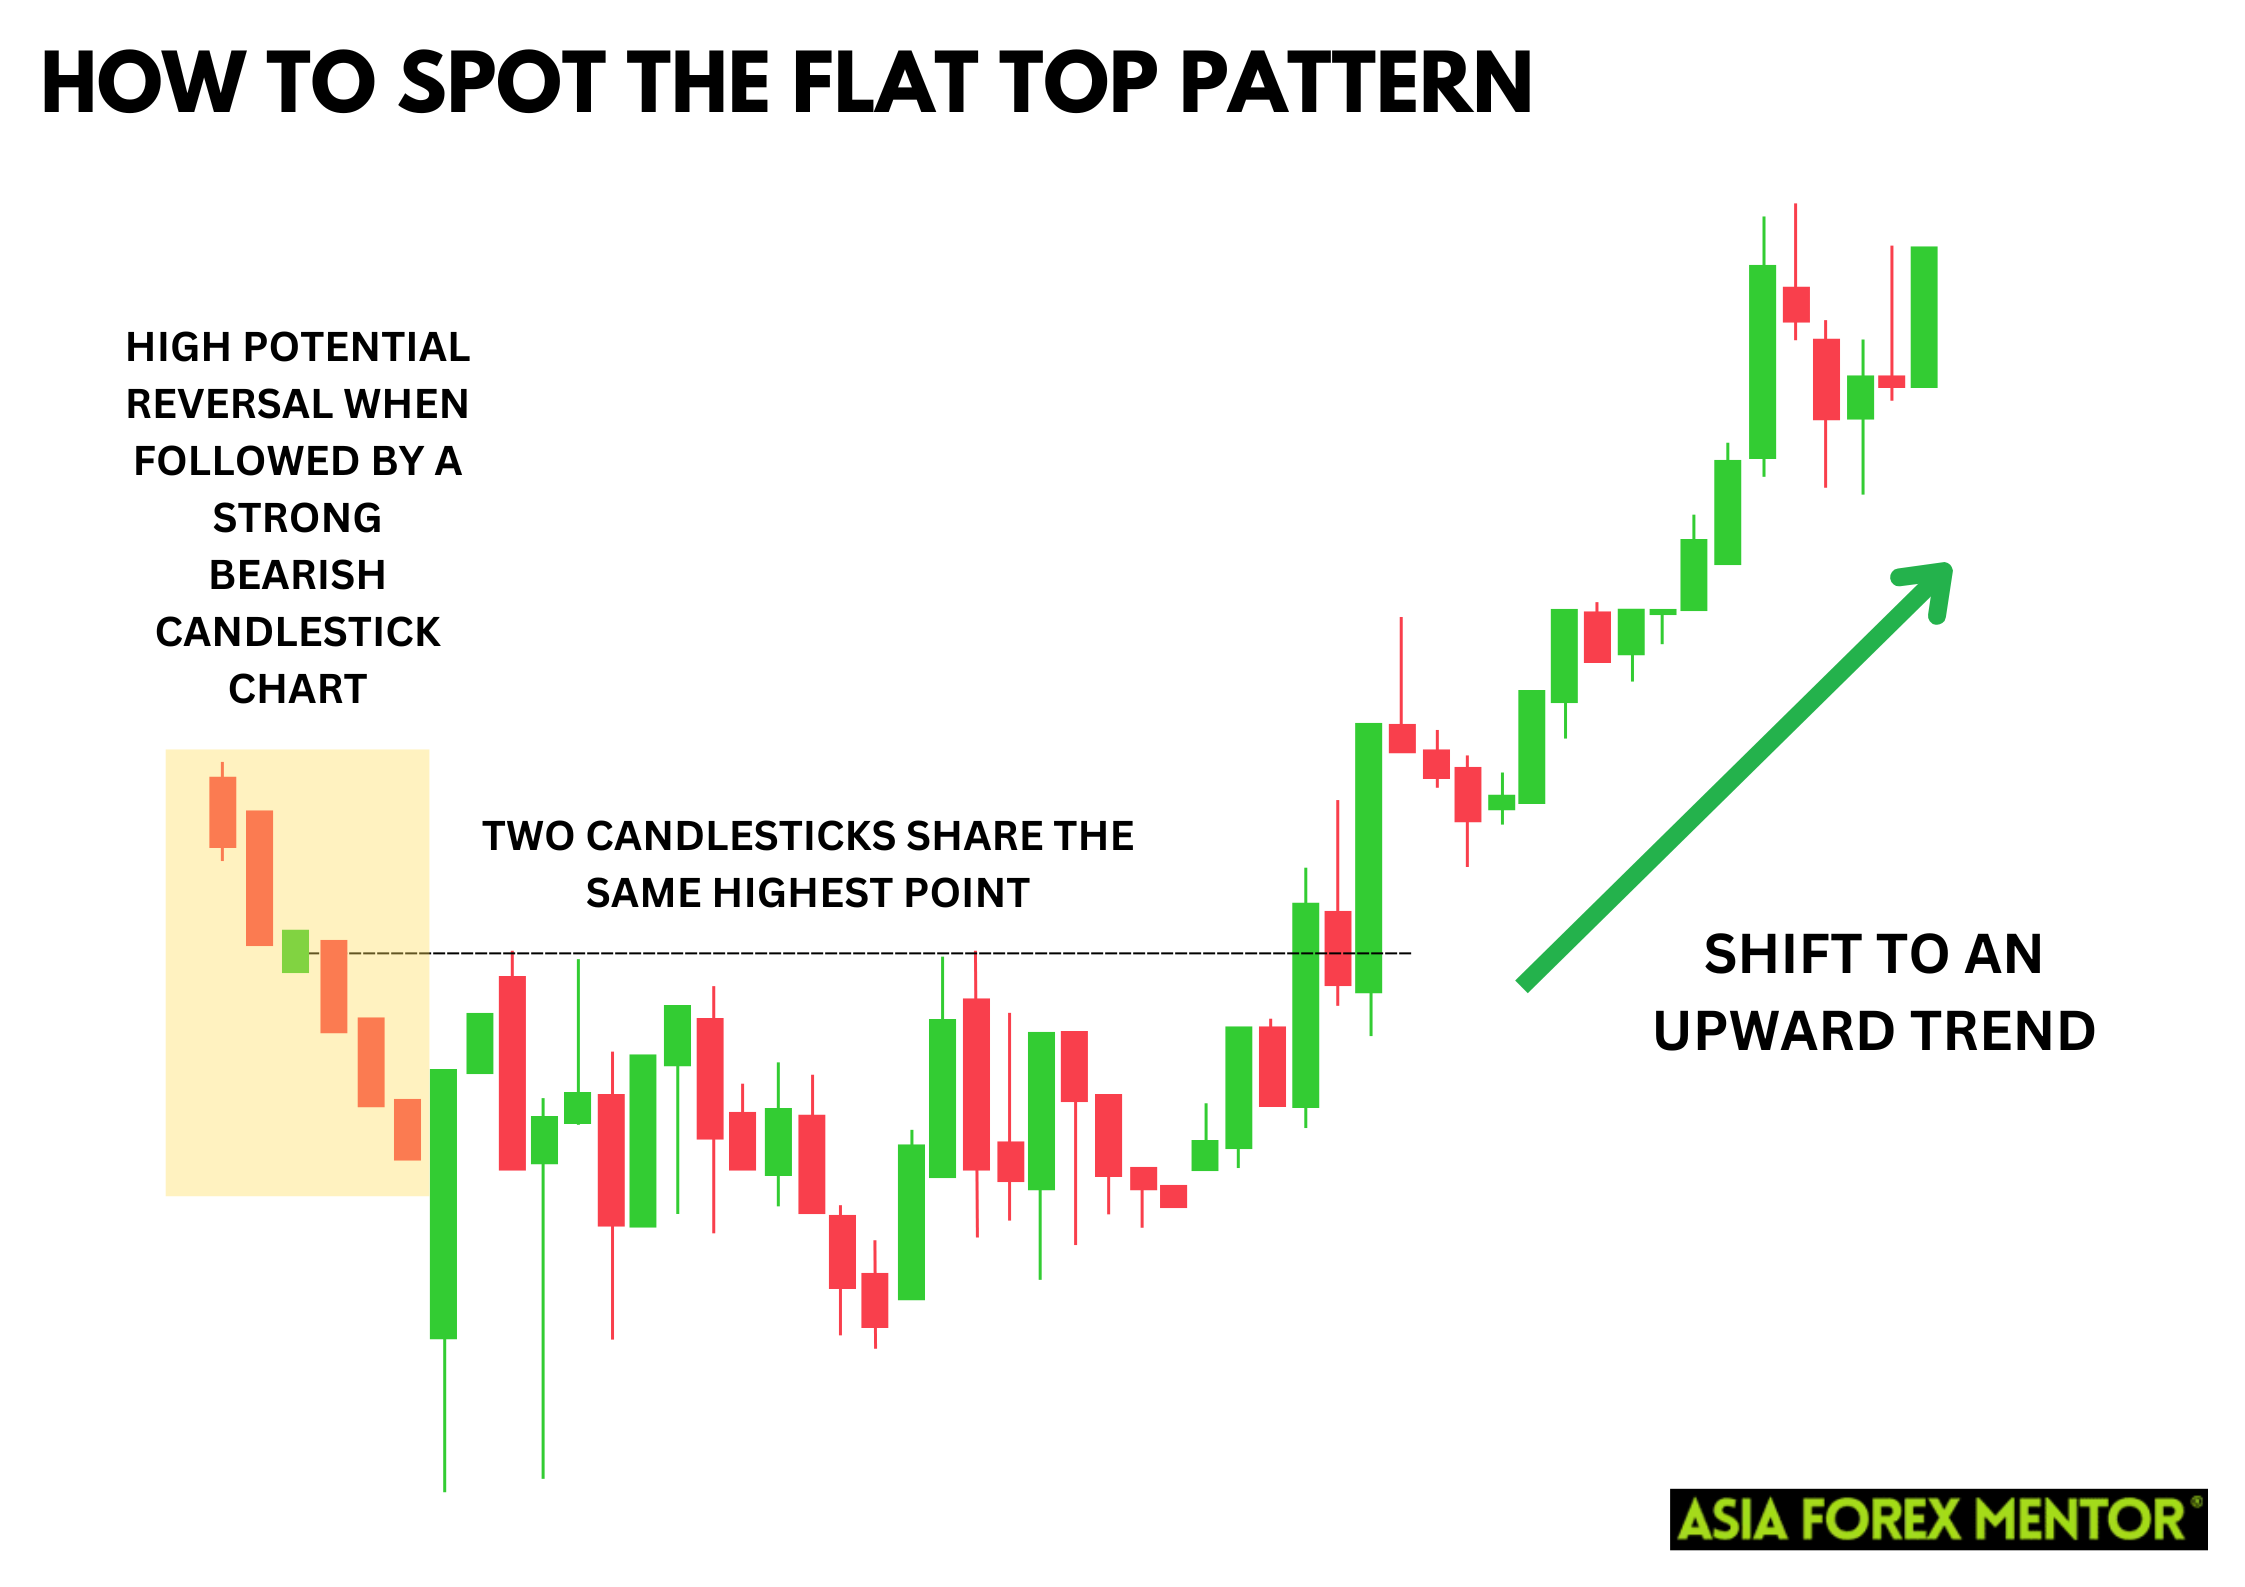
 

Spotting the Flat Top Pattern involves looking for a price chart where the price repeatedly hits a resistance level but fails to break above it. This creates a flat, horizontal line on the top of the price movements. The Flat Top Breakout Pattern is confirmed when the price breaks above this resistance level, signaling a potential for further upward movement.

Key characteristics of the Flat Top Pattern include:

  • Multiple peaks at the same resistance level.
  • Consistent support levels creating a flat top.
  • Increasing volume as the price approaches the resistance level.
  • A potential reversal signaled when followed by a strongly bearish candlestick chart.

How to Trade the Flat Top Pattern

Entry Point
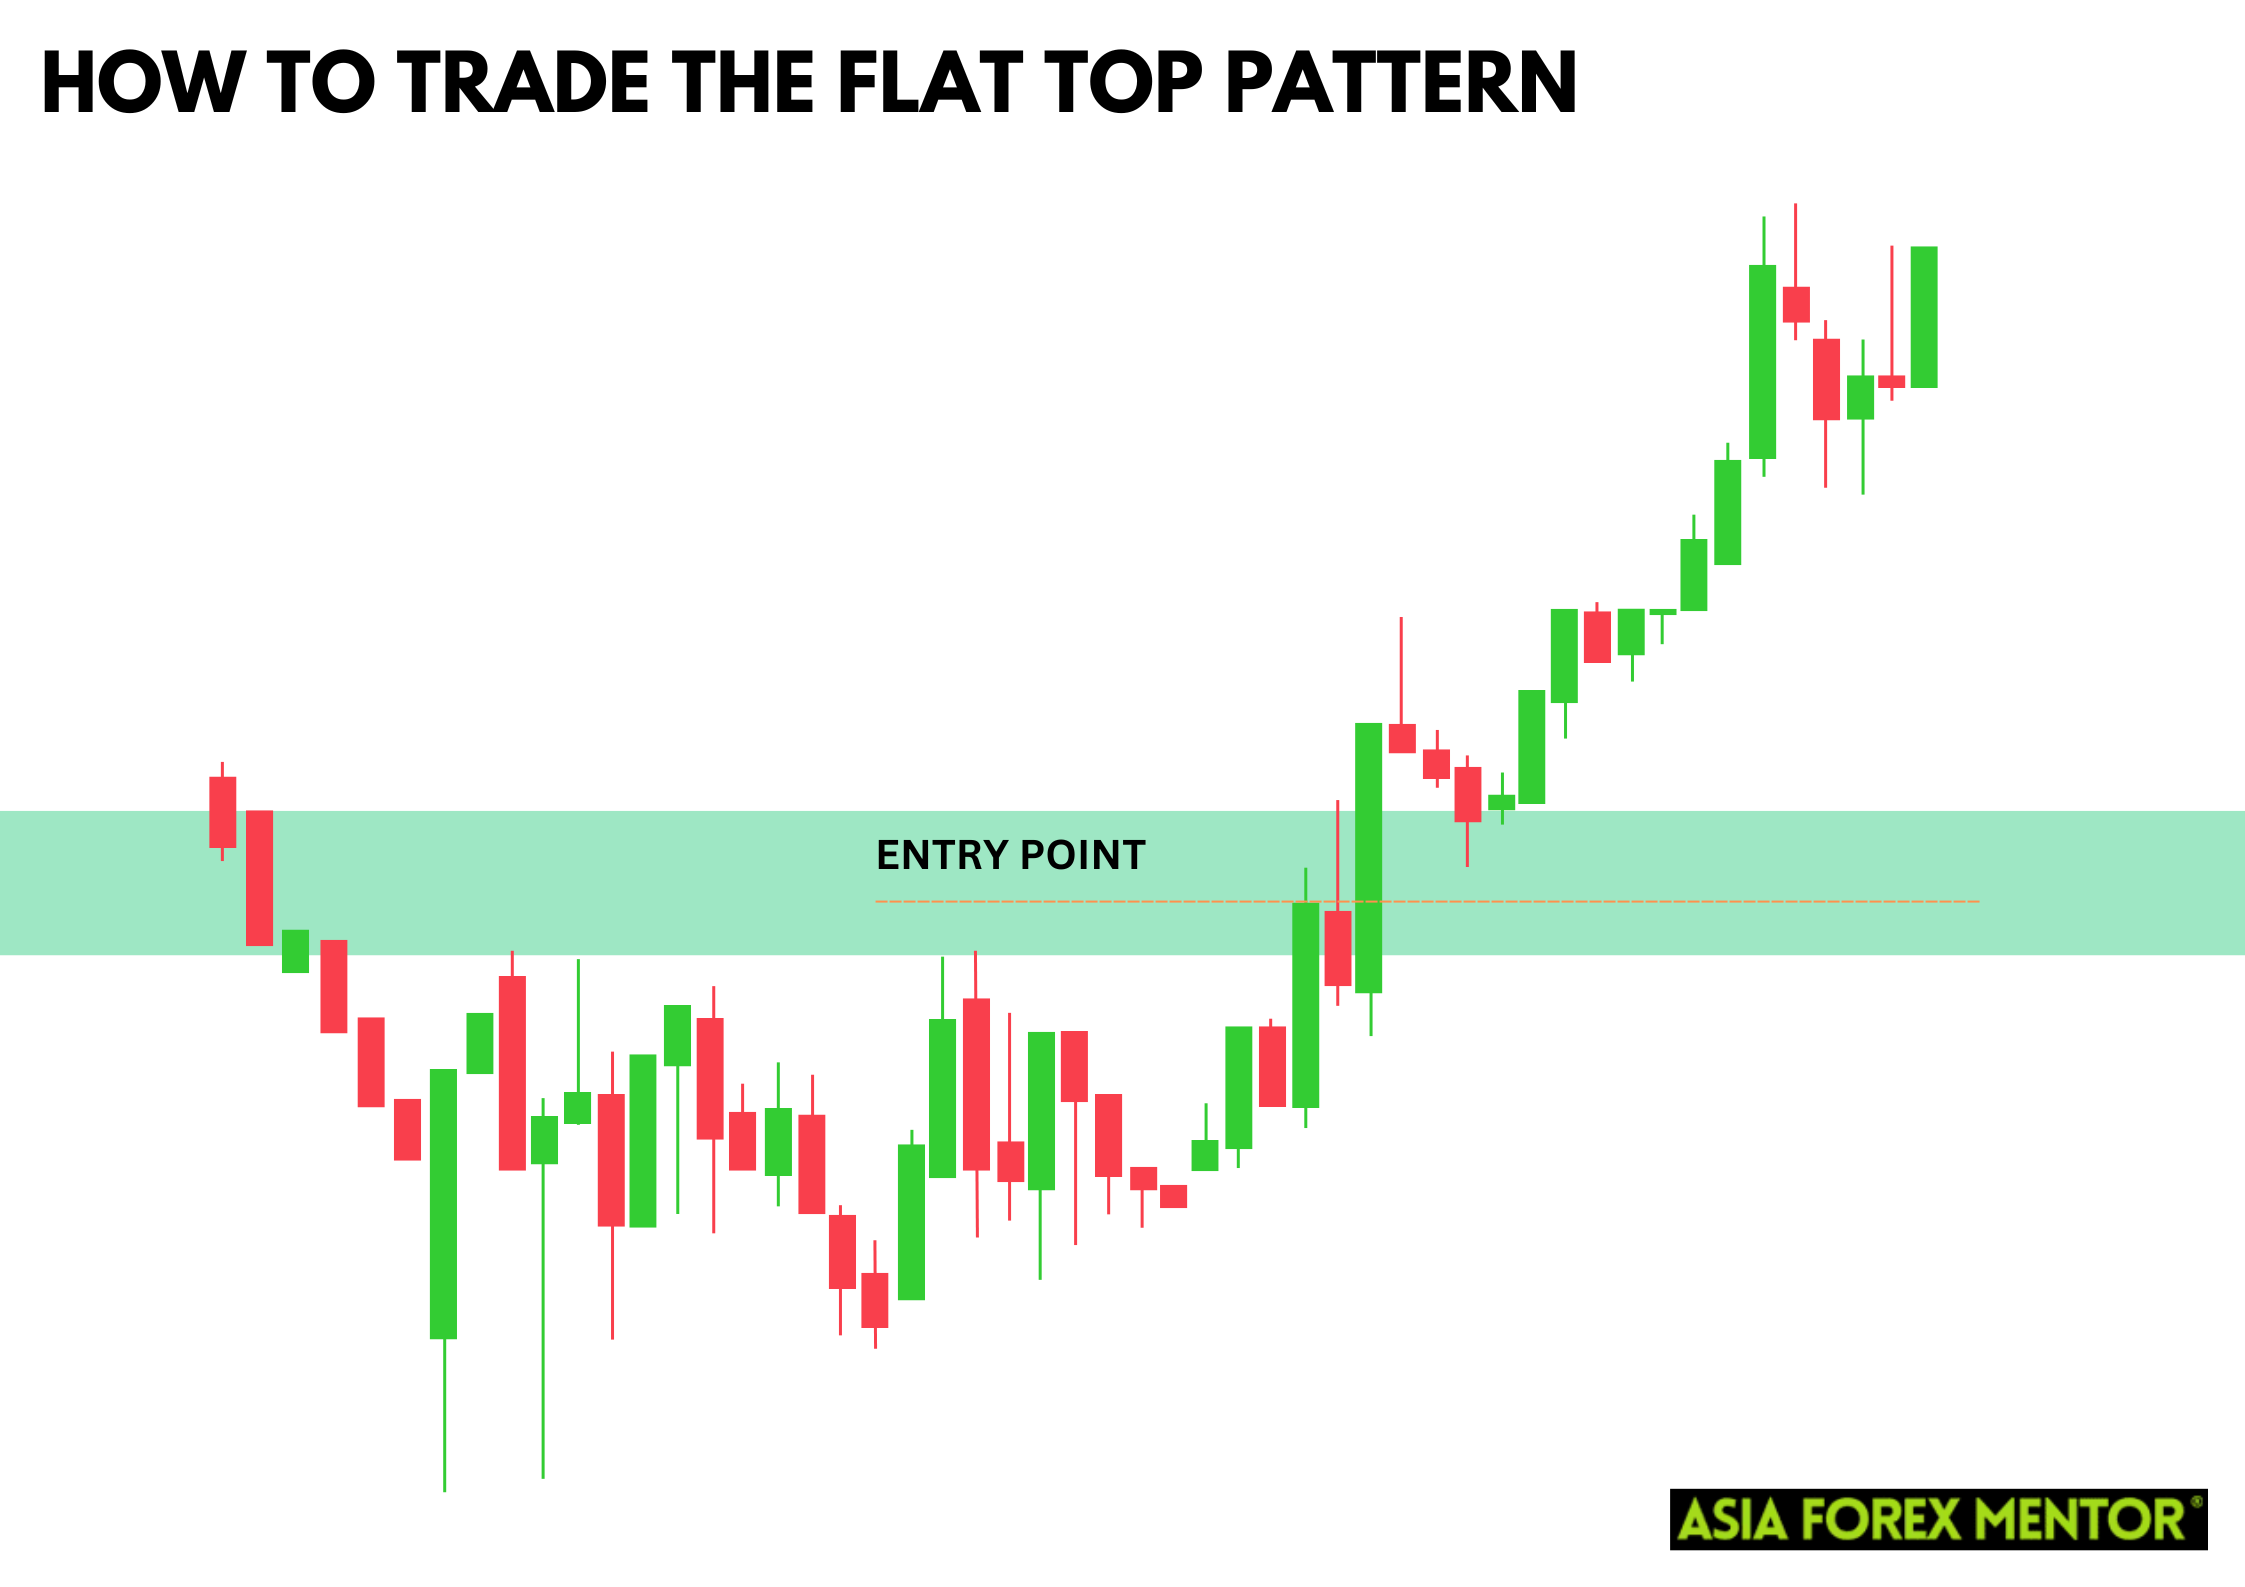
To successfully trade the Flat Top Pattern, the entry point is crucial. Traders should wait for a confirmed breakout above the resistance level. This breakout is often accompanied by a significant increase in volume, indicating strong buying interest and a bullish signal. According to trading experts, wait for the price to break and close above the candlestick highs and enter with a good bullish bar close.

Stop Loss
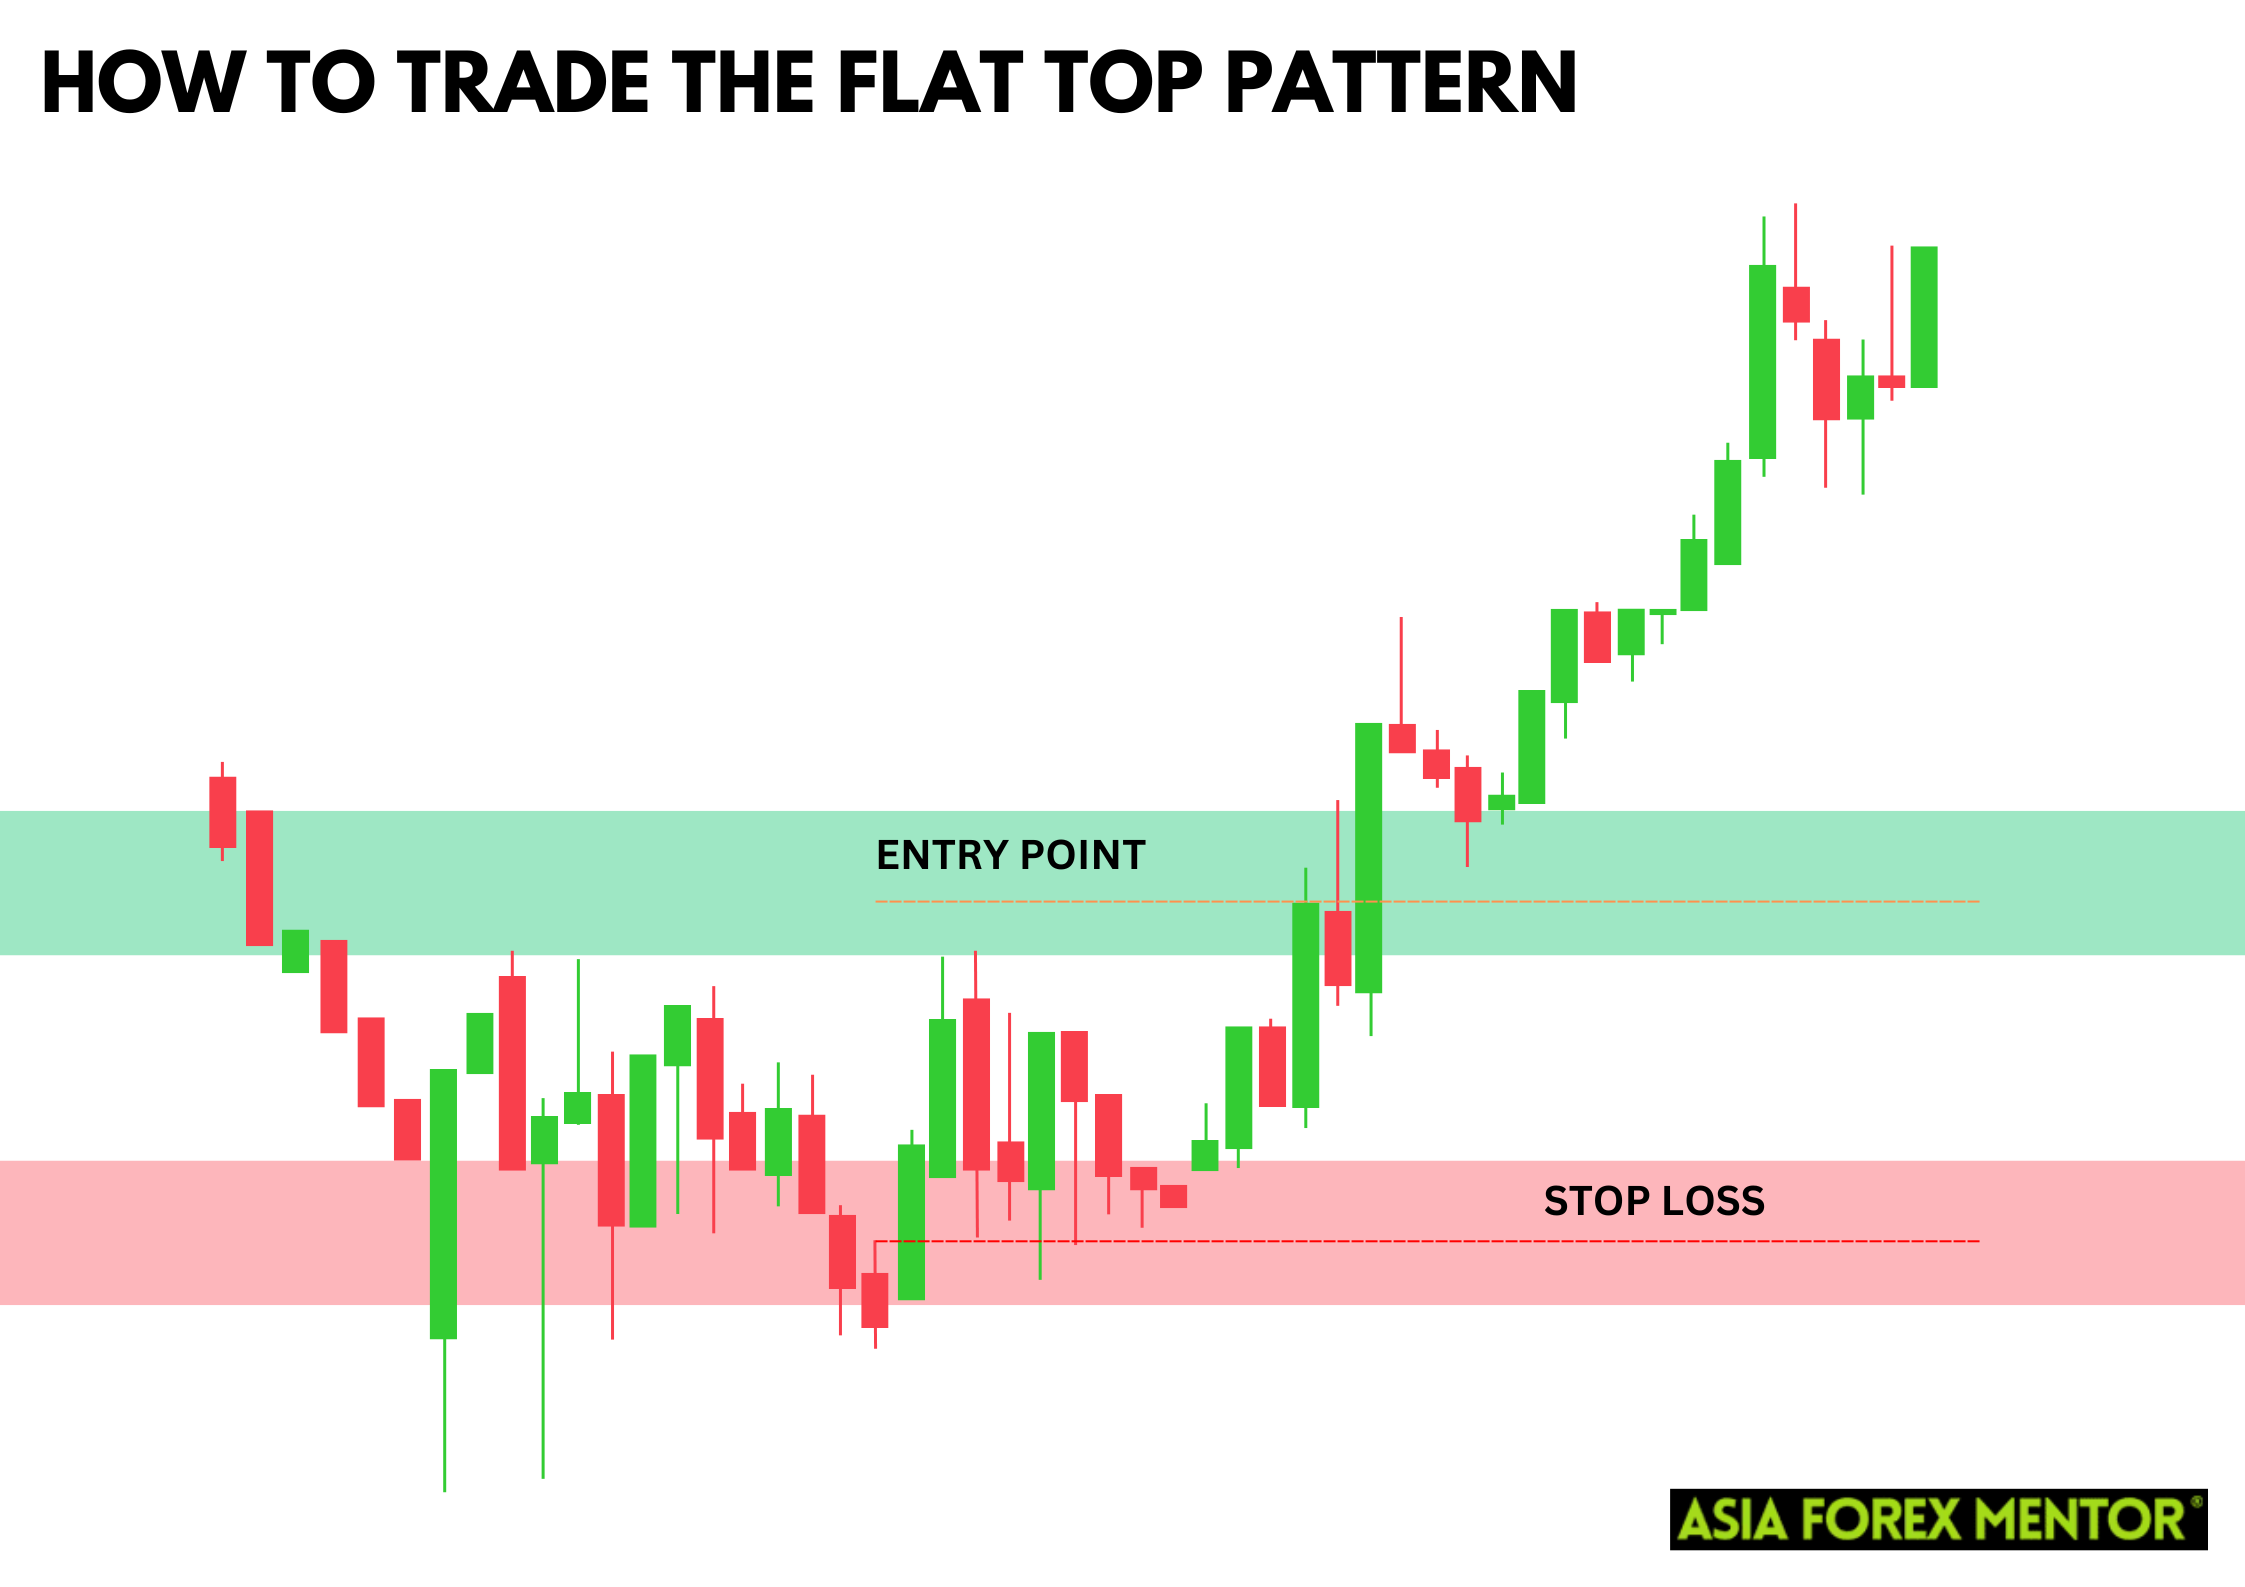
Implementing a proper risk management strategy is essential. Place a stop loss just below the most recent support level to minimize potential losses. This ensures that if the breakout turns out to be a false breakout, the losses are contained. Specifically, place the stop loss below the lows of the flat top candlestick.

Profit Target
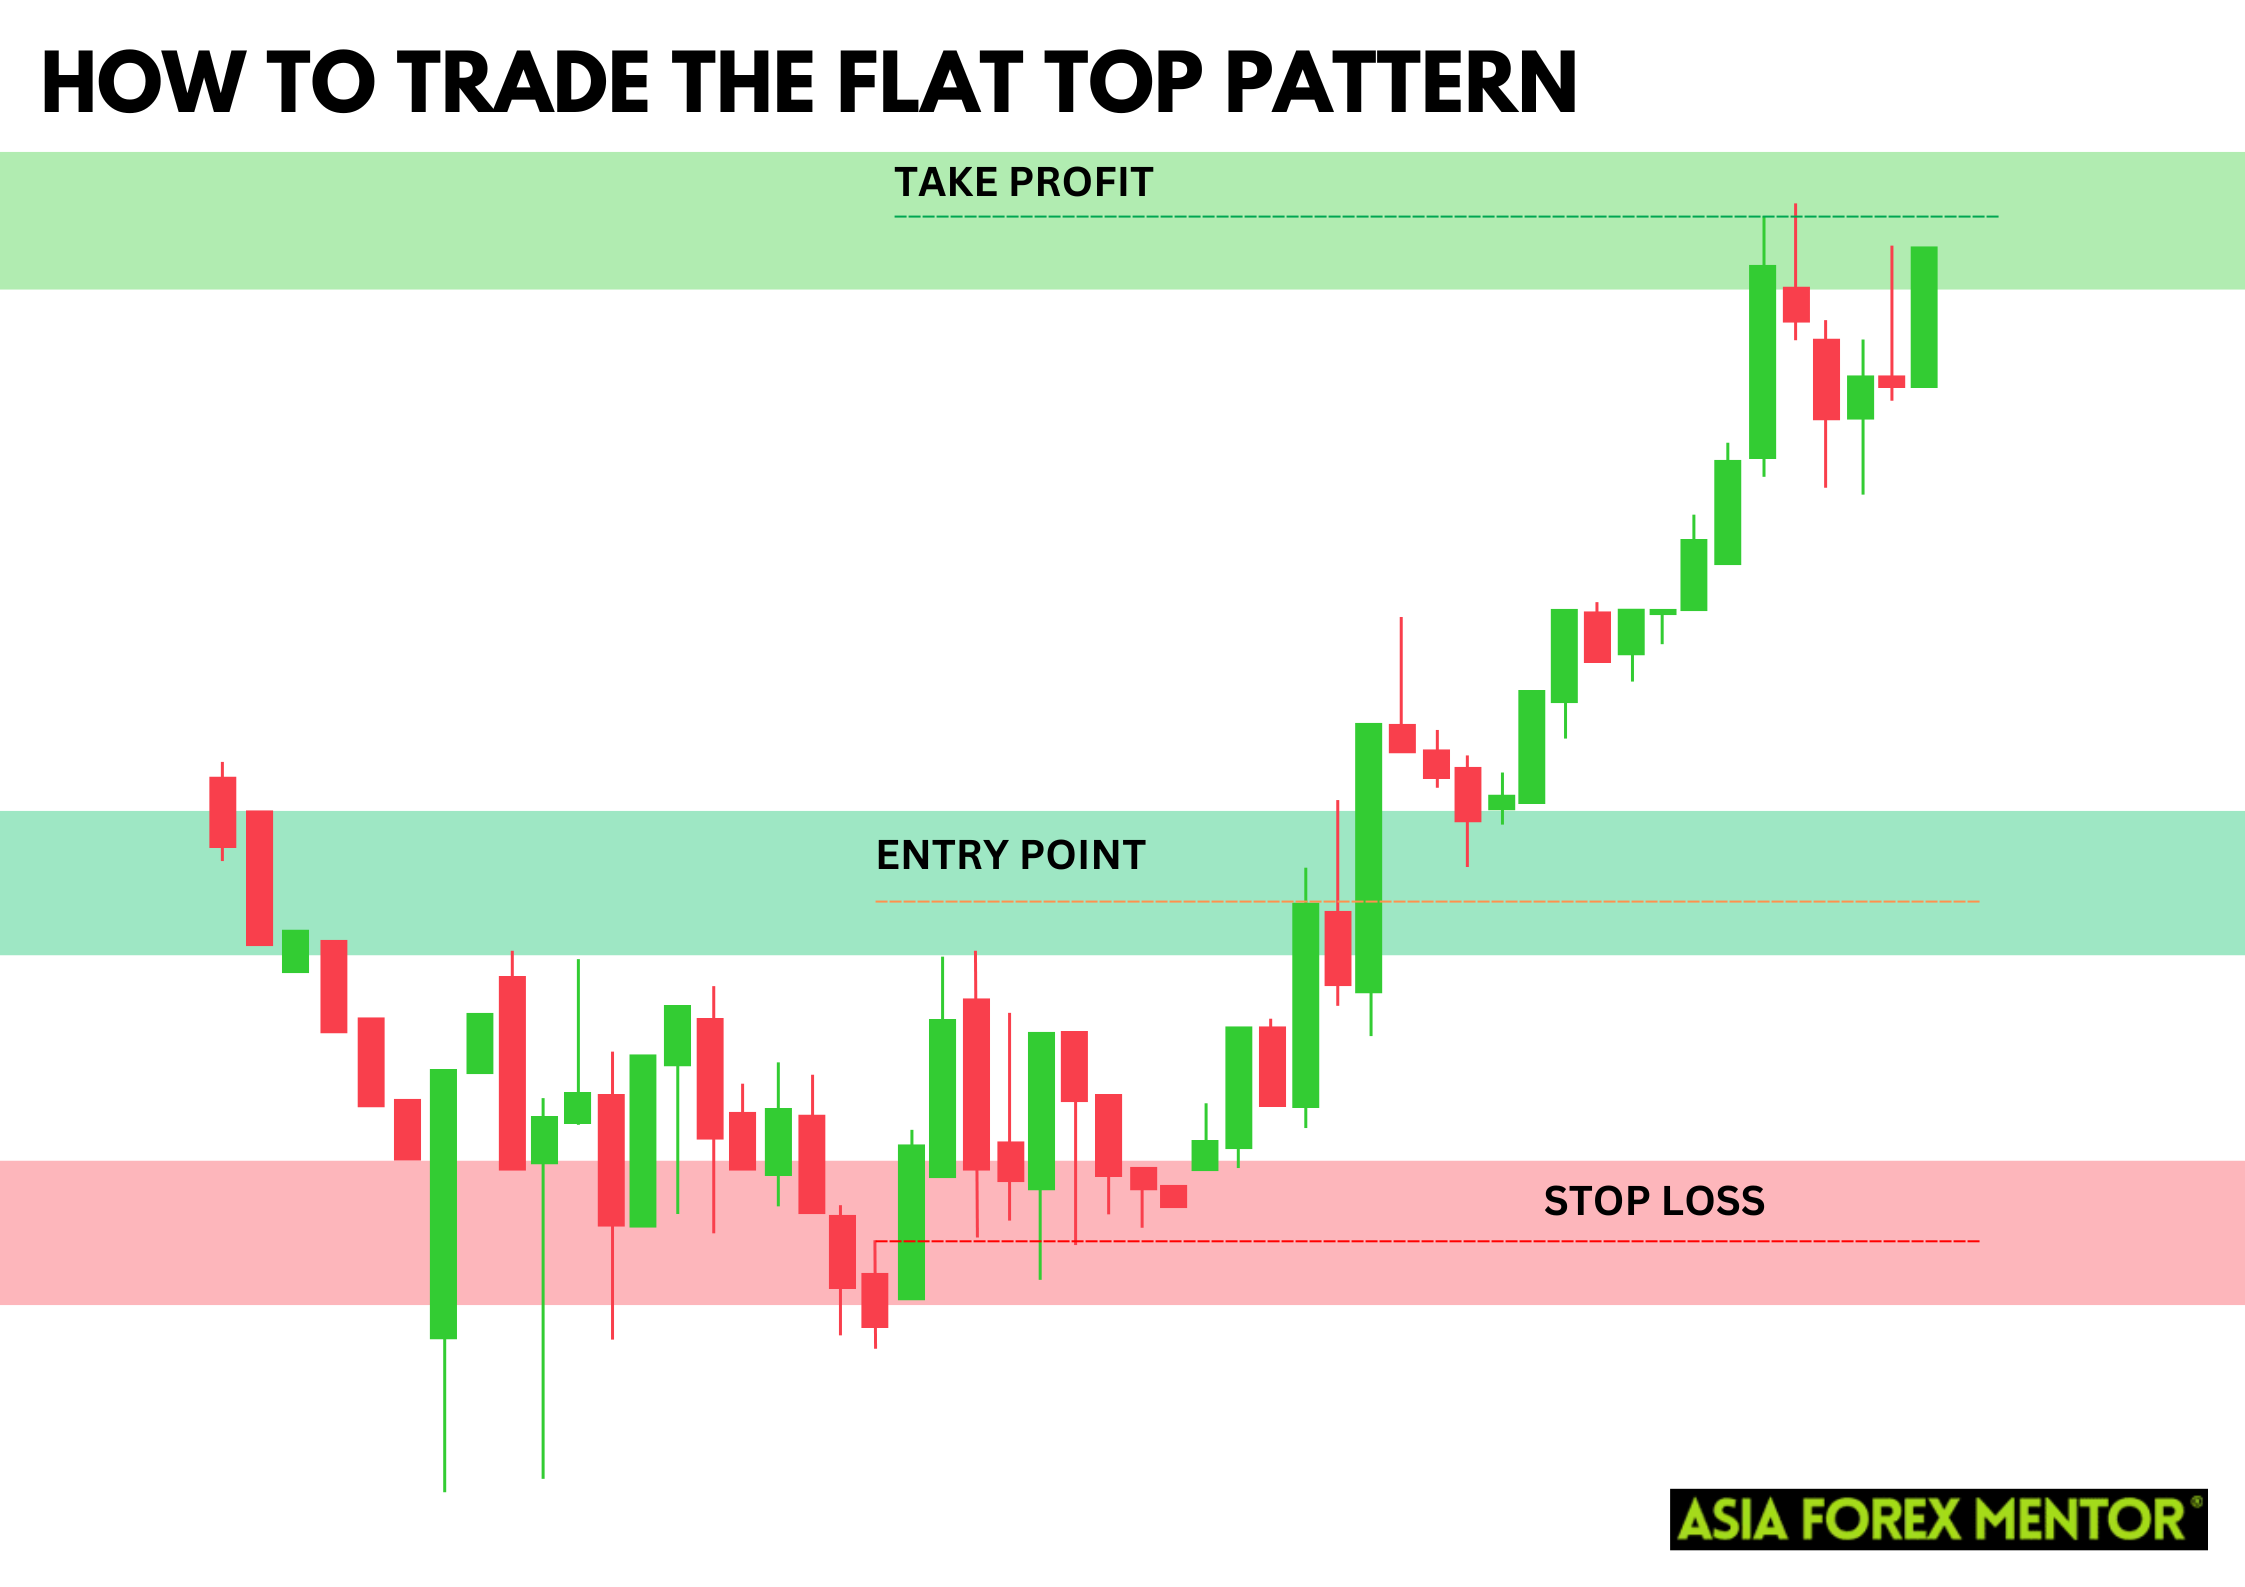
Setting a profit target helps in locking in profits. A common approach is to measure the height of the pattern and project it upwards from the breakout point. This gives a realistic target based on the previous price action. Use the next rejection level as the profit target and aim for a risk-to-reward (R) ratio of at least 1:2 to give you an edge in your trading.

Pros and Cons of the Flat Top Pattern

Pros

  • The pattern provides precise points for entering and exiting trades.
  • When confirmed, the breakout often leads to significant upward movement.
  • The pattern can be used in day trading, swing trading, and even longer-term charts.

Cons

  • Not all breakouts lead to a sustained upward movement, and false breakouts can occur.
  • Waiting for a confirmed breakout can test a trader’s patience.
  • The pattern’s success depends on favorable market conditions.

Indicators to Use to Confirm the Pattern

Using technical analysis tools can help confirm the Flat Top Pattern. Indicators such as the Moving Average can smooth out price movements and provide confirmation of the trend. The Relative Strength Index (RSI) can indicate whether the market is overbought or oversold, supporting the likelihood of a breakout.

Volume indicators are also crucial. An increase in volume during the breakout suggests strong momentum and supports the bullish continuation pattern.

Conclusion

The Flat Top Pattern is a valuable chart pattern for traders looking for bullish opportunities in the financial market. By understanding how to spot and trade this pattern, traders can improve their trading strategies and make informed trading decisions. Proper risk management and the use of technical analysis tools can further enhance the probability of successful trades.

Also Read: How to Trade the Bump and Run Pattern

For a practical and visual explanation of the Flat Top Pattern, check out our video tutorial. This video breaks down how to identify the pattern, the significance of a bullish potential breakout, and step-by-step trading strategies, including entry points, stop losses, and profit targets. Gain a clearer understanding and see real chart examples by watching below!

FAQs

What is a false breakout?

A false breakout occurs when the price breaks above the resistance level but fails to maintain the upward momentum, leading to a reversal back below the resistance level.

Can the Flat Top Pattern be used in all market conditions?

The Flat Top Pattern is most effective in bullish market conditions. In bearish or sideways markets, the pattern may not provide reliable signals.

What time frame is best for trading the Flat Top Pattern?

The pattern can be applied to various time frames, including intraday charts for day trading and daily charts for swing trading. The choice of time frame depends on the trader’s strategy and trading style.


About Ezekiel Chew​

Ezekiel Chew, founder and head of training at Asia Forex Mentor, is a renowned forex expert, frequently invited to speak at major industry events. Known for his deep market insights, Ezekiel is one of the top traders committed to supporting the trading community. Making six figures per trade, he also trains traders working in banks, fund management, and prop trading firms.

How to Read Candlesticks (Most Traders Get This Wrong)

Most traders who spend months learning how to read candlesticks still lose on setups that looked textbook. The pattern was never the problem. Reading it without context was. ABOUT THIS GUIDE This guide covers three specific candlestick signals used in professional price action trading, the Fibonacci golden zone context tool,

Read More

What Profit Factor Tells You Before Going Live

Profit factor is calculated by dividing a strategy’s total gross profit by its total gross loss, and most experienced traders reject any system that reads below 1.5 before risking real capital. Most traders see any positive number and call it a green light. That is where the costly mistake starts.

Read More

6 Forex Trading Scams Every Beginner Should Know

The most effective forex trading scams do not announce themselves as threats. They arrive as opportunities, come through referrals and social media, and are often indistinguishable from legitimate services until the first withdrawal request is made. ABOUT THIS GUIDE This guide covers the six most common forex trading scams, the

Read More

How to Use Fibonacci Retracement Step by Step in 2026

Most traders learn how to use Fibonacci retracement and immediately draw it wrong. This tool comes from a mathematical sequence first documented in 1202, and institutional traders use it daily to plan entries at precise price levels. The majority of retail traders miss the one placement rule that makes every

Read More

Free Margin in Forex What the MT4 Panel Shows

Free margin in forex is the one figure on the MT4 or MT5 account panel that determines whether another position can open right now, and it is consistently the last number most traders learn to read. ABOUT THIS GUIDE This guide explains what free margin is and how it connects

Read More

Scalping Trading Strategy The Pros Actually Use

The scalping trading strategy most retail traders use is not actually scalping. They are gambling on 1-minute candles with no defined edge, no position-sizing rules, and no plan for when the losses come. ABOUT THIS GUIDE This guide covers what scalping is, how professional scalpers build a repeatable edge, and

Read More

AFM Trading Summit Live

Date: Coming Soon

Join us at the AFM Trading Summit Live and learn from top industry experts through live trading sessions, market insights, and actionable strategies.

How to Trade the Flat Top Pattern

4.0
Overall Trust Index

Written by:

Updated:

January 20, 2025

Trading in the financial market requires a deep understanding of various chart patterns and technical analysis tools. One such pattern that traders often rely on is the Flat Top Pattern. Recognizing and effectively trading this pattern can lead to profitable trades and strong momentum in the market. This article will guide you through understanding, spotting, and trading the Flat Top Pattern, along with tips on managing risks and identifying breakout signals.

What is the Flat Top Pattern?

The Flat Top Pattern is a bullish continuation pattern that occurs during an upward movement. It is characterized by a series of price movements that reach the same resistance level, creating a flat top on the price chart. This pattern indicates that selling pressure is not strong enough to push the price lower, suggesting an upcoming breakout. The Flat Top Pattern moves sideways within a narrow range and can signal a shift in market sentiment, indicating the beginning of an upward trend. This pattern is formed when two or more candlesticks share the same highest point, regardless of their color, length, or whether they have shadows in their real bodies. Also Read: Mastering Japanese Candlestick Patterns

How to Spot the Flat Top Pattern

  Spotting the Flat Top Pattern involves looking for a price chart where the price repeatedly hits a resistance level but fails to break above it. This creates a flat, horizontal line on the top of the price movements. The Flat Top Breakout Pattern is confirmed when the price breaks above this resistance level, signaling a potential for further upward movement. Key characteristics of the Flat Top Pattern include:
  • Multiple peaks at the same resistance level.
  • Consistent support levels creating a flat top.
  • Increasing volume as the price approaches the resistance level.
  • A potential reversal signaled when followed by a strongly bearish candlestick chart.

How to Trade the Flat Top Pattern

Entry Point

To successfully trade the Flat Top Pattern, the entry point is crucial. Traders should wait for a confirmed breakout above the resistance level. This breakout is often accompanied by a significant increase in volume, indicating strong buying interest and a bullish signal. According to trading experts, wait for the price to break and close above the candlestick highs and enter with a good bullish bar close.

Stop Loss

Implementing a proper risk management strategy is essential. Place a stop loss just below the most recent support level to minimize potential losses. This ensures that if the breakout turns out to be a false breakout, the losses are contained. Specifically, place the stop loss below the lows of the flat top candlestick.

Profit Target

Setting a profit target helps in locking in profits. A common approach is to measure the height of the pattern and project it upwards from the breakout point. This gives a realistic target based on the previous price action. Use the next rejection level as the profit target and aim for a risk-to-reward (R) ratio of at least 1:2 to give you an edge in your trading.

Pros and Cons of the Flat Top Pattern

Pros

  • The pattern provides precise points for entering and exiting trades.
  • When confirmed, the breakout often leads to significant upward movement.
  • The pattern can be used in day trading, swing trading, and even longer-term charts.

Cons

  • Not all breakouts lead to a sustained upward movement, and false breakouts can occur.
  • Waiting for a confirmed breakout can test a trader's patience.
  • The pattern's success depends on favorable market conditions.

Indicators to Use to Confirm the Pattern

Using technical analysis tools can help confirm the Flat Top Pattern. Indicators such as the Moving Average can smooth out price movements and provide confirmation of the trend. The Relative Strength Index (RSI) can indicate whether the market is overbought or oversold, supporting the likelihood of a breakout. Volume indicators are also crucial. An increase in volume during the breakout suggests strong momentum and supports the bullish continuation pattern.

Conclusion

The Flat Top Pattern is a valuable chart pattern for traders looking for bullish opportunities in the financial market. By understanding how to spot and trade this pattern, traders can improve their trading strategies and make informed trading decisions. Proper risk management and the use of technical analysis tools can further enhance the probability of successful trades. Also Read: How to Trade the Bump and Run Pattern For a practical and visual explanation of the Flat Top Pattern, check out our video tutorial. This video breaks down how to identify the pattern, the significance of a bullish potential breakout, and step-by-step trading strategies, including entry points, stop losses, and profit targets. Gain a clearer understanding and see real chart examples by watching below! https://www.youtube.com/watch?v=vc6JxRT9UjE

FAQs

What is a false breakout?

A false breakout occurs when the price breaks above the resistance level but fails to maintain the upward momentum, leading to a reversal back below the resistance level.

Can the Flat Top Pattern be used in all market conditions?

The Flat Top Pattern is most effective in bullish market conditions. In bearish or sideways markets, the pattern may not provide reliable signals.

What time frame is best for trading the Flat Top Pattern?

The pattern can be applied to various time frames, including intraday charts for day trading and daily charts for swing trading. The choice of time frame depends on the trader's strategy and trading style.

ezekiel chew asiaforexmentor

About Ezekiel Chew

Ezekiel Chew, founder and head of training at Asia Forex Mentor, is a renowned forex expert, frequently invited to speak at major industry events. Known for his deep market insights, Ezekiel is one of the top traders committed to supporting the trading community. Making six figures per trade, he also trains traders working in banks, fund management, and prop trading firms.

RELATED ARTICLES

How to Trade the Flat Top Pattern

4.0
Overall Trust Index

Written by:

Updated:

January 20, 2025

Trading in the financial market requires a deep understanding of various chart patterns and technical analysis tools. One such pattern that traders often rely on is the Flat Top Pattern. Recognizing and effectively trading this pattern can lead to profitable trades and strong momentum in the market. This article will guide you through understanding, spotting, and trading the Flat Top Pattern, along with tips on managing risks and identifying breakout signals.

What is the Flat Top Pattern?

The Flat Top Pattern is a bullish continuation pattern that occurs during an upward movement. It is characterized by a series of price movements that reach the same resistance level, creating a flat top on the price chart. This pattern indicates that selling pressure is not strong enough to push the price lower, suggesting an upcoming breakout. The Flat Top Pattern moves sideways within a narrow range and can signal a shift in market sentiment, indicating the beginning of an upward trend. This pattern is formed when two or more candlesticks share the same highest point, regardless of their color, length, or whether they have shadows in their real bodies. Also Read: Mastering Japanese Candlestick Patterns

How to Spot the Flat Top Pattern

  Spotting the Flat Top Pattern involves looking for a price chart where the price repeatedly hits a resistance level but fails to break above it. This creates a flat, horizontal line on the top of the price movements. The Flat Top Breakout Pattern is confirmed when the price breaks above this resistance level, signaling a potential for further upward movement. Key characteristics of the Flat Top Pattern include:
  • Multiple peaks at the same resistance level.
  • Consistent support levels creating a flat top.
  • Increasing volume as the price approaches the resistance level.
  • A potential reversal signaled when followed by a strongly bearish candlestick chart.

How to Trade the Flat Top Pattern

Entry Point

To successfully trade the Flat Top Pattern, the entry point is crucial. Traders should wait for a confirmed breakout above the resistance level. This breakout is often accompanied by a significant increase in volume, indicating strong buying interest and a bullish signal. According to trading experts, wait for the price to break and close above the candlestick highs and enter with a good bullish bar close.

Stop Loss

Implementing a proper risk management strategy is essential. Place a stop loss just below the most recent support level to minimize potential losses. This ensures that if the breakout turns out to be a false breakout, the losses are contained. Specifically, place the stop loss below the lows of the flat top candlestick.

Profit Target

Setting a profit target helps in locking in profits. A common approach is to measure the height of the pattern and project it upwards from the breakout point. This gives a realistic target based on the previous price action. Use the next rejection level as the profit target and aim for a risk-to-reward (R) ratio of at least 1:2 to give you an edge in your trading.

Pros and Cons of the Flat Top Pattern

Pros

  • The pattern provides precise points for entering and exiting trades.
  • When confirmed, the breakout often leads to significant upward movement.
  • The pattern can be used in day trading, swing trading, and even longer-term charts.

Cons

  • Not all breakouts lead to a sustained upward movement, and false breakouts can occur.
  • Waiting for a confirmed breakout can test a trader's patience.
  • The pattern's success depends on favorable market conditions.

Indicators to Use to Confirm the Pattern

Using technical analysis tools can help confirm the Flat Top Pattern. Indicators such as the Moving Average can smooth out price movements and provide confirmation of the trend. The Relative Strength Index (RSI) can indicate whether the market is overbought or oversold, supporting the likelihood of a breakout. Volume indicators are also crucial. An increase in volume during the breakout suggests strong momentum and supports the bullish continuation pattern.

Conclusion

The Flat Top Pattern is a valuable chart pattern for traders looking for bullish opportunities in the financial market. By understanding how to spot and trade this pattern, traders can improve their trading strategies and make informed trading decisions. Proper risk management and the use of technical analysis tools can further enhance the probability of successful trades. Also Read: How to Trade the Bump and Run Pattern For a practical and visual explanation of the Flat Top Pattern, check out our video tutorial. This video breaks down how to identify the pattern, the significance of a bullish potential breakout, and step-by-step trading strategies, including entry points, stop losses, and profit targets. Gain a clearer understanding and see real chart examples by watching below! https://www.youtube.com/watch?v=vc6JxRT9UjE

FAQs

What is a false breakout?

A false breakout occurs when the price breaks above the resistance level but fails to maintain the upward momentum, leading to a reversal back below the resistance level.

Can the Flat Top Pattern be used in all market conditions?

The Flat Top Pattern is most effective in bullish market conditions. In bearish or sideways markets, the pattern may not provide reliable signals.

What time frame is best for trading the Flat Top Pattern?

The pattern can be applied to various time frames, including intraday charts for day trading and daily charts for swing trading. The choice of time frame depends on the trader's strategy and trading style.

ezekiel chew asiaforexmentor

About Ezekiel Chew

Ezekiel Chew, founder and head of training at Asia Forex Mentor, is a renowned forex expert, frequently invited to speak at major industry events. Known for his deep market insights, Ezekiel is one of the top traders committed to supporting the trading community. Making six figures per trade, he also trains traders working in banks, fund management, and prop trading firms.

RELATED ARTICLES

Join the Live Event
Get Your Free Ticket Now

I consent to receiving emails and/or text message reminders for this event.

REGISTER FOR THE MASTERCLASS!