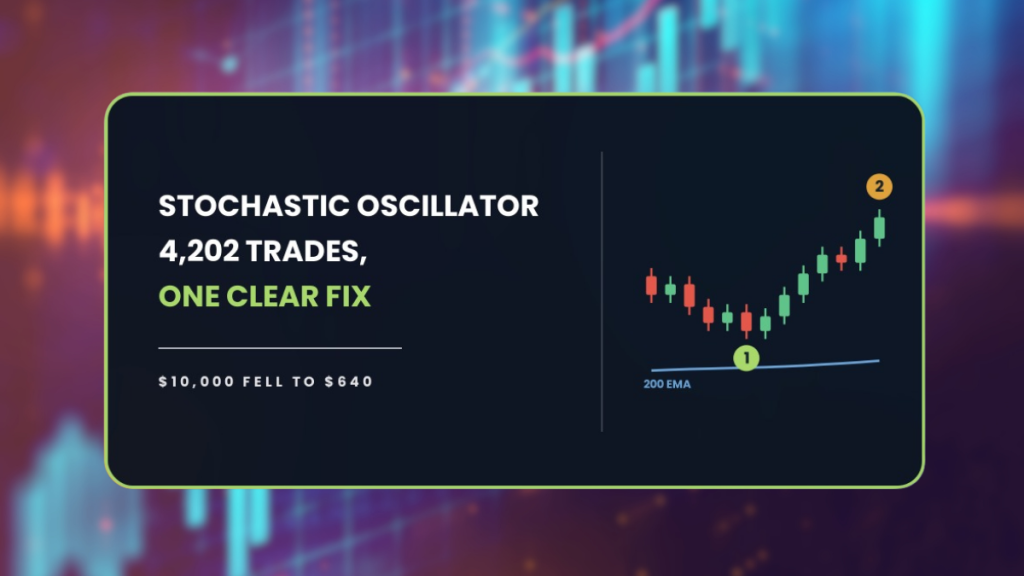
The stochastic oscillator strategy buys weakness and sells strength, with nothing checking which way the market is already heading. It takes the reversal either way, and across 4,202 trades that took $10,000 down to $640. Adding a direction filter halved the worst fall and still lost money.
| About This Guide |
|---|
| This guide explains what the stochastic oscillator strategy is, the exact rules we put through the AFM Research Lab across 28 forex pairs and ten years of Daily data, and what happened to an account trading them. You will finish knowing why the textbook version lost money, what the 200 day EMA filter changed, and why the version that ended at $15,372 cannot be trusted. |
| Quick Answer |
|---|
| The stochastic oscillator compares each close to the high and low range of recent bars, and traders enter when that reading reaches an extreme and turns back. In the AFM Research Lab the textbook version lost money across 4,202 trades on 28 forex pairs, ending at $640 from $10,000. A filtered version still lost money, but it cut the worst fall from 86 percent to 48 percent. |
What Happened When We Tested The Stochastic Oscillator Strategy
Two accounts, both starting at $10,000. One traded the rules as they are commonly taught. The other ran settings the Lab picked by searching the test history.
One of them finished ahead. That is the one you should trust least.
| Version | Start | End | Max drawdown | Trades |
|---|---|---|---|---|
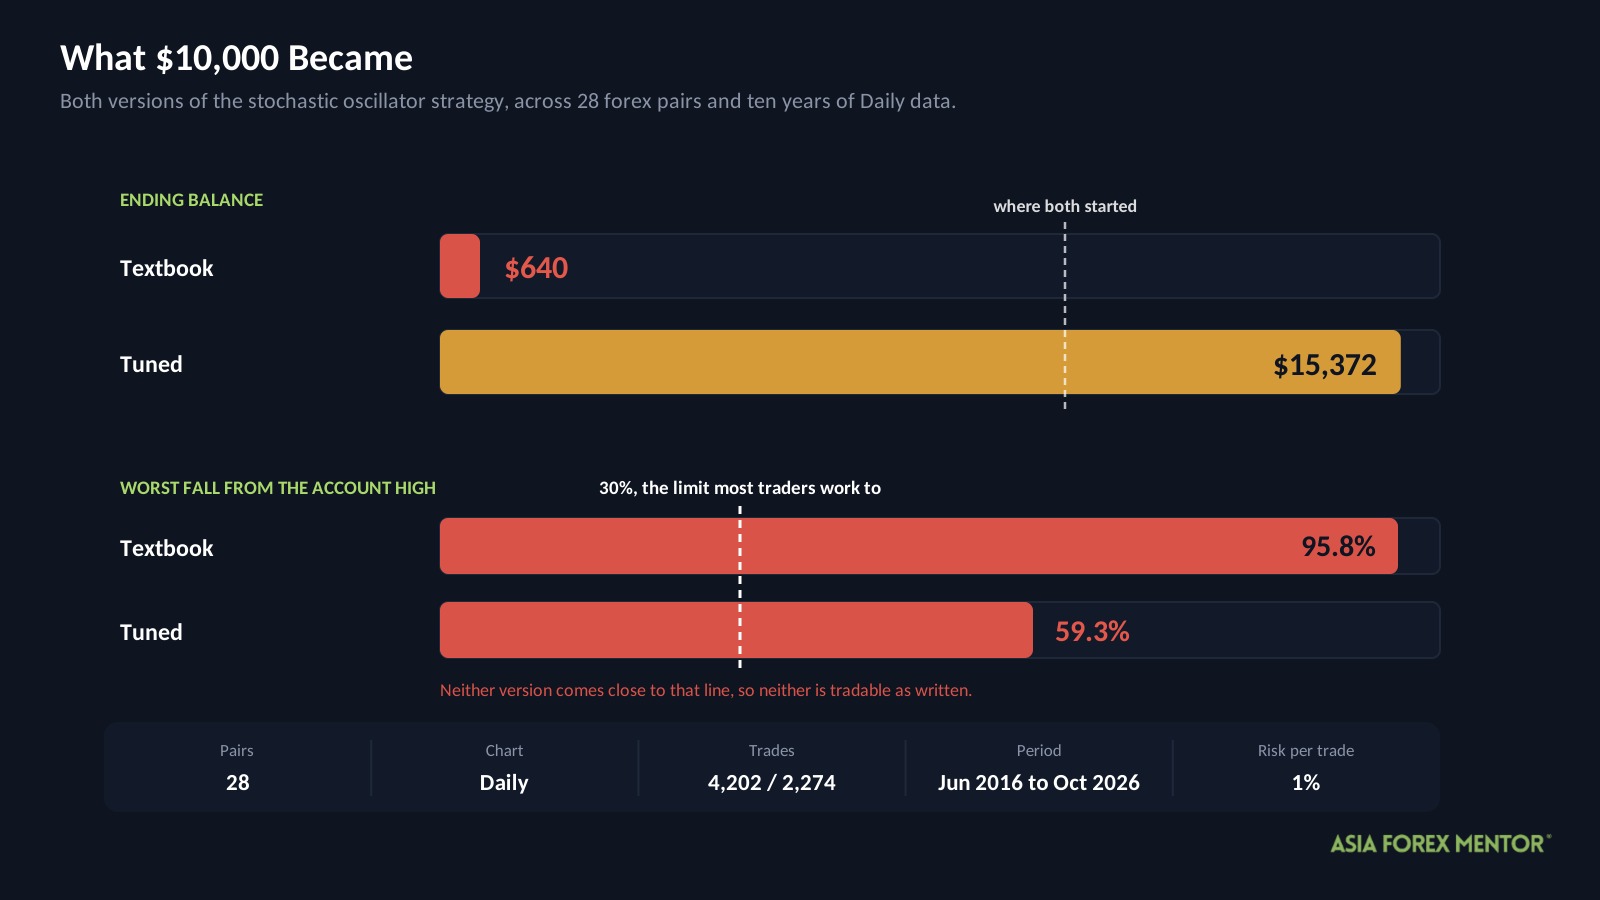
| Textbook | $10,000 | $640 | 95.8% | 4,202 |
| Tuned | $10,000 | $15,372 | 59.3% | 2,274 |
Drawdown is how far an account falls from its highest point. In other words, it is not your overall loss, it is the size of the worst slide from a peak to the low that followed.
Most traders treat 30 percent as the limit of what is survivable. Neither version comes close to it, so neither is tradable as written.
The test ran from June 22, 2016 to October 19, 2026, across 28 currency pairs on the Daily chart. Each trade risked 1 percent of the account, and the test charged 0.05 percent of the entry price per round trip in costs.
These are backtest results. Backtesting is not live trading, and past results do not guarantee future performance.
Key Takeaways
- The textbook rules lost money across 4,202 trades, ending at $640 from a $10,000 start.
- The worst fall was 95.8 percent, more than triple what most traders treat as survivable.
- The setup needed a 36 percent win rate to break even, and it managed 34.
- A 200 day EMA filter cut the worst fall from 86 percent to 48 percent on years it had never seen, and still lost 4.7R per hundred trades.
- The tuned version that ended at $15,372 made all of it in one 31 month stretch, and returned 4.3 percent a year across the full ten.
What Is The Stochastic Oscillator?
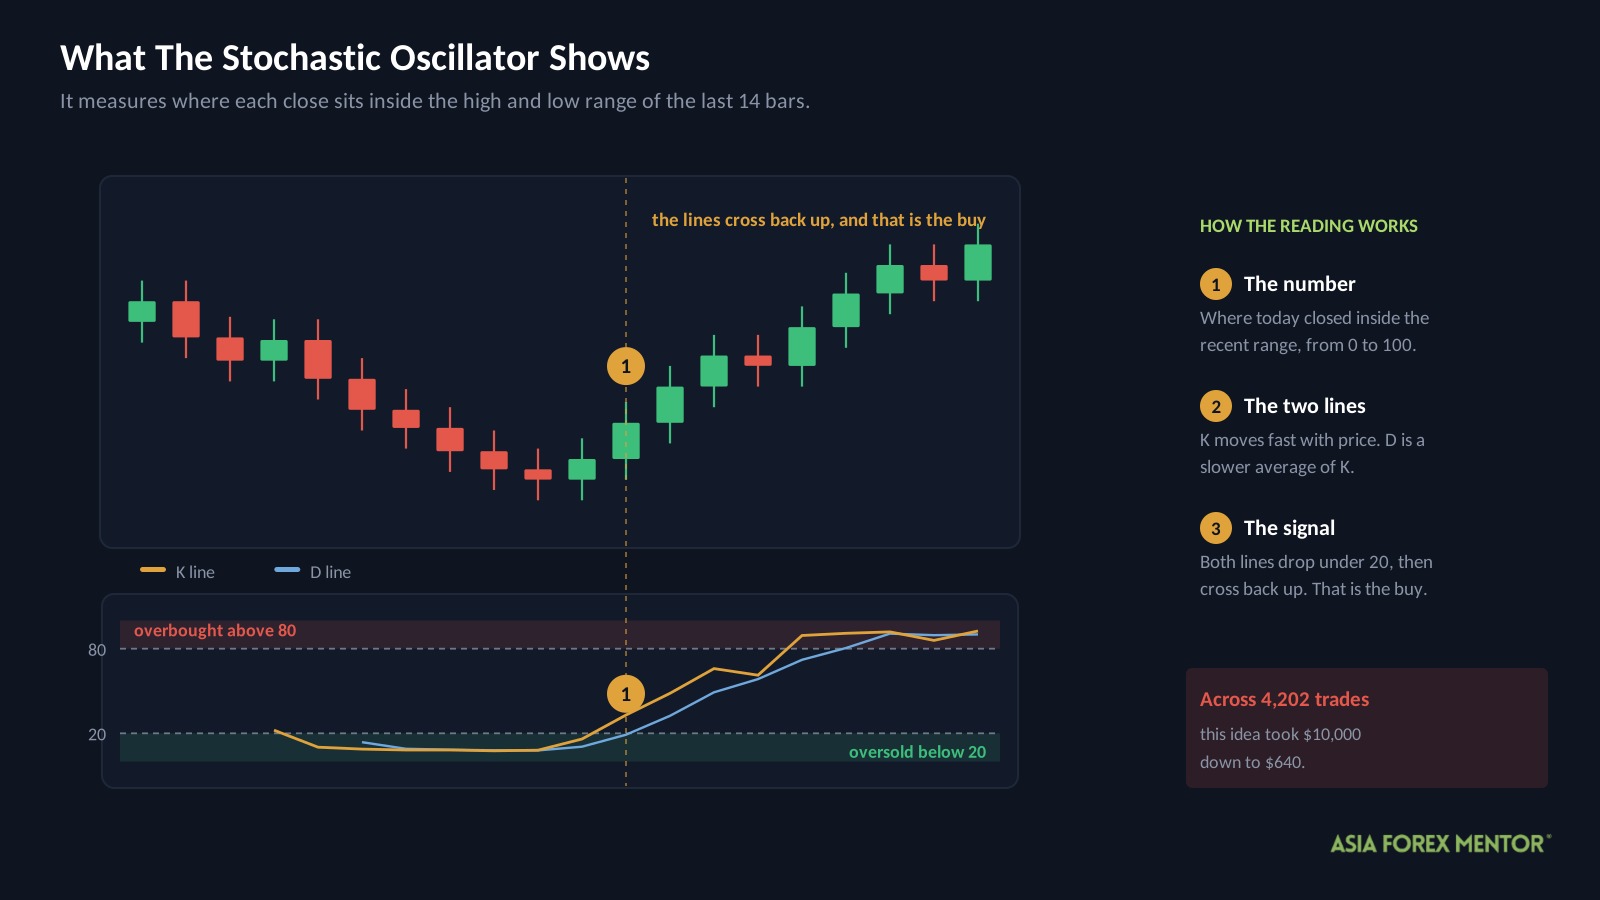
The stochastic oscillator measures where today’s close sits inside the high and low range of recent bars. It turns that into a number between 0 and 100.
A reading near 100 means price closed near the top of its range. A reading near 0 means it closed near the bottom.
The tool draws two lines from that number. The K line moves fast with price, and the D line is a slower average of K.
The logic is that stretched markets snap back. So traders watch for the reading to reach an extreme, then enter when the lines turn back the other way.
How Do Most Traders Trade The Stochastic Oscillator Strategy?
They wait for the reading to reach an extreme, then take the first cross back in either direction.
Three terms you need first.
R is what you risk on one trade, measured from entry to stop. On a $10,000 account risking 1 percent, 1R is $100, so a 2R target aims for $200.
ATR means Average True Range, which is how far a pair usually moves in a day. A stop set in ATR sizes itself to each pair rather than using the same pip distance everywhere.
Oversold and overbought are the two extremes. A reading under 20 is oversold, meaning price has closed near the bottom of its recent range, and a reading over 80 is overbought.
Here are the rules exactly as we tested them.
| Rule | Setting |
|---|---|
| Chart | Daily |
| Indicator | 14 period stochastic, 3 period signal |
| Oversold level | 20 |
| Overbought level | 80 |
| Entry | The cross back through the level, either direction |
| Stop loss | 1.5 ATR from entry |
| Target | 2R |
| Direction filter | None |
Note the last row. The textbook version takes the cross either way, with nothing checking whether the wider market agrees.
Why Did The Textbook Version Lose?
| Metric | Textbook |
|---|---|
| Trades | 4,202 |
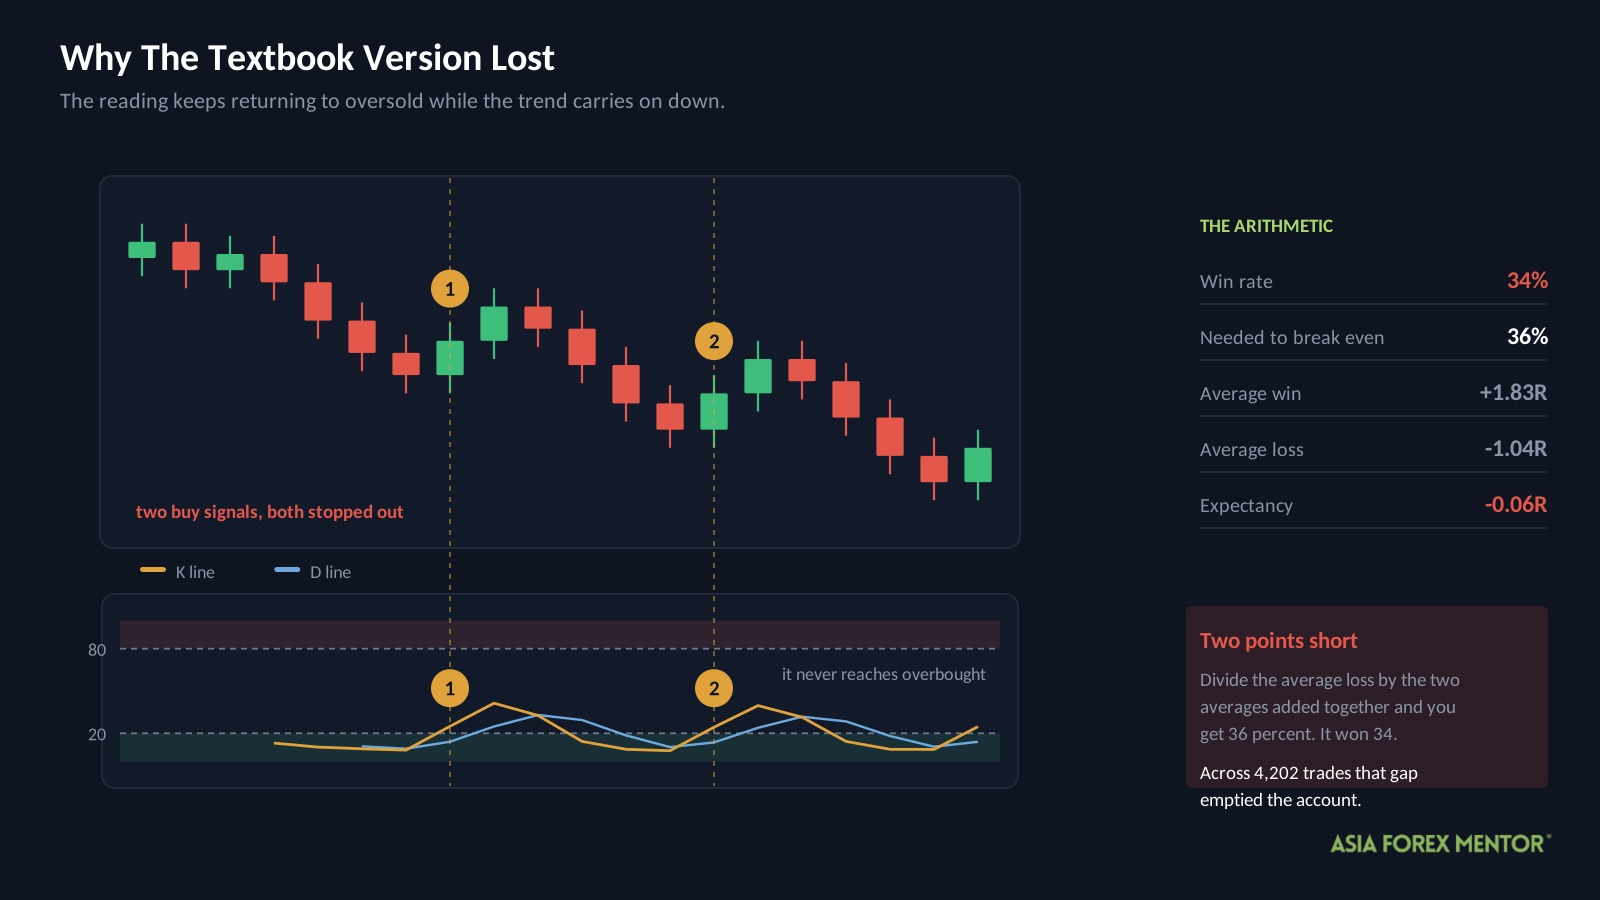
| Win rate | 34% |
| Average win | +1.83R |
| Average loss | -1.04R |
| Expectancy | -0.06R |
| Profit factor | 0.92 |
| Yearly growth rate | -23.3% |
| Max drawdown | 95.8% |
| Ending balance from $10,000 | $640 |
Three of those need defining.
Expectancy is what the average trade earns or loses, in R. At minus 0.06R, every trade cost about a sixteenth of what it risked, and 4,202 of those is how an account reaches $640.
Profit factor is total winnings divided by total losses. Below 1 means the strategy lost money, so 0.92 says it paid out $1 for every 92 cents it took in.
Yearly growth rate, often written as CAGR, is the average rate the account changed each year. At minus 23.3 percent a year, compounding over ten years, $10,000 becomes $640.
Now the arithmetic. The average win was 1.83R and the average loss 1.04R, so this setup needed to win about 36 percent of the time just to break even.
It won 34 percent.
Two points does not sound like much. However, stretch that gap across 4,202 trades and it is the whole story, which is why stops closed 65 percent of them while targets closed only 31.
What Did We Change?
The entry, stop and target were left alone. The AFM Research Lab added one condition that decides whether a cross gets traded at all.
| Filter | Condition | The idea behind it |
|---|---|---|
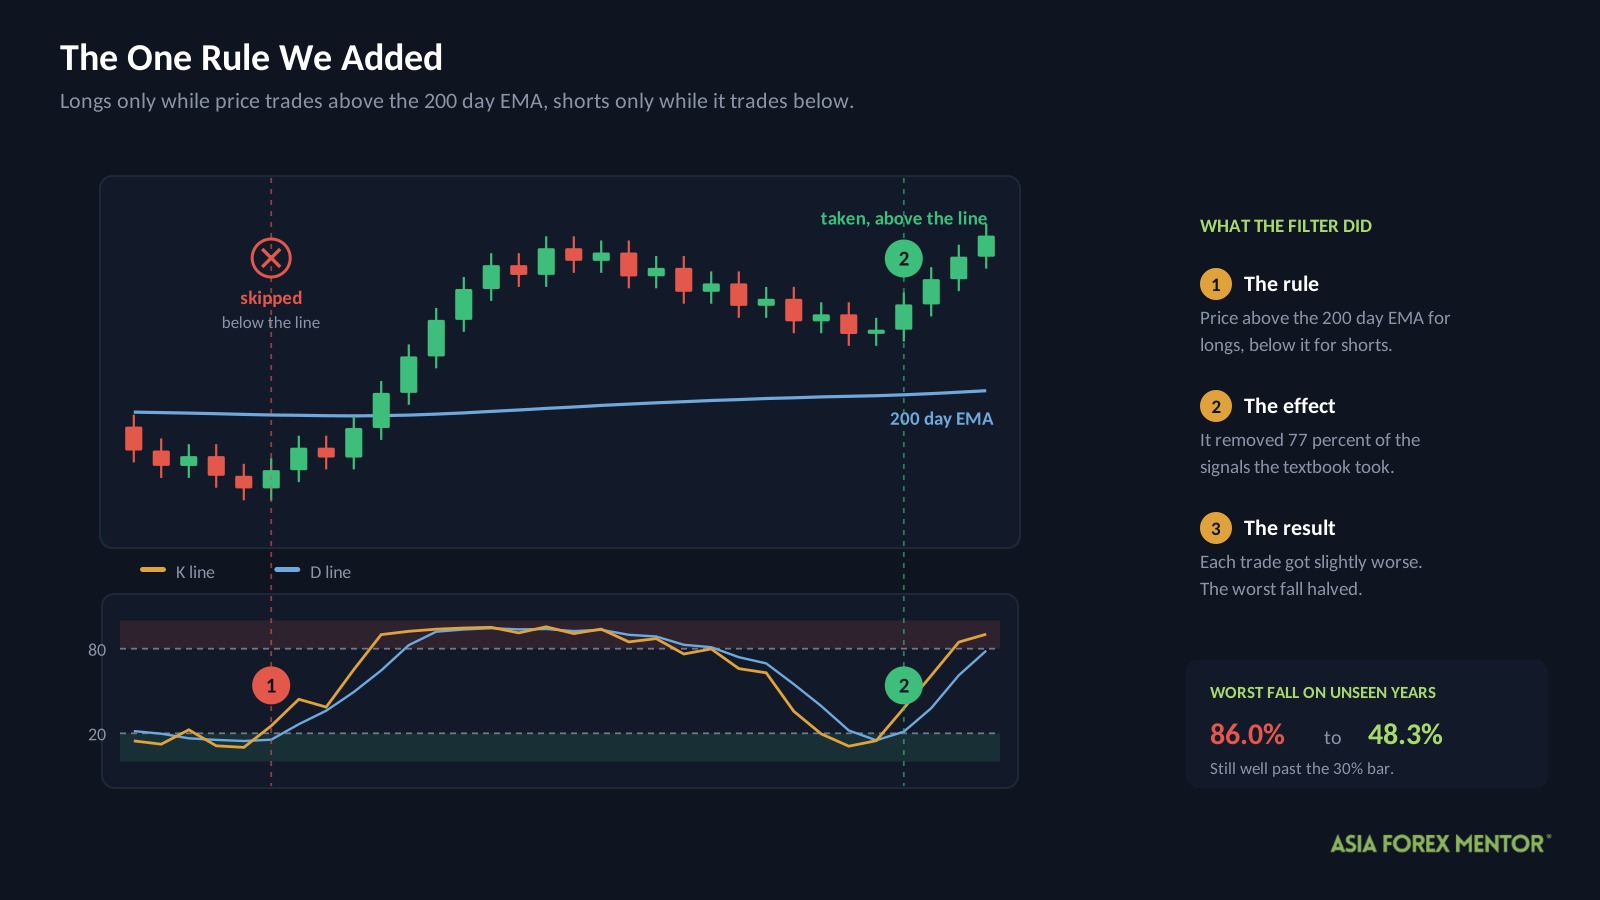
| Direction | Price above the 200 day EMA for longs, below it for shorts | Stop taking reversals that fight the larger trend |
An EMA is an exponential moving average, a line that smooths price and weights recent days most heavily. Above the 200 day line the larger trend points up, and below it the trend points down.
We chose that rule using only the first two years of data. We then tested it across the remaining eight, which the rule had never seen.
That matters, because it is the only part of this test that was not fitted to the answers.
Did The Filter Work?
It lost slightly more per trade, and it halved the damage to the account.
| Metric | Textbook | Filtered |
|---|---|---|
| Trades | 3,323 | 773 |
| Win rate | 35% | 35% |
| Result per 100 trades | -3.5R | -4.7R |
| Profit factor | 0.95 | 0.93 |
| Max drawdown | 86.0% | 48.3% |
Both figures above come from the unseen years only, so neither one is flattered by the settings that produced it.
The filter made each trade a little worse and the equity curve far easier to survive. Scaled so both carry the same worst fall, the textbook leaves $6,377 and the filtered version leaves $6,453.
However, 48.3 percent is still well past the 30 percent bar. Equal pain, slightly better outcome, and both still below the $10,000 they started with.
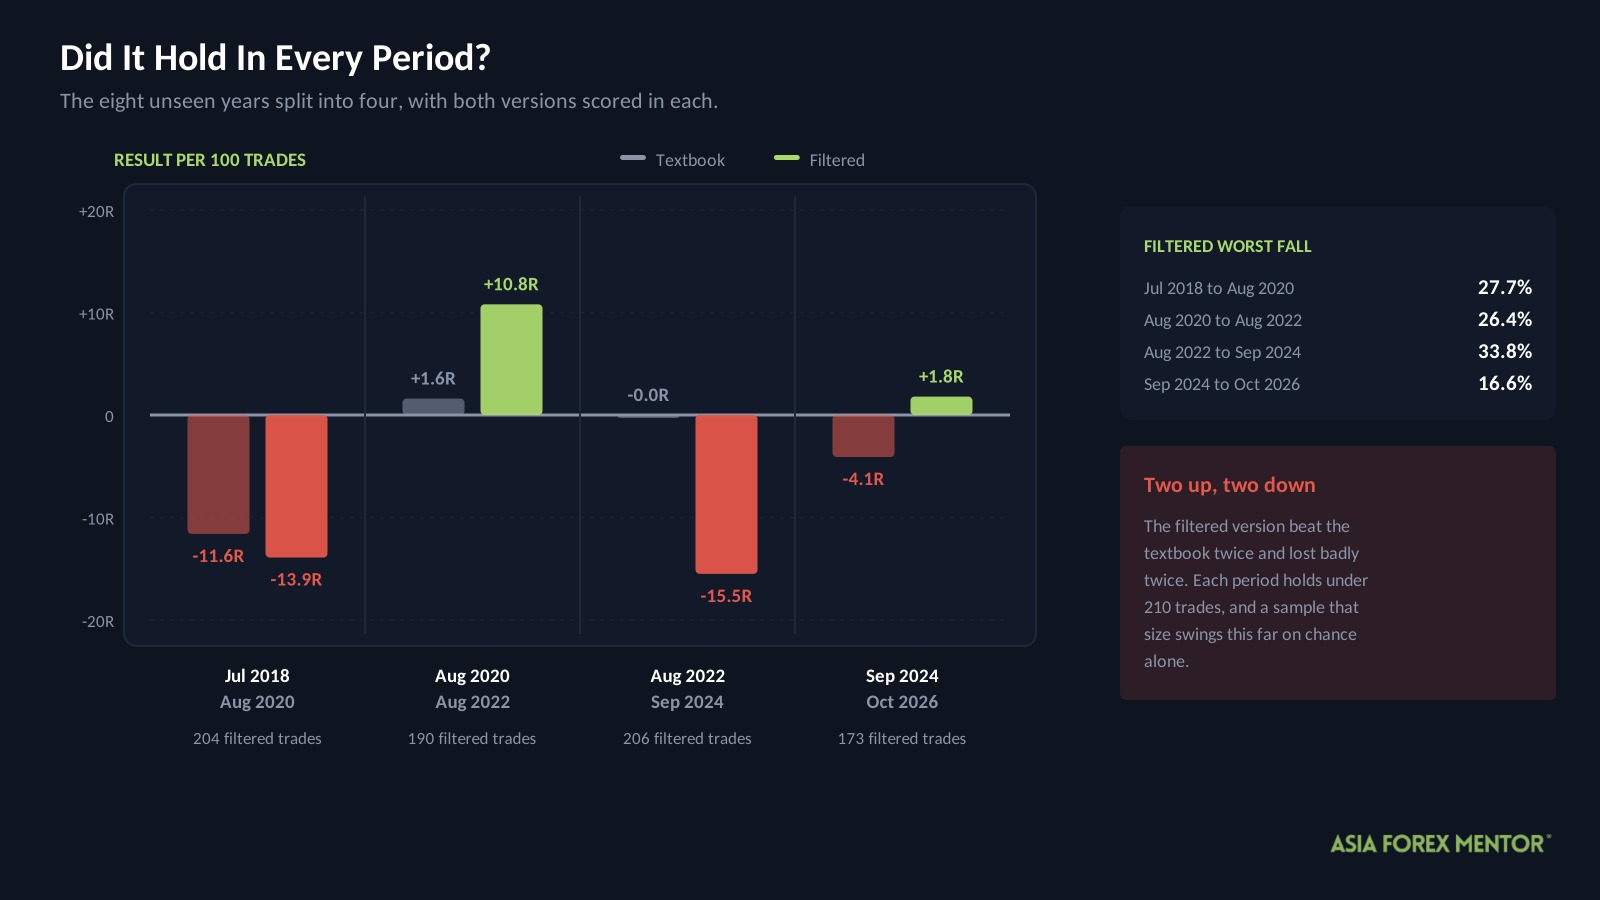
Did It Hold In Every Period?
The eight unseen years were split into four periods and both versions scored in each. This is called walk forward testing, and it checks whether a result is steady or driven by one stretch.
| Period | Textbook per 100 | Filtered per 100 | Filtered drawdown | Trades |
|---|---|---|---|---|
| Jul 2018 to Aug 2020 | -11.6R | -13.9R | 27.7% | 204 |
| Aug 2020 to Aug 2022 | +1.6R | +10.8R | 26.4% | 190 |
| Aug 2022 to Sep 2024 | -0.0R | -15.5R | 33.8% | 206 |
| Sep 2024 to Oct 2026 | -11.7R | +1.8R | 16.6% | 173 |
The filtered version beat the textbook in two periods and lost badly to it in the other two. Its result swung from minus 15.5R to plus 10.8R per hundred.
One thing did hold. The filtered version carried the smaller fall in all four periods, and in the last one it gave up only 16.6 percent.
Each period holds under 210 trades. A sample that size produces swings of roughly this size through chance alone, so treat the two good periods and the two bad ones as the same evidence.
Where Did The $15,372 Come From?
A separate search across 12 parameter combinations, run over the full test history.
That search picked a 21 period stochastic with a 5 period signal, levels at 20 and 75, a 2 ATR stop and a 4R target. It chose them by testing against data it had already seen, which has a name, in sample optimization.
Split that version into four equal slices and the problem appears immediately.
| Slice | Trades | Win rate | Expectancy | Yearly growth | Max drawdown |
|---|---|---|---|---|---|
| Jun 2016 to Jan 2019 | 592 | 35% | +0.02R | +1.2% | 42.3% |
| Jan 2019 to Aug 2021 | 553 | 33% | -0.01R | -5.0% | 49.4% |
| Aug 2021 to Mar 2024 | 555 | 36% | +0.13R | +29.0% | 30.4% |
| Mar 2024 to Oct 2026 | 573 | 35% | -0.01R | -4.3% | 59.3% |
One slice did all the work. The 31 months from August 2021 to March 2024 grew 29.0 percent a year, while the other three managed 1.2 percent, minus 5.0 percent and minus 4.3 percent.
Take that single window out and the same settings turn $10,000 into roughly $8,100. Across the full ten years the $15,372 works out to 4.3 percent a year, earned against a 59.3 percent fall.
What About The Pairs?
AUDUSD produced the highest expectancy in the tuned version at 0.44R per trade, across 80 trades.
EURCHF returned less at 0.13R. However, it was the only pair that stayed positive across both halves of the data, and it did so across 136 trades.
CHFJPY sat at the other end at minus 0.21R across 79 trades. The gap between the best and worst pair is wider than the edge itself.
All three numbers come from settings fitted to this same history, so the ranking is the optimistic case rather than a proven one.
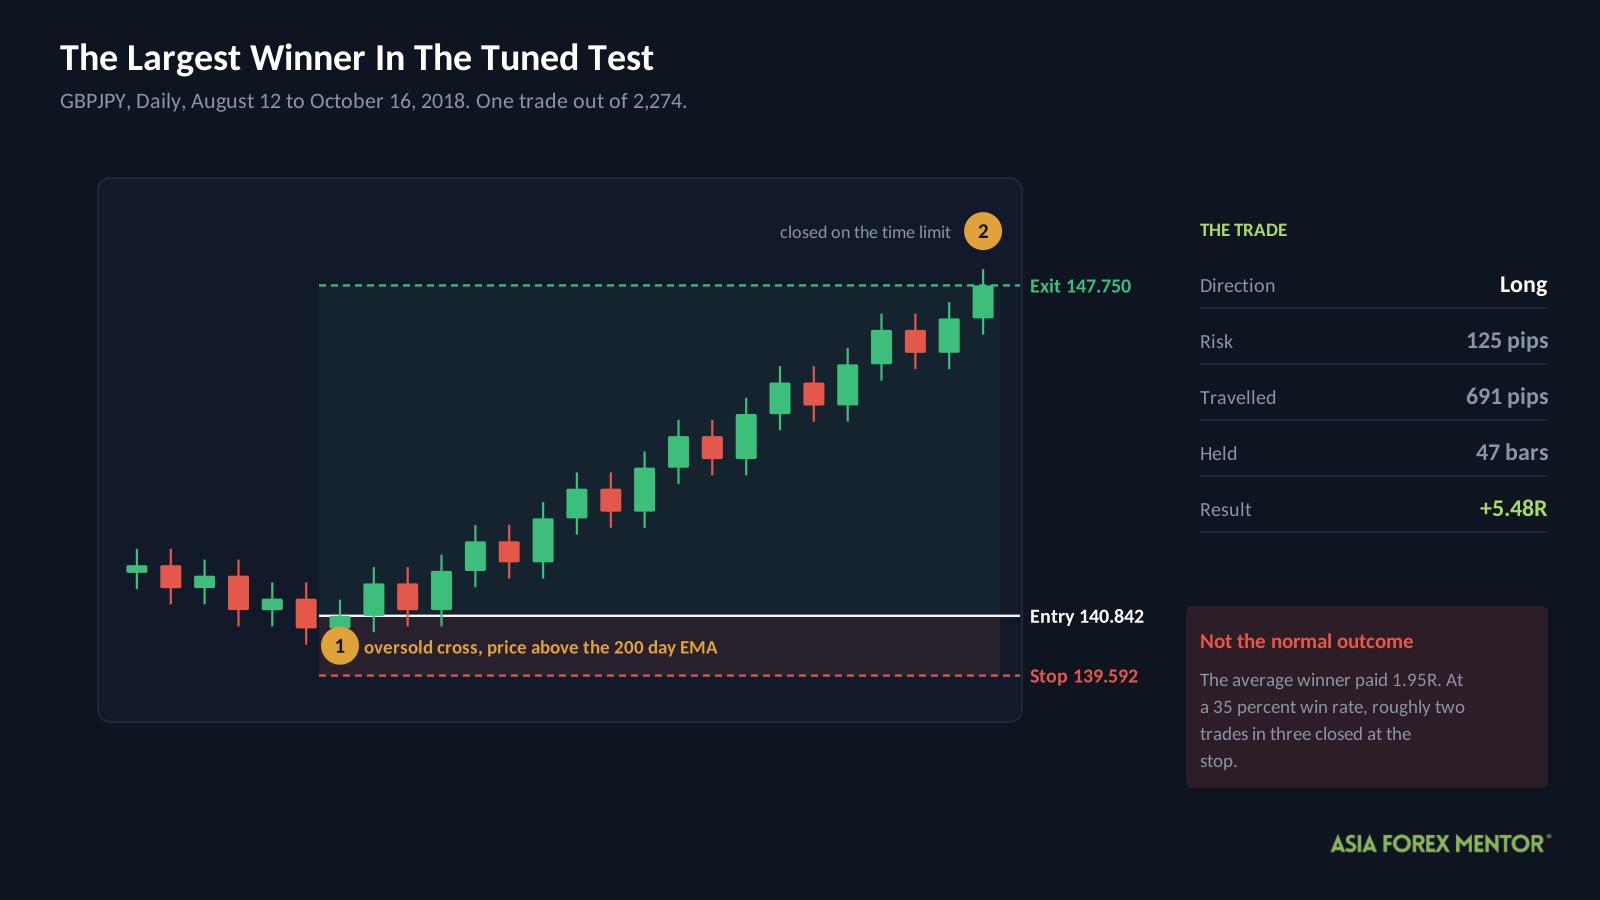
What Did A Winning Trade Look Like?
This is a real trade from the tuned sample, and it is well above average.
| Detail | Value |
|---|---|
| Pair and chart | GBPJPY, Daily |
| Direction | Long |
| Entry | August 12, 2018 at 140.842 |
| Stop | 139.592 |
| Exit | October 16, 2018 at 147.750 |
| Result | +5.48R in 47 bars |
Both lines had crossed back up through the oversold level, and price sat above the 200 day EMA. The filter passed.
The risk was 125 pips and price travelled 691 pips over ten weeks. Set that against the tuned version’s average win of 1.95R, and this trade paid nearly three times what the usual winner did.
In fact it was the single largest win across all 2,274 trades. Most did not get close, and at a 35 percent win rate roughly two in three closed at the stop.
What Should You Take From This?
Not a trading plan. Two things worth keeping, and the second applies well beyond this setup.
Work out the break-even win rate before you trade anything. Divide the average loss by the sum of the average win and the average loss.
Ask which data chose the settings. A result produced by rules fitted to the same history tells you almost nothing about the next ten years.
The second point is what this test exists to demonstrate. The best looking number in the whole study is $15,372, and one favourable stretch of market produced every dollar of it.
When a backtest reports a return you like, check what the rules were allowed to see before you check the method.
Before testing any of this with real money, read about risk management and size accordingly.
Is The Stochastic Oscillator Strategy Worth Your Time?
Not as it is taught, and 4,202 trades is enough to say that part plainly.
The textbook rules lost money across 4,202 trades, ending at $640 with a 95.8 percent drawdown.
The 200 day EMA filter cut the worst fall from 86 percent to 48 percent on unseen years, and still lost 4.7R per hundred trades.
The tuned version returned 4.3 percent a year against a 59.3 percent fall, with one 31 month window producing all of it.
The idea behind the oscillator is not wrong. Stretched markets do snap back, and that observation sits underneath a lot of momentum work.
What fails is the textbook packaging: a fixed 20 and 80 level, a 1.5 ATR stop, and a reversal taken in either direction with nothing checking the wider trend. Adding that missing direction filter is where the entire improvement came from.
If you want to trade it anyway, the 200 day EMA filter is the minimum. However, you would be adding one rule this test cannot confirm to a setup it can confirm does not work.
Also Read: How To Spot Trend Reversals In Trading
Frequently Asked Questions
Does The Stochastic Oscillator Strategy Work In Forex?
Not as it is commonly taught. The AFM Research Lab ran it across 4,202 trades and ten years of Daily data, and $10,000 finished at $640 with a 95.8 percent drawdown.
What Win Rate Does The Stochastic Oscillator Need?
About 36 percent, given an average win of 1.83R against an average loss of 1.04R. The textbook version won 34 percent, which is why it lost money steadily.
What Are The Best Stochastic Oscillator Settings For Forex?
A search across 12 combinations picked a 21 period stochastic with a 5 period signal, levels at 20 and 75, a 2 ATR stop and a 4R target. Those settings were fitted to the test history, so expect live results to fall short.
Does The 200 Day EMA Filter Make The Stochastic Profitable?
Not on this data. It cut the worst fall from 86 percent to 48 percent on years it had never seen, but it still lost 4.7R per hundred trades and removed 77 percent of the signals.
Which Forex Pairs Suit The Stochastic Oscillator Strategy?
AUDUSD led at 0.44R per trade and CHFJPY trailed at minus 0.21R. EURCHF returned 0.13R and was the only pair positive across both halves of the data.
Why Does The Stochastic Oscillator Lose In A Trend?
It fires when price reaches an extreme, and in a strong trend price stays at that extreme for weeks. The signal keeps telling you to fade a move that keeps going.