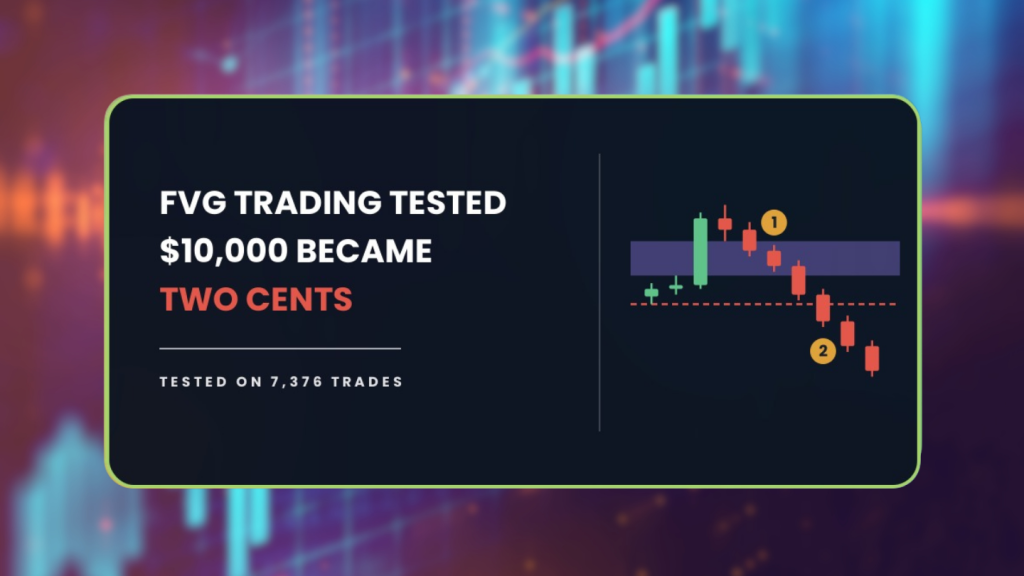
FVG trading turned $10,000 into roughly two cents across 7,376 trades. The account did not quite reach zero, because at 1 percent risk per trade it mathematically cannot. It got as close as arithmetic allows.
| About This Guide |
|---|
| This guide explains what a fair value gap is, the exact rules we put through the AFM Research Lab across 28 forex pairs and 8.3 years of Daily data, and what happened to an account trading them. You will finish knowing why the textbook version failed so completely, what two filters changed, and why their improvement did not last. |
| Quick Answer |
|---|
| FVG trading enters when price returns to a gap left behind by a fast three candle move. In the AFM Research Lab the textbook version lost effectively the entire account across 7,376 trades on 28 forex pairs. A filtered version finished at $6,779, still below the $10,000 start. |
What Happened When We Tested FVG Trading
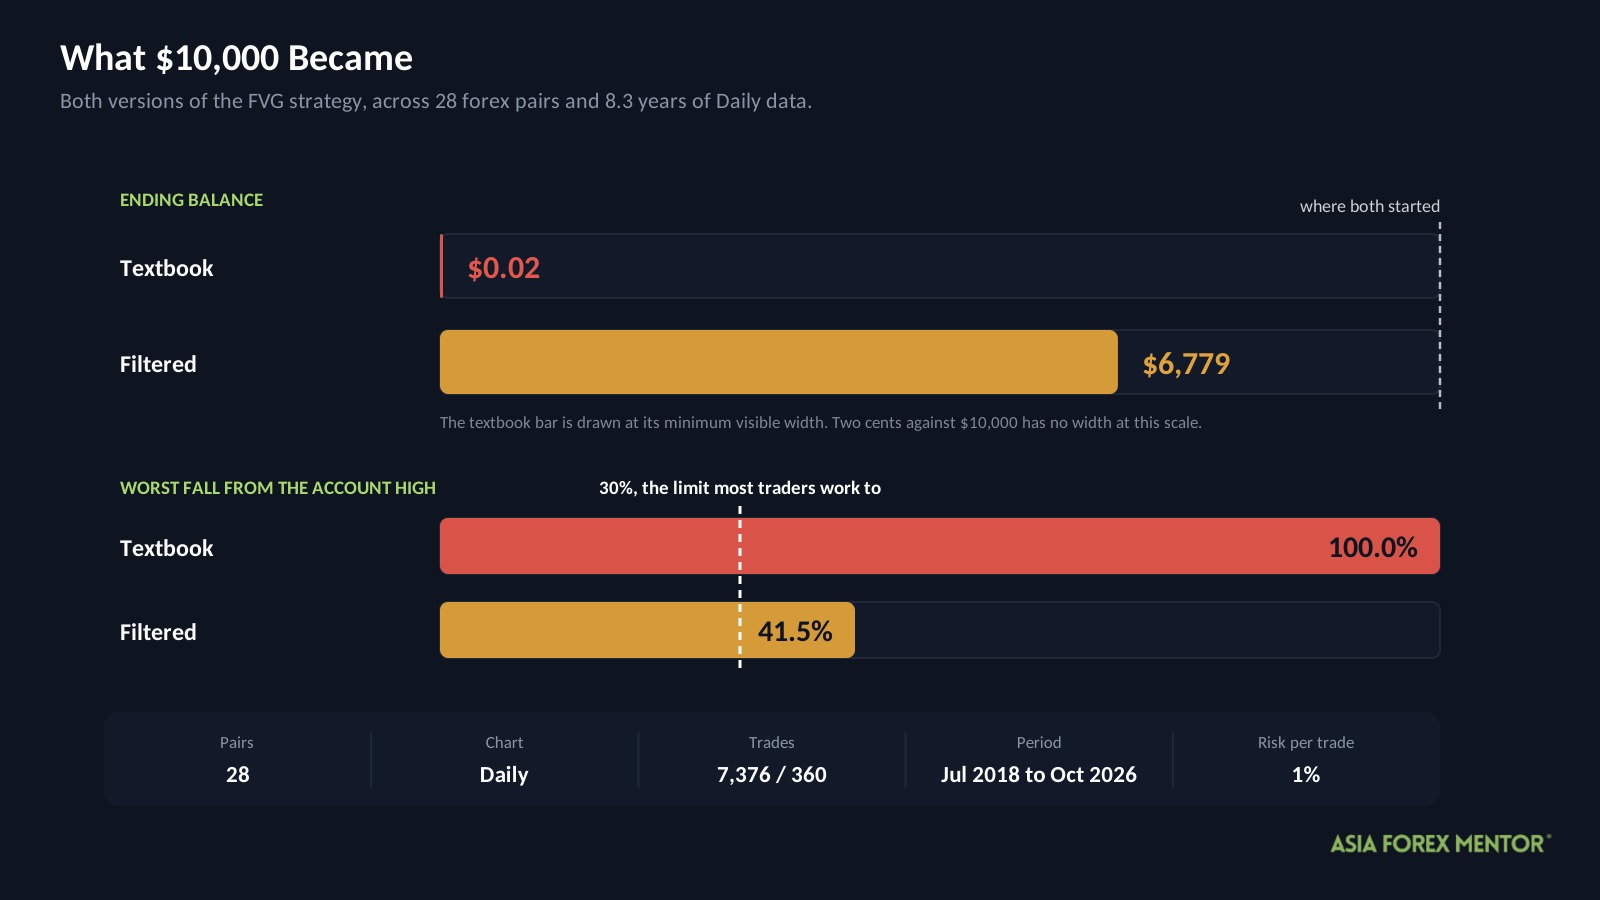
Two accounts, both starting at $10,000. One traded the rules as they are commonly taught. The other added two conditions from the AFM Research Lab.
One lost almost everything. The other lost about a third.
| Version | Start | End | Max drawdown | Trades |
|---|---|---|---|---|
| Textbook | $10,000 | $0.02 | 100.0% | 7,376 |
| Filtered | $10,000 | $6,779 | 41.5% | 360 |
That two cents deserves a sentence. Risking 1 percent of whatever remains means each loss takes a slice of a smaller number, so the balance shrinks toward zero without ever arriving. The Lab reports the drawdown as 100.0 percent because it rounds, and the yearly growth rate works out to a couple of pennies left.
Drawdown is how far an account falls from its highest point. In other words, it is not your overall loss, it is the size of the worst slide from a peak to the low that followed.
Most traders treat 30 percent as the limit of what is survivable. Neither version came close, so neither is tradable as written.
The test ran from July 10, 2018 to October 15, 2026, across 28 currency pairs on the Daily chart. Each trade risked 1 percent of the account, and the test charged 0.05 percent of the entry price per round trip in costs.
These are backtest results. Backtesting is not live trading, and past results do not guarantee future performance.
Key Takeaways
- The textbook rules lost effectively the whole account across 7,376 trades, the largest sample we have tested.
- The setup needed a 35 percent win rate to break even, and it managed 29.
- About seven trades in ten closed at the stop rather than the target.
- Two filters cut the loss per trade by 42 percent, but they removed 95 percent of the signals to do it.
- Those filters worked strongly in 2018 and 2019, then got worse every period since.
What Is A Fair Value Gap?
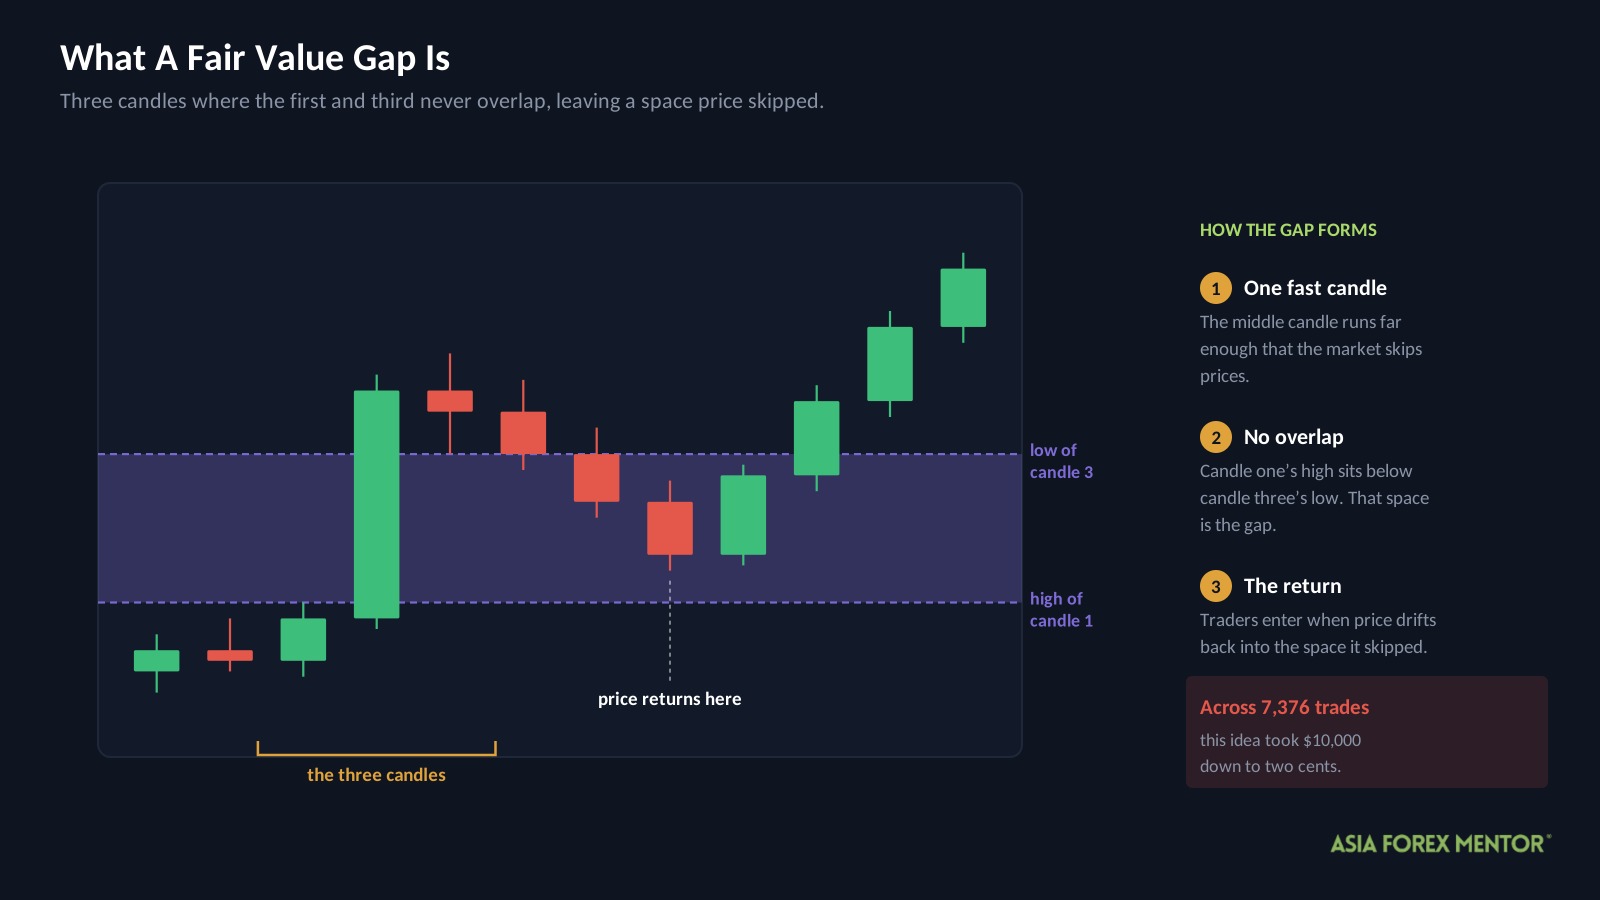
A fair value gap is a space on the chart that price moved through too quickly to trade in properly.
It forms across three candles. The middle one runs so far that the wick of the candle before it and the wick of the candle after it never overlap, which leaves a visible gap between them.
The reasoning is that the market skipped past those prices. Buyers and sellers never settled there, so the thinking goes that price will come back to fill in what it missed before continuing.
How Do Most Traders Trade FVG?
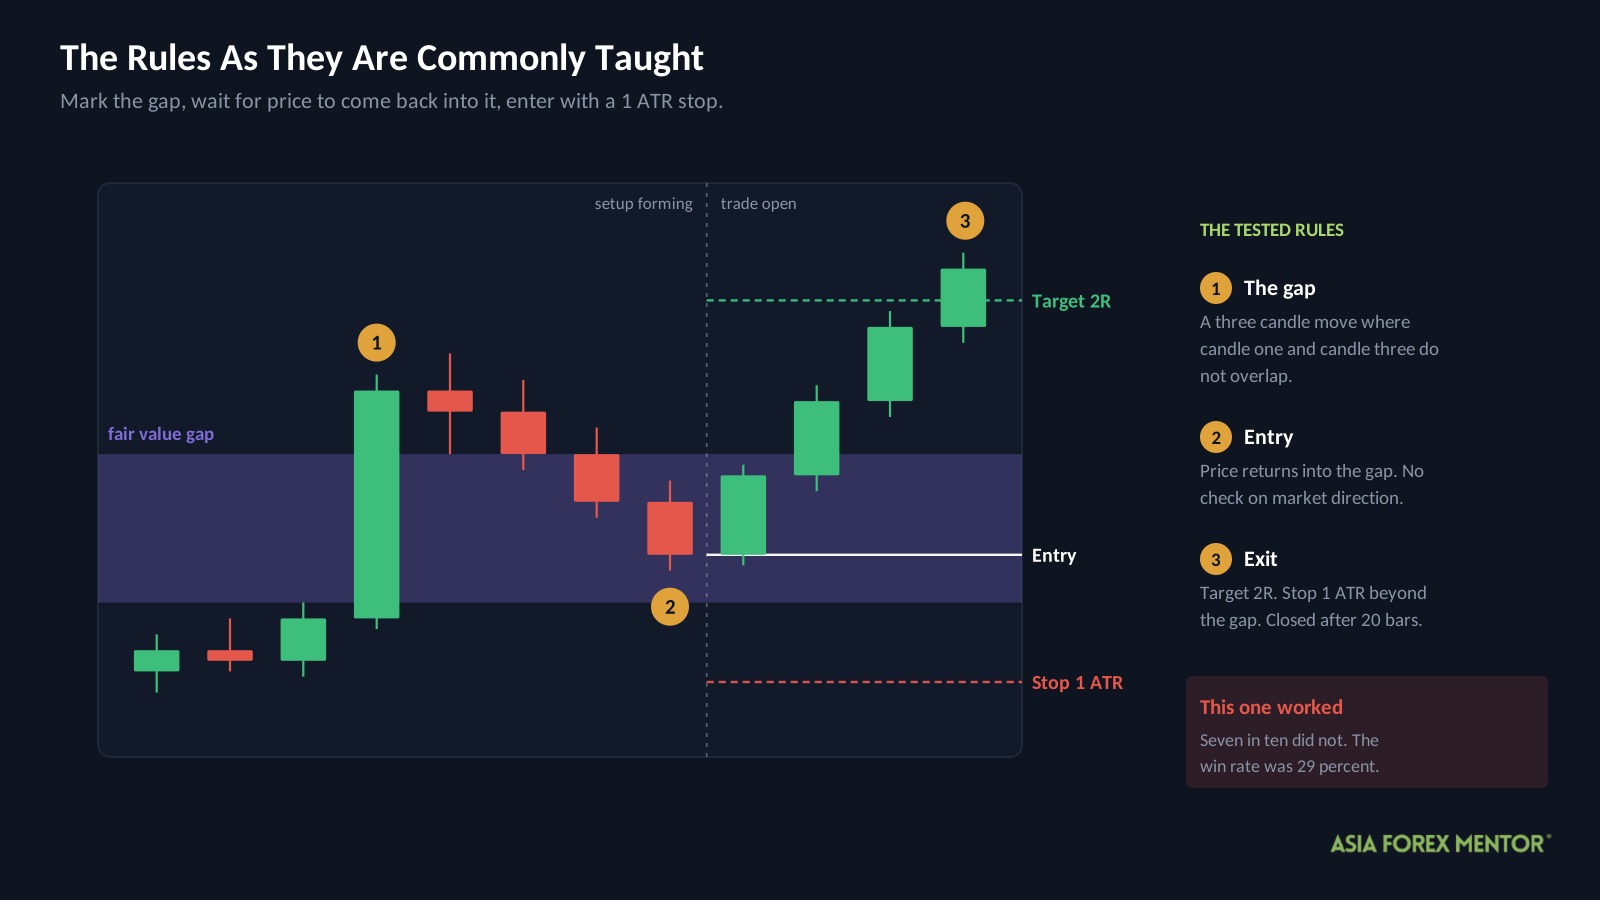
They wait for the gap to form, then enter when price drifts back into it.
Two terms you need first.
R is what you risk on one trade, measured from entry to stop. On a $10,000 account risking 1 percent, 1R is $100, so a 2R target aims for $200.
ATR means Average True Range, which is how far a pair usually moves in a day. A stop set in ATR sizes itself to each pair rather than using the same pip distance everywhere.
Here are the rules exactly as we tested them.
| Rule | Setting |
|---|---|
| Chart | Daily |
| Setup | A three candle move where the first and third wicks do not overlap |
| Entry | When price returns into the gap |
| Stop loss | 1 ATR beyond the gap |
| Target | 2R |
| Time exit | Close after 20 bars if neither stop nor target is reached |
| Direction filter | None |
Notice the last row. The textbook version takes gaps in either direction with nothing checking whether the broader market agrees. That turns out to matter.
Why Did The Textbook Version Lose Everything?
| Metric | Textbook |
|---|---|
| Trades | 7,376 |
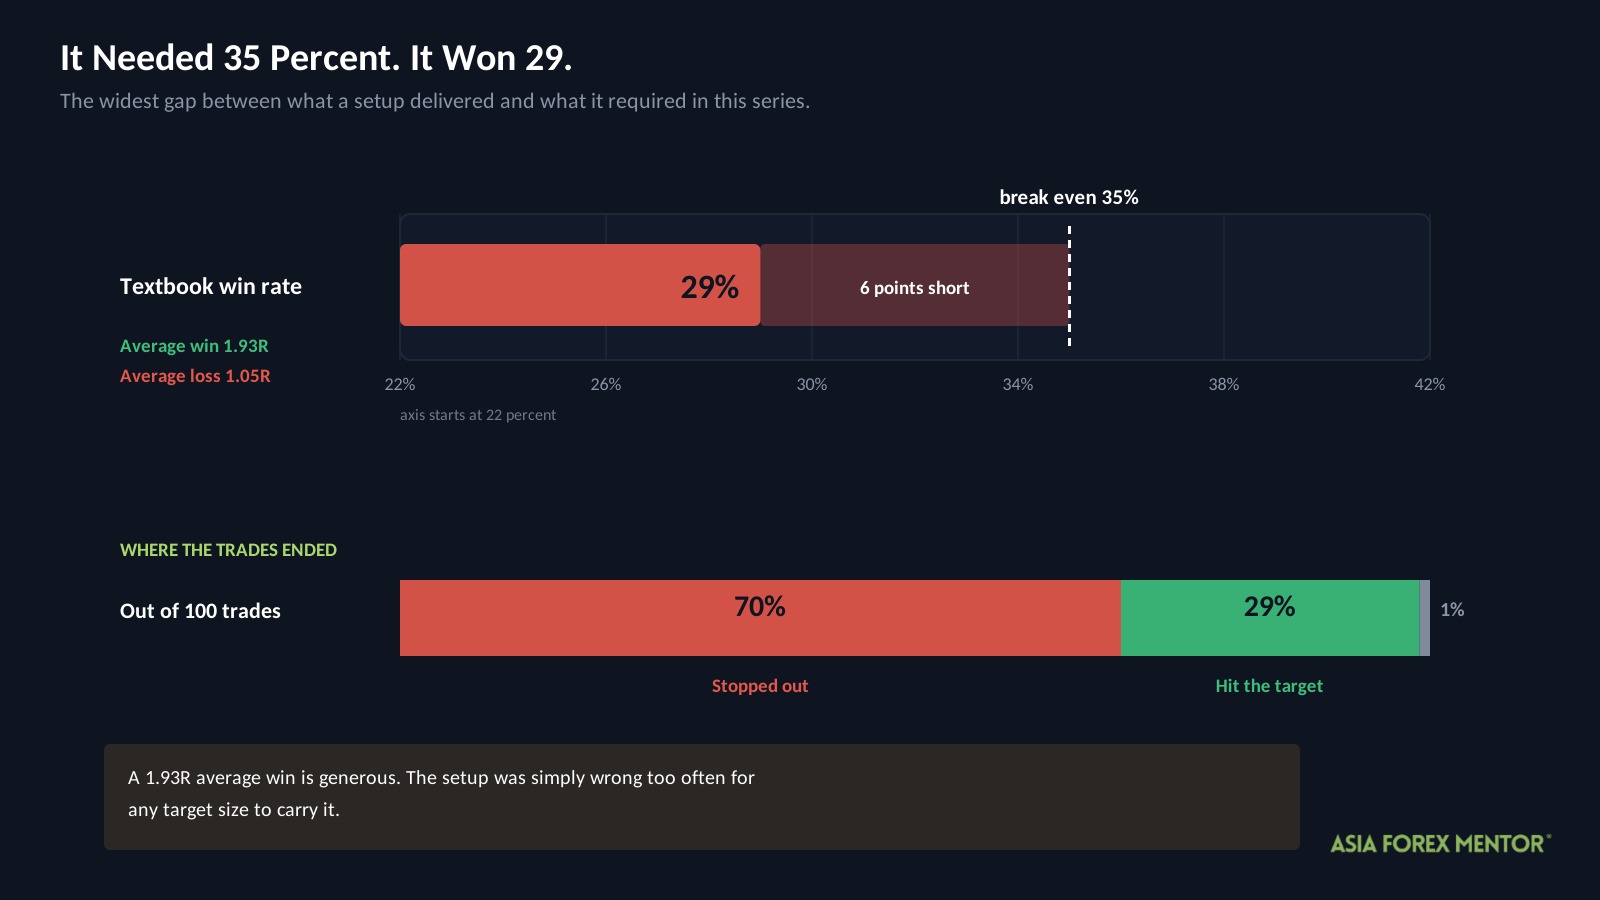
| Win rate | 29% |
| Average win | +1.93R |
| Average loss | -1.05R |
| Expectancy | -0.17R |
| Profit factor | 0.77 |
| Yearly growth rate | -79.7% |
| Max drawdown | 100.0% |
| Ending balance from $10,000 | $0.02 |
Three of those need defining.
Expectancy is what the average trade earns or loses, in R. At minus 0.17R, every trade cost about a sixth of what it risked, and 7,376 of those is how an account reaches two cents.
Profit factor is total winnings divided by total losses. Below 1 means the strategy lost money, so 0.77 says it paid out $1.30 for every dollar it took in.
Yearly growth rate, often written as CAGR, is the average rate the account changed each year. At minus 79.7 percent a year, compounding over eight years, almost nothing survives.
Now the arithmetic. The average win was 1.93R and the average loss 1.05R, so this setup needed to win about 35 percent of the time just to break even.
It won 29 percent.
Six points is the widest gap in anything we have tested, and the exit mix shows where it came from. About seven trades in ten closed at the stop, just under three in ten reached the target, and the rest timed out.
The 1.93R average win is actually generous. The problem is that the setup was simply wrong too often for any target size to rescue it.
What Did We Change?
The entry, stop and target were left alone. The AFM Research Lab added two conditions that decide whether a gap gets traded at all.
| Filter | Condition | The idea behind it |
|---|---|---|
| Volatility band | 14 day ATR between the 30th and 40th percentile of its past year | Trade only in quiet but active conditions |
| Trend strength | ADX(14) at 25 or above | Skip markets with no direction |
ADX means Average Directional Index, a reading from 0 to 100 that measures how strong a move is without saying which way it points. Above 25 generally means a trend is in place.
A percentile here just means a ranking. If today’s ATR sits at the 35th percentile, it was higher than 35 percent of the readings over the past year.
Note how narrow that first band is. Only ten percentile points qualify, which is the tightest filter in this series.
One caution before the results. These settings were chosen by searching the test history, which has a name, in sample optimization, so treat the improvement as the best case rather than a proven one.
Did The Filters Work?
They cut the damage substantially, and they removed almost everything.
| Metric | Textbook | Filtered |
|---|---|---|
| Trades | 7,376 | 360 |
| Win rate | 29% | 32% |
| Expectancy | -0.10R | |
| Loss per 100 trades | -16.9R | -9.8R |
| Profit factor | 0.77 | 0.86 |
| Max drawdown | 100.0% | 41.5% |
| Ending balance from $10,000 | $0.02 | $6,779 |
The loss per trade fell by 42 percent and the worst fall dropped from effectively total to 41.5 percent. Both are large improvements.
However, the filters removed 95 percent of the signals to achieve them. The strategy went from 7,376 trades to 360, which is about 44 trades a year across all 28 pairs combined.
That works out to roughly one and a half trades per pair per year. A setup firing that rarely is not a strategy you trade, it is a strategy you wait for.
Comparing the two fairly means holding the risk constant. Scaled so that both suffered the same 41.5 percent worst fall, the textbook version finishes at $5,864 against the filtered version’s $6,779.
Did It Hold In Every Period?
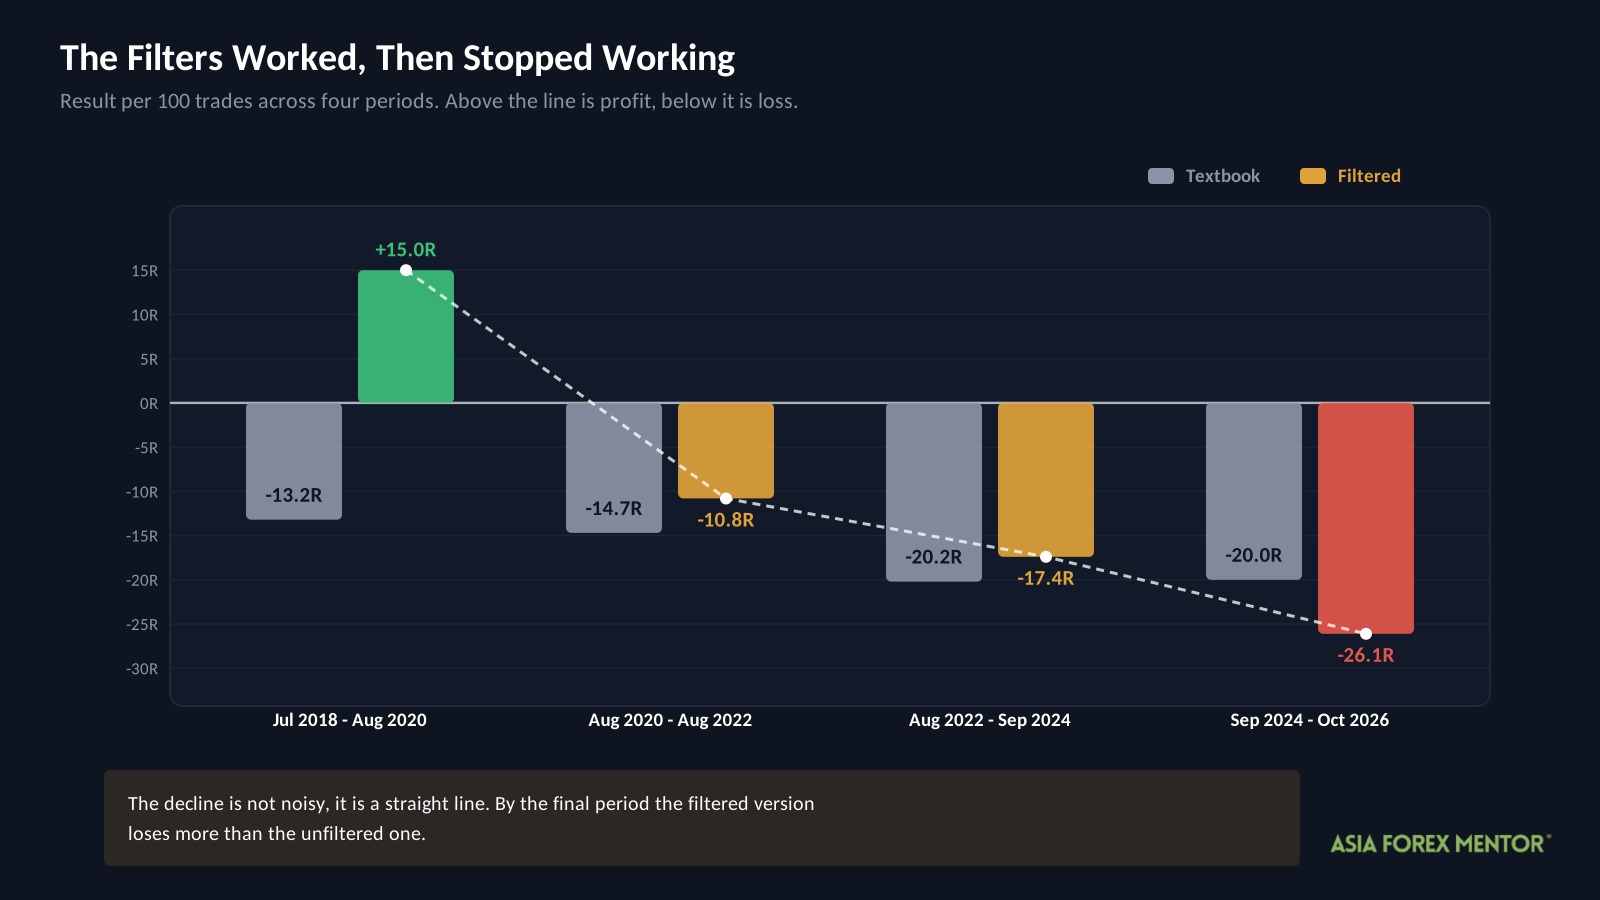
The eight years were split into four periods and both versions scored in each. This is called walk forward testing, and it checks whether a result is steady or driven by one stretch.
| Period | Textbook per 100 | Filtered per 100 | Filtered drawdown | Trades |
|---|---|---|---|---|
| Jul 2018 to Aug 2020 | -13.2R | +15.0R | 8.6% | 85 |
| Aug 2020 to Aug 2022 | -14.7R | -10.8R | 15.6% | 95 |
| Aug 2022 to Sep 2024 | -20.2R | -17.4R | 25.1% | 104 |
| Sep 2024 to Oct 2026 | -20.0R | -26.1R | 18.4% | 76 |
Read that filtered column top to bottom. Plus 15.0, then minus 10.8, then minus 17.4, then minus 26.1.
The decline is not noisy, it is a straight line. Whatever the filters were catching in 2018 and 2019, it has been fading ever since, and by the final period they lose more than the unfiltered version does.
That single positive period is also where the whole filtered result comes from. Strip it out and the remaining six years are consistently negative.
One more limit. The filters were chosen using this same history, so these periods are a consistency check rather than an independent test.
What About The Pairs?
USDHKD produced the highest expectancy in the filtered version at plus 0.95R per trade, with CADJPY second at plus 0.47R.
USDHKD needs a warning. It is a pegged pair, held inside a narrow band by policy rather than by market forces, so it behaves nothing like the pairs most people trade.
More importantly, no pair held up across both halves of the data. Picking from this list would be fitting to the past rather than finding an edge.
What Did A Winning Trade Look Like?
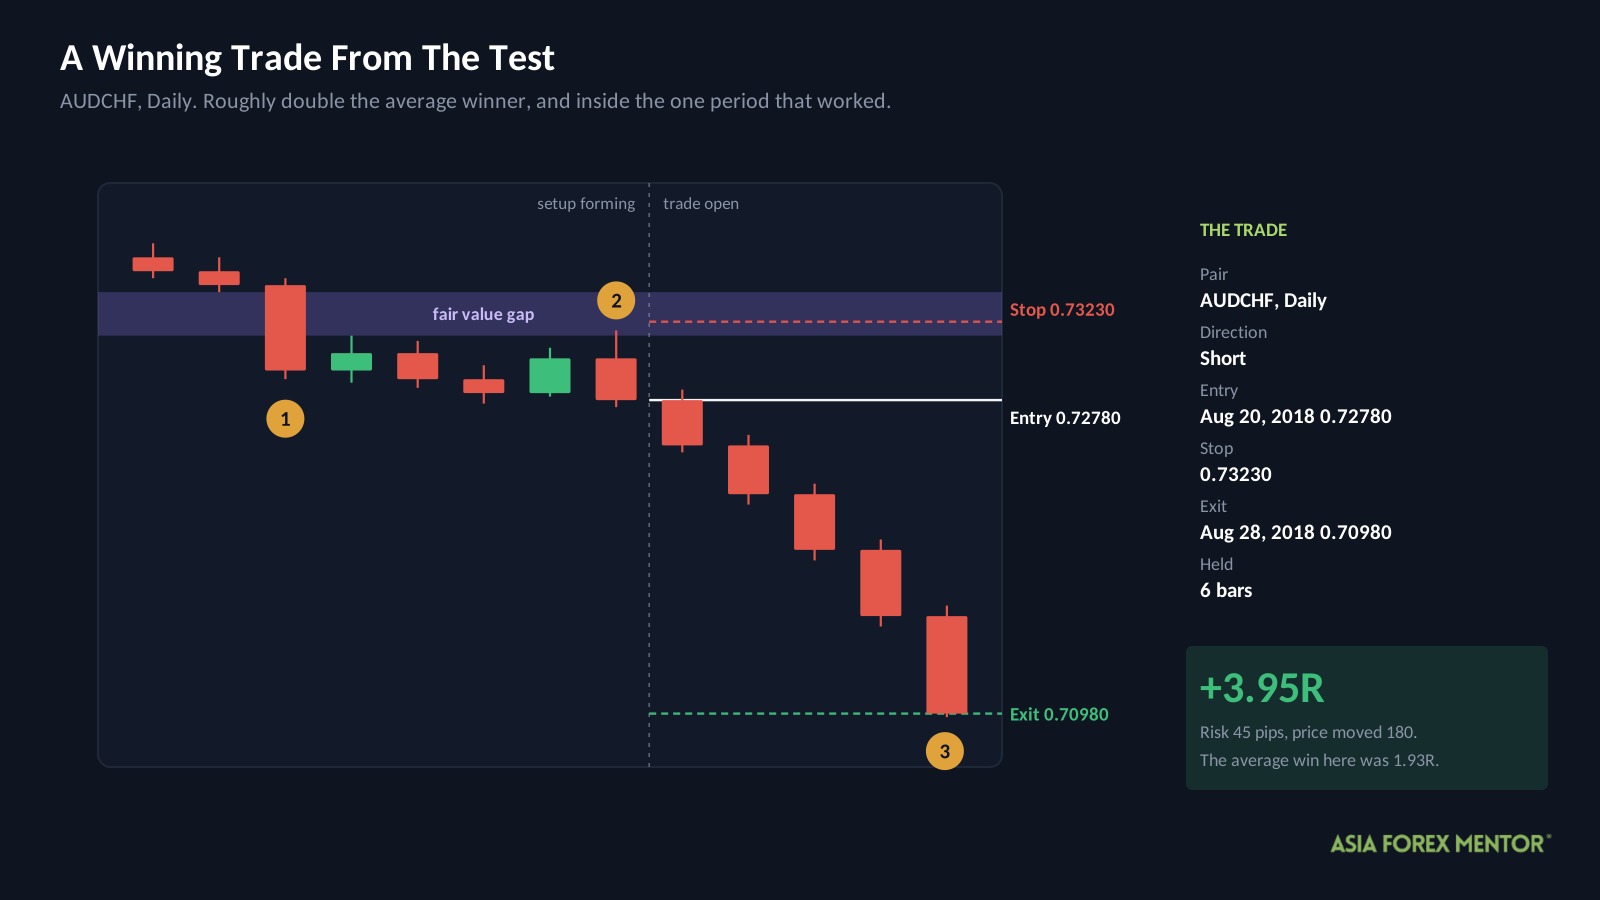
This is a real trade from the filtered sample, and it is far above average.
| Detail | Value |
|---|---|
| Pair and chart | AUDCHF, Daily |
| Direction | Short |
| Entry | August 20, 2018 at 0.72780 |
| Stop | 0.73230 |
| Exit | August 28, 2018 at 0.70980 |
| Result | +3.95R in 6 bars |
A fast three candle move had left a gap above price. Price drifted back into it, triggering the short, and the stop sat 1 ATR above the gap.
The risk was 45 pips and price travelled 180 pips. Set that against the filtered version’s average win of 1.93R, and this trade paid roughly double the usual winner.
It also falls inside that first period, the one stretch where this setup worked at all.
What Should You Take From This?
Not a trading plan. Three things worth keeping, though.
- Work out the break-even win rate before you trade anything. Divide the average loss by the sum of the average win and the average loss.
- A six point shortfall is fatal. This setup won 29 percent against a 35 percent requirement, and no target size fixes being wrong that often.
- Check whether a filter’s improvement is spread across time or concentrated in one stretch. Here it sat almost entirely in 2018 and 2019.
That last point is the one worth carrying into every backtest you read. An average across four periods looks reassuring. Four periods that run plus 15, minus 10.8, minus 17.4, minus 26.1 tell you something the average hides completely.
Before testing any of this with real money, read about risk management and size accordingly.
Is FVG Trading Worth Your Time?
Not as it is taught, and 7,376 trades is a large enough sample to say so without hedging.
- The textbook rules lost effectively the whole account, winning 29 percent against a 35 percent break-even requirement.
- Two filters cut the loss per trade by 42 percent, but they removed 95 percent of the signals and left only 44 trades a year.
- The filtered improvement declined every period and reversed entirely by 2024, where it lost more than the unfiltered version.
The underlying observation is not wrong. Price does often revisit areas it moved through quickly, and that idea sits underneath plenty of serious work on market structure.
What fails is the mechanical version: any three candle gap, entered on any return, with a fixed 1 ATR stop and no check on direction. The setup has no way of knowing whether a gap is a pause or the start of something.
If you are already trading this, the number to check is your own. Work out your average win and average loss, find your break-even win rate, and see which side of it you are on.
Also Read: ICT Order Block, How To Identify And Trade Them
Frequently Asked Questions
Does FVG Trading Work In Forex?
Not in this test. The AFM Research Lab ran it across 7,376 trades and 8.3 years of Daily data, and $10,000 finished at roughly two cents. A filtered version lost less but still ended at $6,779.
What Is A Fair Value Gap?
It is a space left on the chart when one candle moves so far that the wicks either side of it do not overlap. Traders treat that space as prices the market skipped, and expect price to return to it.
What Win Rate Does FVG Trading Need?
About 35 percent, given an average win of 1.93R against an average loss of 1.05R. The textbook version won 29 percent, which is the widest shortfall in any setup we have tested.
Can Filters Make FVG Trading Profitable?
Not on this data. An ATR band and a minimum ADX reading cut the loss per trade by 42 percent and the worst fall to 41.5 percent, but the account still finished below where it started.
How Often Does The Filtered FVG Setup Trade?
About 44 times a year across all 28 pairs, which is roughly one and a half trades per pair per year. The filters removed 95 percent of the signals the textbook version took.
Why Did The Textbook Version Lose So Much?
Because it was wrong about seven times out of ten and needed to be wrong closer to six and a half. Compounding that shortfall across 7,376 trades is what reduces $10,000 to pennies.