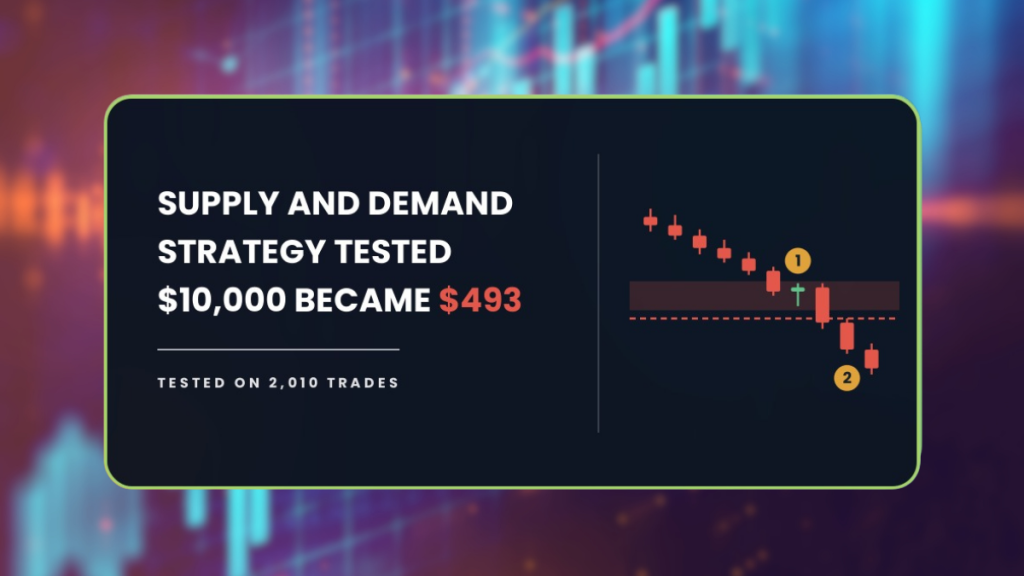
The supply and demand strategy is taught in more free trading videos than almost any other setup. We ran it across 2,010 trades and 8.3 years of Daily data, and $10,000 finished at $493. The account lost 95 percent of its value on the way there.
| About This Guide |
|---|
| This guide explains what a supply and demand zone is, the exact rules we put through the AFM Research Lab, and what happened across 28 forex pairs and 8.3 years of Daily data. You will finish knowing why the setup lost money, what one filter changed, and what it would take to make this tradable at all. |
| Quick Answer |
|---|
| The supply and demand strategy waits for price to return to a zone it previously left in a hurry, then enters on a rejection candle. In the AFM Research Lab it lost money across 2,010 trades on 28 forex pairs, ending at $493 from $10,000. A volatility filter reduced the loss but did not fix it. |
What Happened When We Tested The Supply And Demand Strategy
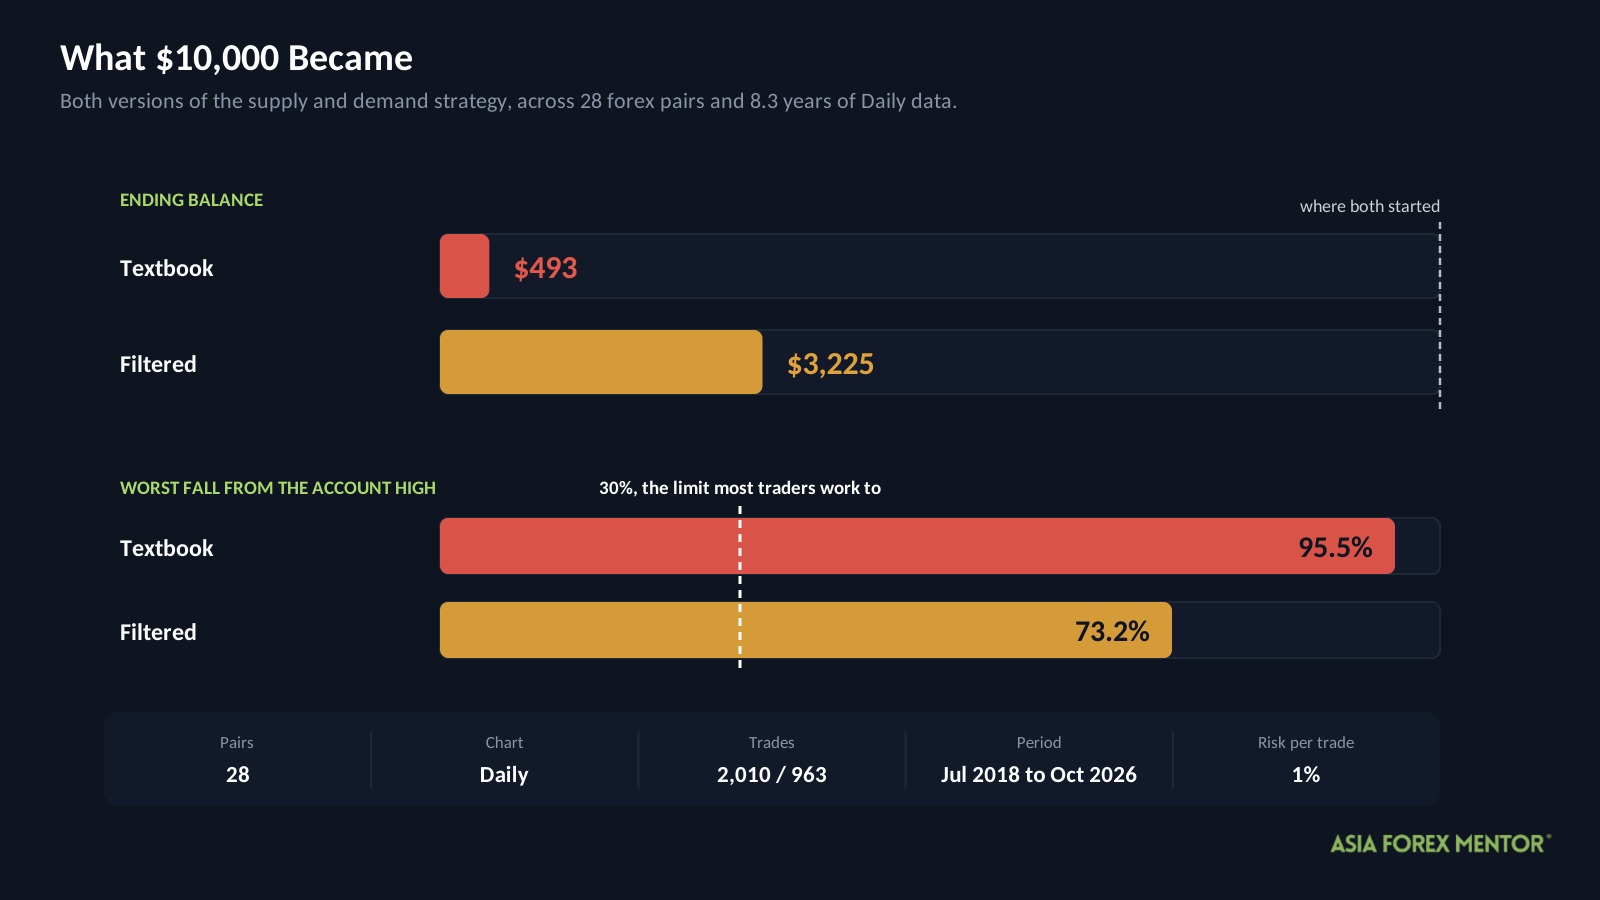
Two accounts, both starting at $10,000. One traded the rules as they are commonly taught. The other added a single filter from the AFM Research Lab.
Both lost money. One lost almost all of it.
| Version | Start | End | Max drawdown | Trades |
|---|---|---|---|---|
| Textbook | $10,000 | $493 | 95.5% | 2,010 |
| Filtered | $10,000 | $3,225 | 73.2% | 963 |
Drawdown is how far an account falls from its highest point. In other words, it is not your overall loss, it is the size of the worst slide from a peak to the low that followed.
Most traders treat 30 percent as the limit of what is survivable. Neither version came close to that, so neither is tradable as written.
The test ran from July 12, 2018 to October 22, 2026, across 28 currency pairs on the Daily chart. Each trade risked 1 percent of the account, and trading costs were charged at 0.05 percent of the entry price per round trip.
These are backtest results. Backtesting is not live trading, and past results do not guarantee future performance.
Key Takeaways
- The textbook rules lost money across 2,010 trades, ending at $493 from a $10,000 start.
- The worst fall was 95.5 percent, which is far beyond anything a real account could survive.
- The setup needed a 38 percent win rate to break even, and it managed 33.
- A volatility filter cut the loss per trade by 23 percent, but the account still finished at $3,225 with a 73.2 percent drawdown.
- In the most recent period, 2024 to 2026, the filtered version lost more per trade than the textbook did.
What Is A Supply And Demand Zone?
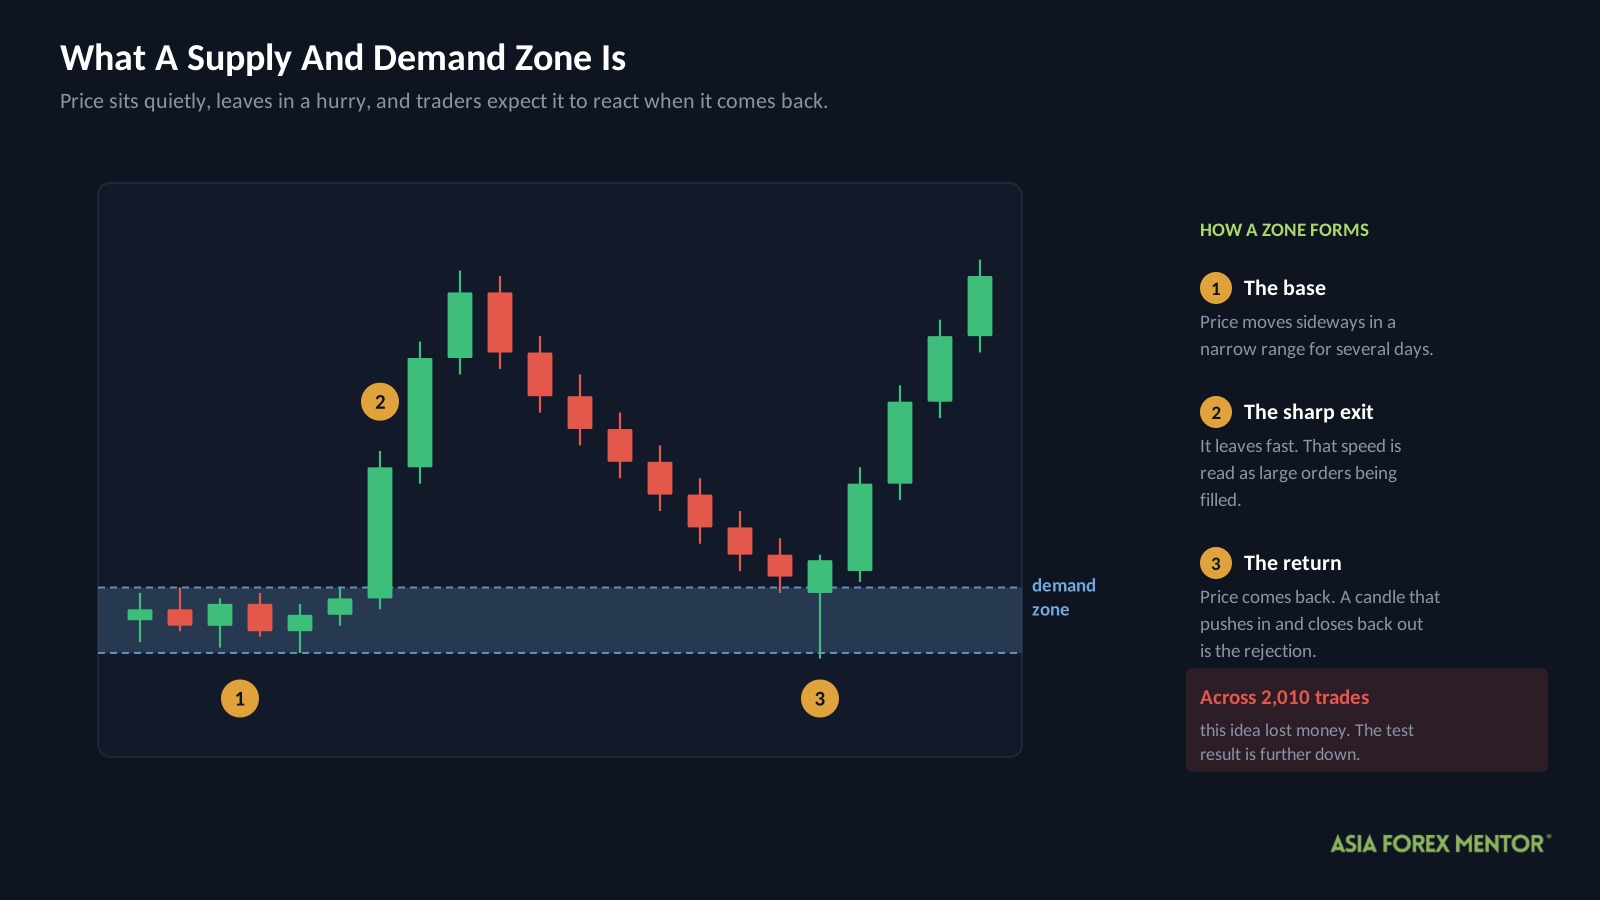
A supply and demand zone is a price area the market left in a hurry. Price sits quietly for a while, then moves away sharply, and traders read that sudden exit as a sign that large orders were sitting there.
The idea is that those orders have not all been filled. So when price comes back to the same area, the thinking goes, the remaining orders push it away again.
A demand zone sits below price and is expected to push it up. A supply zone sits above price and is expected to push it down.
How Do Most Traders Trade Supply And Demand?
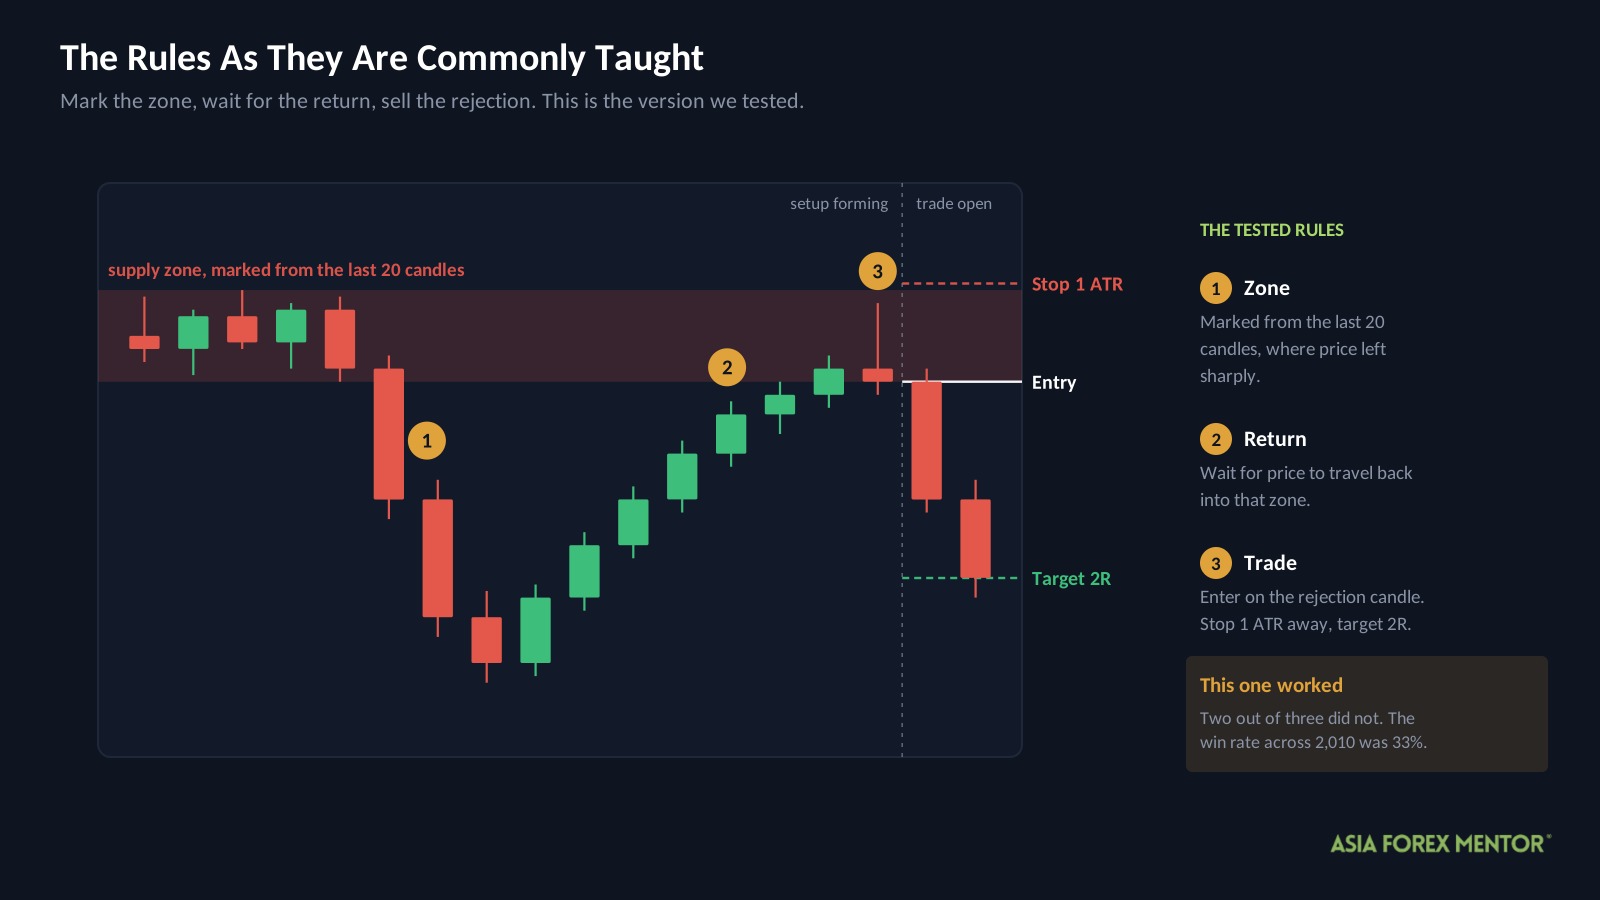
They mark the zone, wait for price to return, and enter when a candle rejects the level.
A rejection candle is one that pushes into the zone and then closes back out of it. For example, price dips into a demand zone during the day but closes near the top of its range, leaving a long tail below.
Two terms you need before the results.
R is what you risk on one trade, measured from entry to stop. On a $10,000 account risking 1 percent, 1R is $100, so a 2R target aims for $200.
ATR means Average True Range, which is how much a pair usually moves in a day. A stop set in ATR sizes itself to each pair instead of using the same pip distance everywhere.
Here are the rules exactly as we tested them.
| Rule | Setting |
|---|---|
| Chart | Daily |
| Zone | Marked from the last 20 candles |
| Trigger | Price re-enters the zone |
| Entry | On a rejection candle at the zone edge |
| Stop loss | 1 times the 14 day ATR from entry |
| Target | 2R |
| Risk per trade | 1 percent of the account |
That is the version taught almost everywhere, and it is the version that produced the $493.
Why Did The Textbook Version Lose So Much?
| Metric | Textbook |
|---|---|
| Trades | 2,010 |
| Win rate | 33% |
| Average win | +1.62R |
| Average loss | -1.01R |
| Expectancy | -0.14R |
| Profit factor | 0.79 |
| Yearly growth rate | -30.5% |
| Max drawdown | 95.5% |
| Ending balance from $10,000 | $493 |
Three of those need defining.
Expectancy is what the average trade earns or loses, in R. At minus 0.14R, every single trade cost about a seventh of what it risked, and 2,010 of those is how an account reaches $493.
Profit factor is total winnings divided by total losses. Below 1 means the strategy lost money, so 0.79 says it paid out $1 for every 79 cents it took in.
Yearly growth rate, often written as CAGR, is the average rate the account changed each year. At minus 30.5 percent a year, compounding over eight years, $10,000 becomes $493.
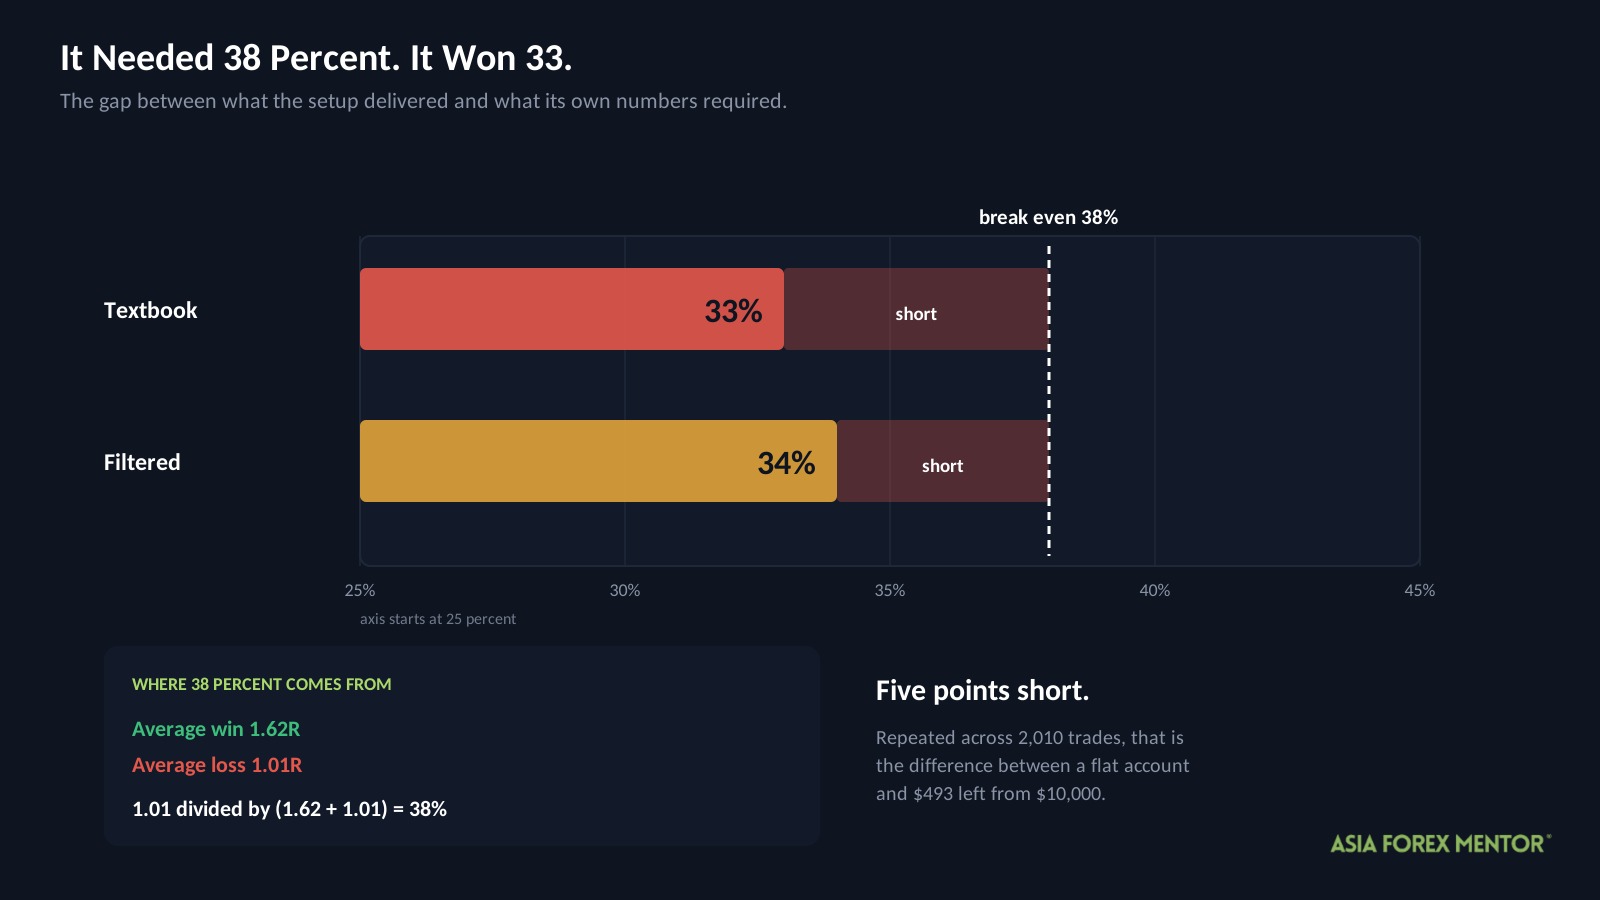
Now the arithmetic that explains all of it. The average win was 1.62R and the average loss 1.01R, so this setup needed to win about 38 percent of the time just to break even.
It won 33 percent.
Five points does not sound like much. However, applied across 2,010 trades it is the difference between a flat account and almost nothing left. The strategy was never slightly wrong, it was consistently on the wrong side of its own break-even line.
Can A Filter Fix It?
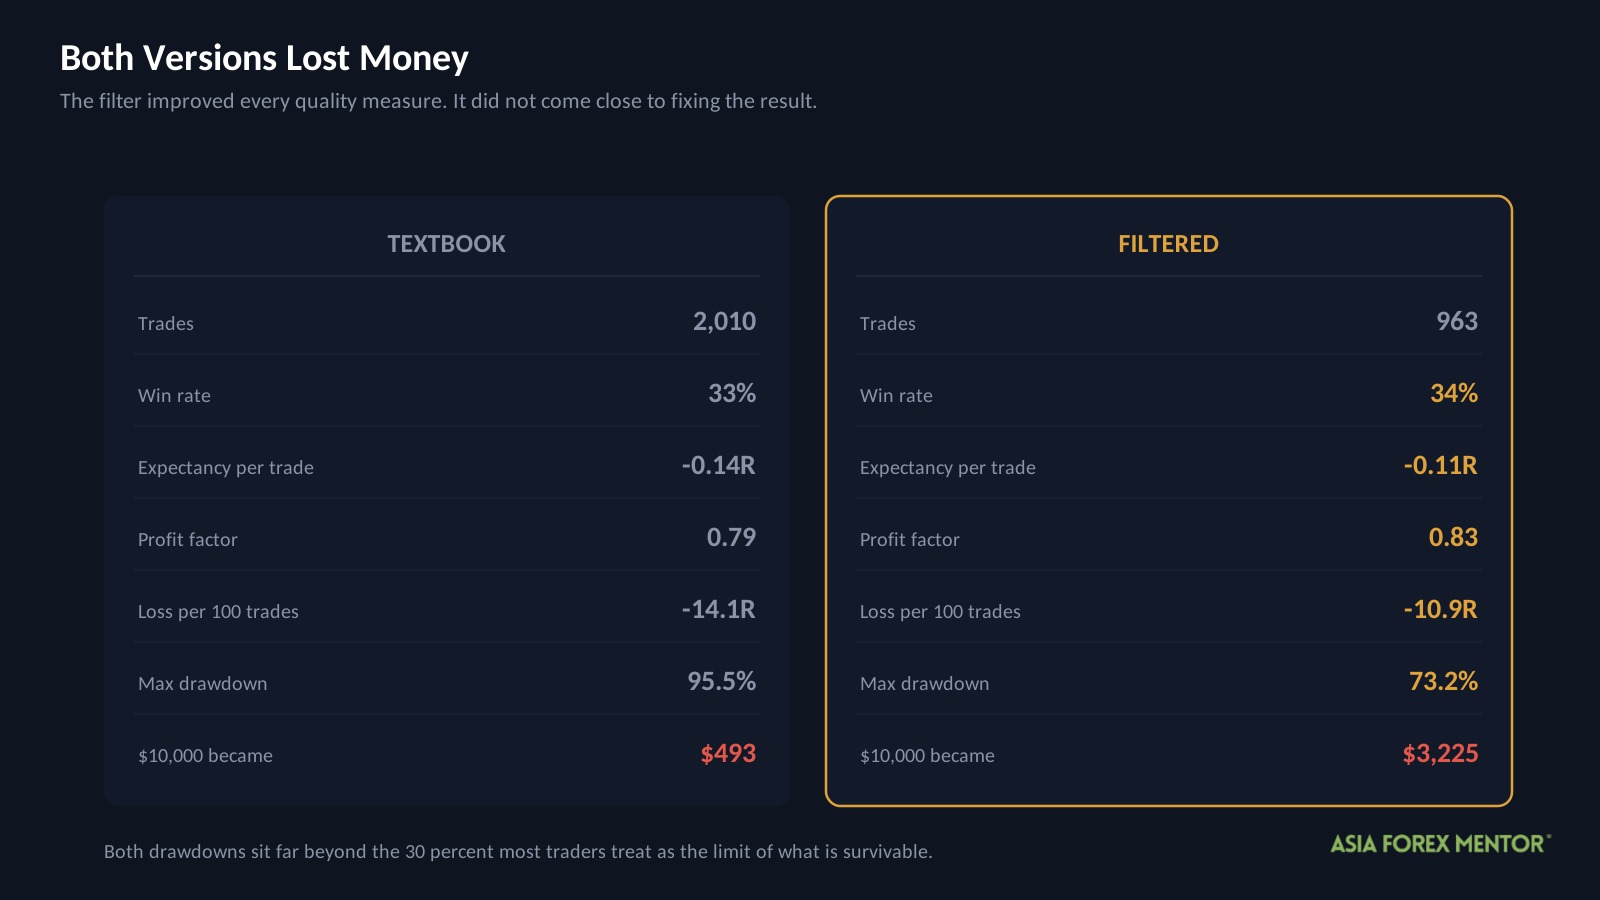
The AFM Research Lab added one condition and left the entry, stop and target untouched.
| Filter | Condition | The idea behind it |
|---|---|---|
| Volatility | 14 day ATR in the top half of its own past year | Skip the quiet markets where price drifts into the stop |
The reasoning is sound. Quiet markets produce small, choppy moves that clip a stop before reaching a 2R target, so removing them should lift the average trade.
It did, and it was not close to enough.
| Metric | Textbook | Filtered |
|---|---|---|
| Trades | 2,010 | 963 |
| Win rate | 33% | 34% |
| Expectancy | -0.14R | -0.11R |
| Profit factor | 0.79 | 0.83 |
| Max drawdown | 95.5% | 73.2% |
| Ending balance from $10,000 | $493 | $3,225 |
Measured per hundred trades, the textbook version lost 14.1R and the filtered version lost 10.9R. That is 23 percent less lost, with a 73.2 percent drawdown rather than a 95.5 percent one.
Losing less is still losing. The filtered win rate reached 34 percent against the same 38 percent break-even line, so the gap narrowed by one point and never closed.
One more caution. These filter settings were chosen by searching the test history, which has a name, in sample optimization. The real world does not hand you the best setting in advance, so treat even this modest improvement as the optimistic case.
Did The Result Hold In Every Time Period?
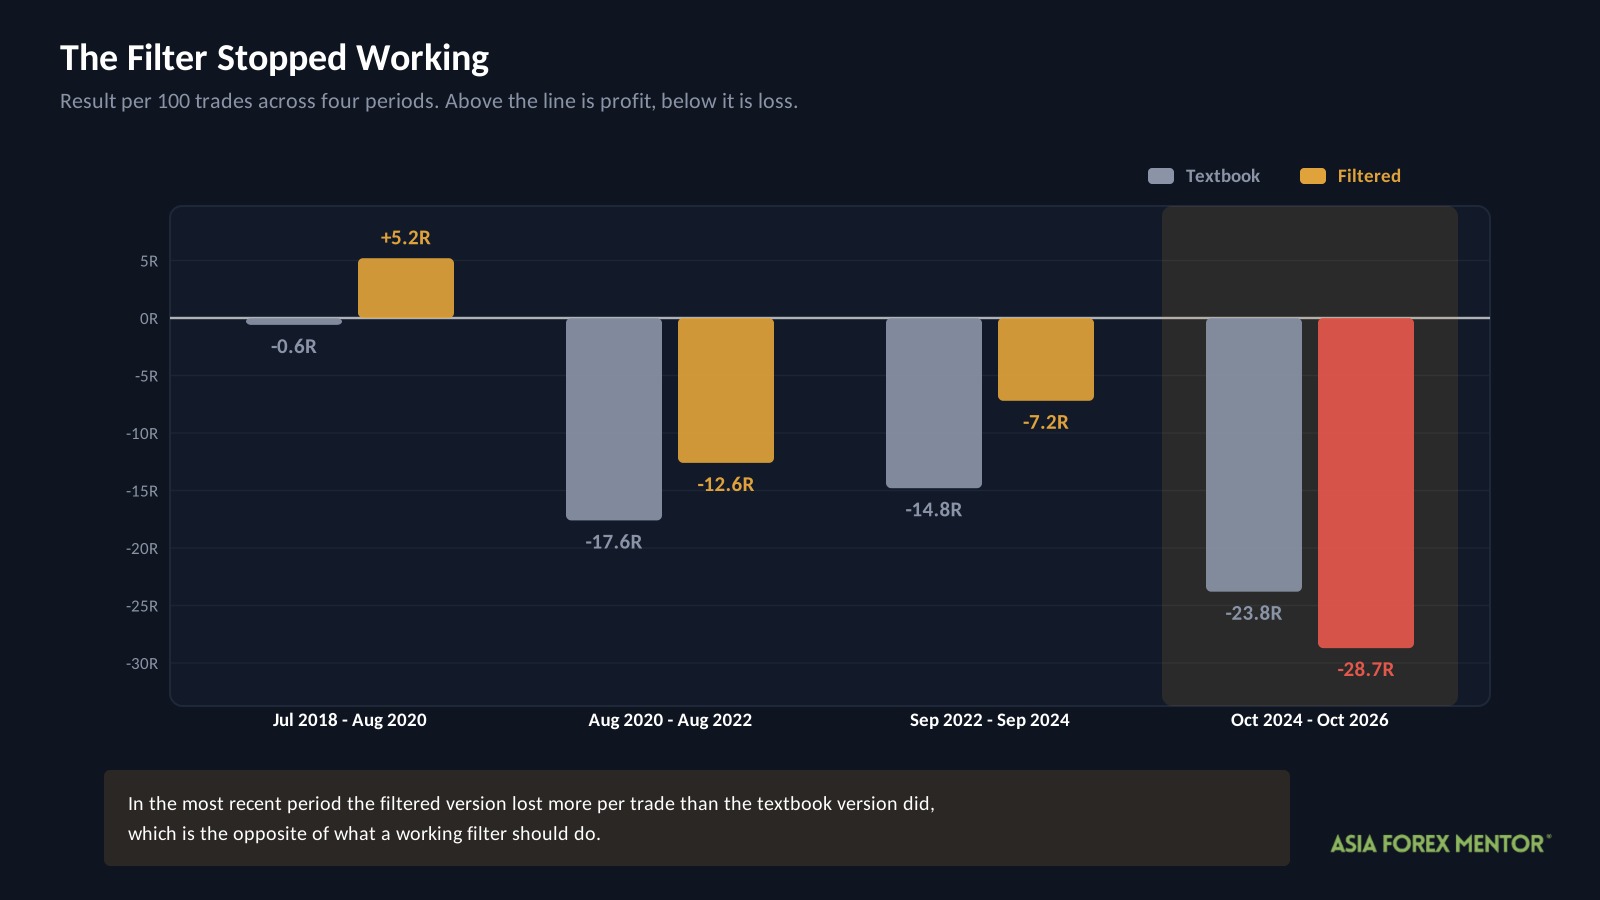
The eight years were split into four periods and the filtered rules scored in each. This is called walk forward testing, and it checks whether a result is steady or driven by one unusual stretch.
| Period | Trades | Win rate | Expectancy | Max drawdown |
|---|---|---|---|---|
| Jul 2018 to Aug 2020 | 246 | 40% | +0.05R | 24.6% |
| Aug 2020 to Aug 2022 | 299 | 33% | -0.13R | 42.0% |
| Sep 2022 to Sep 2024 | 185 | 36% | -0.07R | 26.9% |
| Oct 2024 to Oct 2026 | 233 | 28% | -0.29R | 53.7% |
One period positive, three negative, and the worst one is the most recent.
That last row deserves attention. Between October 2024 and October 2026 the filtered version lost 28.7R per hundred trades, while the unfiltered textbook version lost 23.8R over the same stretch.
In other words, the filter made things worse in the only period that resembles today’s market. Whatever edge it had in 2018 and 2019 is not visible in the recent data.
What About The Pairs?
USDHKD, CHFJPY and USDJPY produced the only positive expectancy in the filtered version. USDHKD led with plus 0.42R across 57 trades.
That figure needs a warning. USDHKD is a pegged pair, held inside a narrow band by policy rather than by market forces, so it behaves nothing like the pairs most people trade.
More importantly, no pair held up across both halves of the data. The pairs that worked early were not the pairs that worked late, which means picking winners from this list would be fitting to the past rather than finding an edge.
What Did A Winning Trade Look Like?
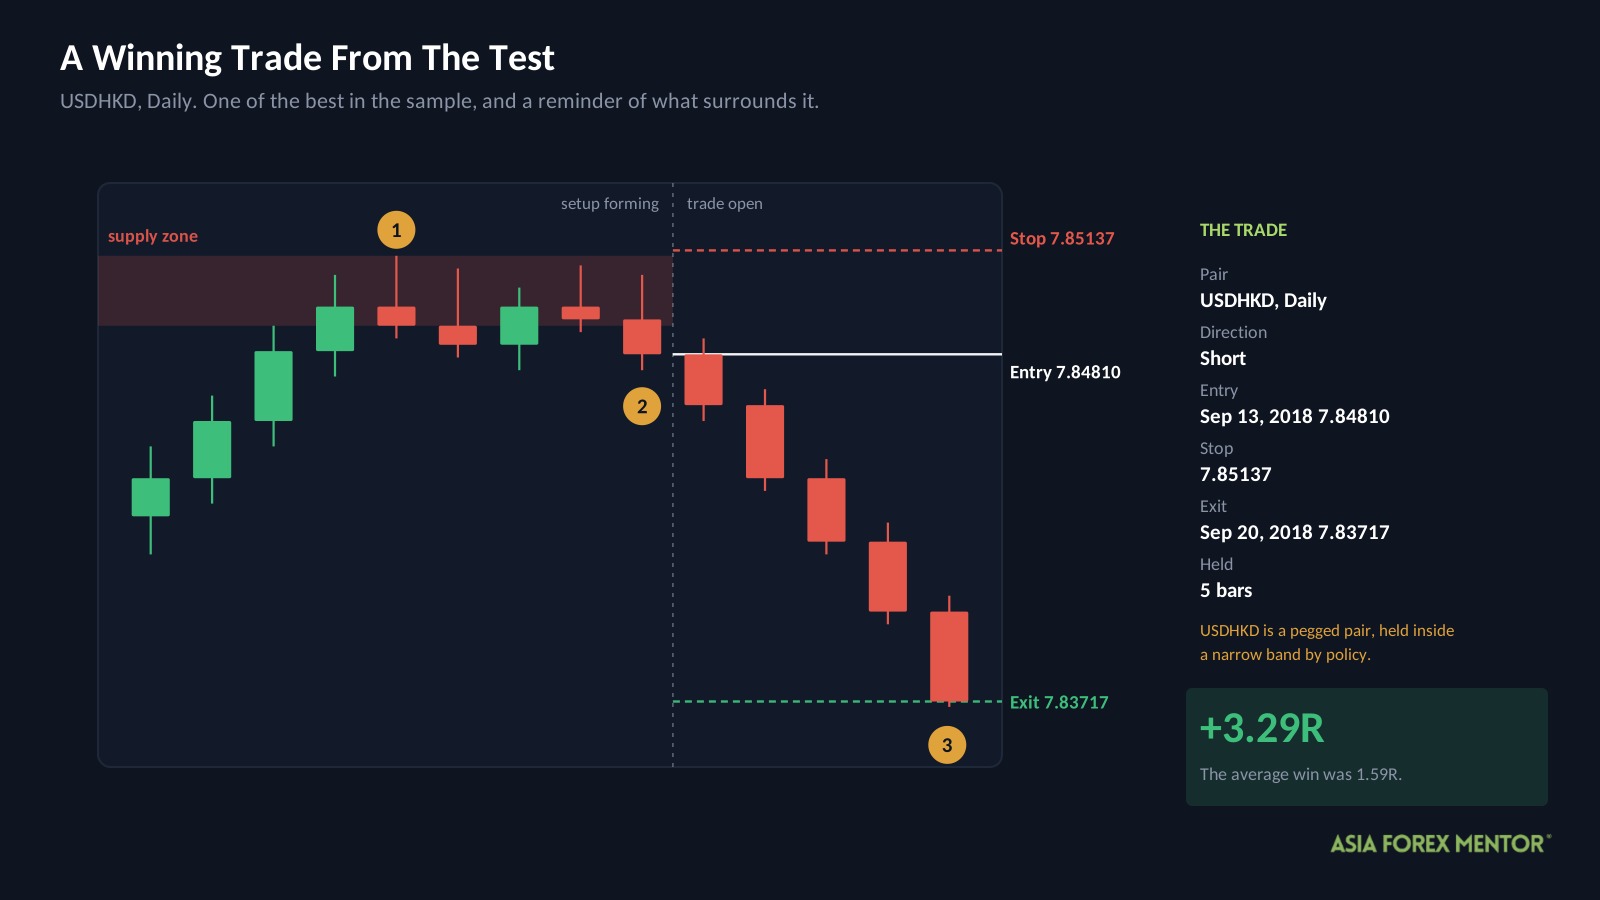
This is a real trade from the filtered sample, and it is the exception rather than the pattern.
| Detail | Value |
|---|---|
| Pair and chart | USDHKD, Daily |
| Direction | Short, meaning a sell |
| Entry | September 13, 2018 at 7.84810 |
| Stop | 7.85137 |
| Exit | September 20, 2018 at 7.83717 |
| Result | +3.29R in 5 bars |
A supply zone had formed above price, price returned to it, and a rejection candle triggered the short. Volatility was elevated at the time, so the filter allowed the trade.
The risk was 33 points and price travelled 109 points in the right direction. Set that against the filtered version’s average win of 1.59R, and this trade paid more than twice what a typical winner did.
It is worth remembering what surrounds it. For every trade like this one, the sample contains roughly two losers, which is exactly why the account still ended at $3,225.
What Should You Take From This?
Not a trading plan. The useful part of this test is the arithmetic, because it applies to every setup you will ever be shown.
- Write down the average win and average loss of any strategy you are considering.
- Divide the average loss by the sum of both. That is your break-even win rate.
- Compare it against the win rate being advertised.
- If the gap is under five points, the strategy has no margin for spread, slippage or a bad month.
Run that check on the supply and demand numbers and the answer appears in seconds. A 1.62R average win against a 1.01R average loss needs 38 percent, and the setup delivered 33.
Most strategies fail this test before you place a single trade. Learning to run it is worth more than any individual setup, and it costs you nothing but a minute.
If you want a structure for finding zones that does hold up to scrutiny, start with market structure instead, and read about risk management before testing anything with real money.
Is The Supply And Demand Strategy Worth Your Time?
None of this means zones are meaningless. Price does react at levels where it previously moved sharply, and that observation is the foundation of a lot of serious price action work.
What it means is that the popular packaging of that idea, a 20 candle zone with a 1 ATR stop and a 2R target, does not survive contact with 2,010 trades. The concept may be sound while the mechanical version of it is not.
If you are currently trading this setup, the one number to check is your own. Work out your average win and average loss, find your break-even win rate, and see whether you are above or below it.
Also Read: ICT Order Block, How To Identify And Trade Them
Frequently Asked Questions
Does The Supply And Demand Strategy Work In Forex?
Not in this test. The AFM Research Lab ran it across 2,010 trades and 8.3 years of Daily data, and $10,000 finished at $493. The account fell 95.5 percent from its high point along the way.
What Is A Supply And Demand Zone?
It is a price area the market left in a hurry after sitting quietly. Traders read that sudden move as evidence that large orders were resting there, and expect price to react again when it returns.
What Win Rate Does The Supply And Demand Strategy Need?
About 38 percent, given an average win of 1.62R against an average loss of 1.01R. The textbook version won 33 percent, which is why it lost money consistently rather than occasionally.
Can A Volatility Filter Make Supply And Demand Profitable?
Not on this data. Requiring elevated ATR cut the loss per trade by 23 percent and reduced the worst fall from 95.5 percent to 73.2 percent, but the account still lost most of its value.
Why Did The Supply And Demand Strategy Lose So Much?
Because it missed its own break-even line in every period tested. A five point shortfall sounds small, however compounding it across 2,010 trades is what turns $10,000 into $493.
Are Supply And Demand Zones Useless Then?
No, but the mechanical version tested here is. Price does react at levels it previously left sharply, and that idea underpins a lot of serious price action work. The 20 candle zone with a fixed 1 ATR stop is what failed.