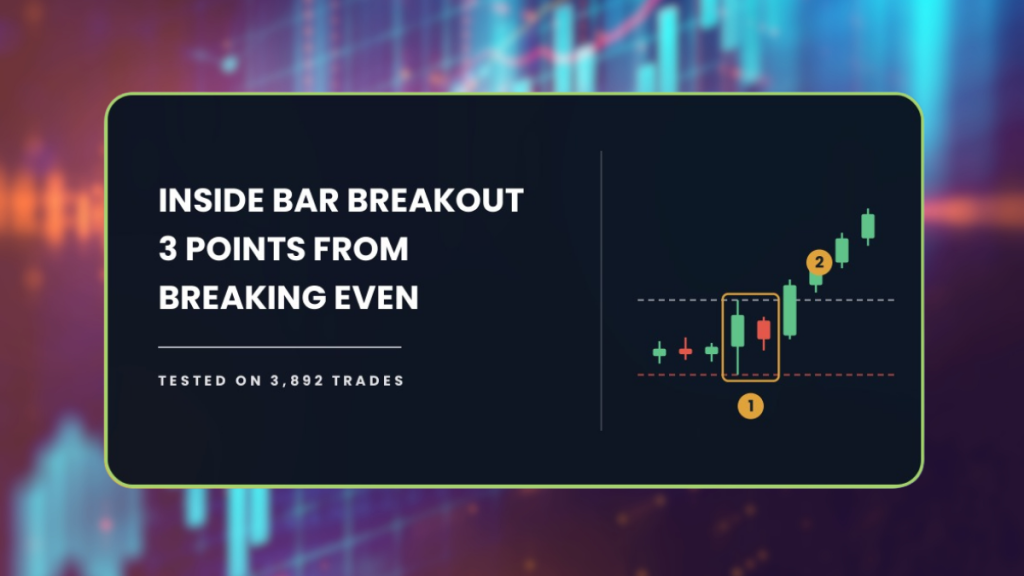
The inside bar breakout is the first pattern most traders learn, and it turned $10,000 into $420. That is not a bad year, and it is not one unlucky pair. Across 3,892 trades and nine years of Daily data, the account lost 96 percent of its value. However, the pattern itself was not broken, and the number that explains why is only three percentage points wide.
| About This Guide |
|---|
| This guide explains what an inside bar breakout is, the exact entry, stop and exit rules we put through the AFM Research Lab, and what happened across 28 forex pairs and nine years of Daily data. You will finish knowing what the tested results say, and why a pattern that works can still empty an account. |
| Quick Answer |
|---|
| An inside bar breakout trades the moment price escapes a quiet bar that sat entirely inside the one before it. In the AFM Research Lab the textbook rules turned $10,000 into $420 across 28 pairs on the Daily chart, falling 95.9 percent from its high point. A filtered version halved the losses but still finished below where it started. |
What Happened When We Tested The Inside Bar Breakout
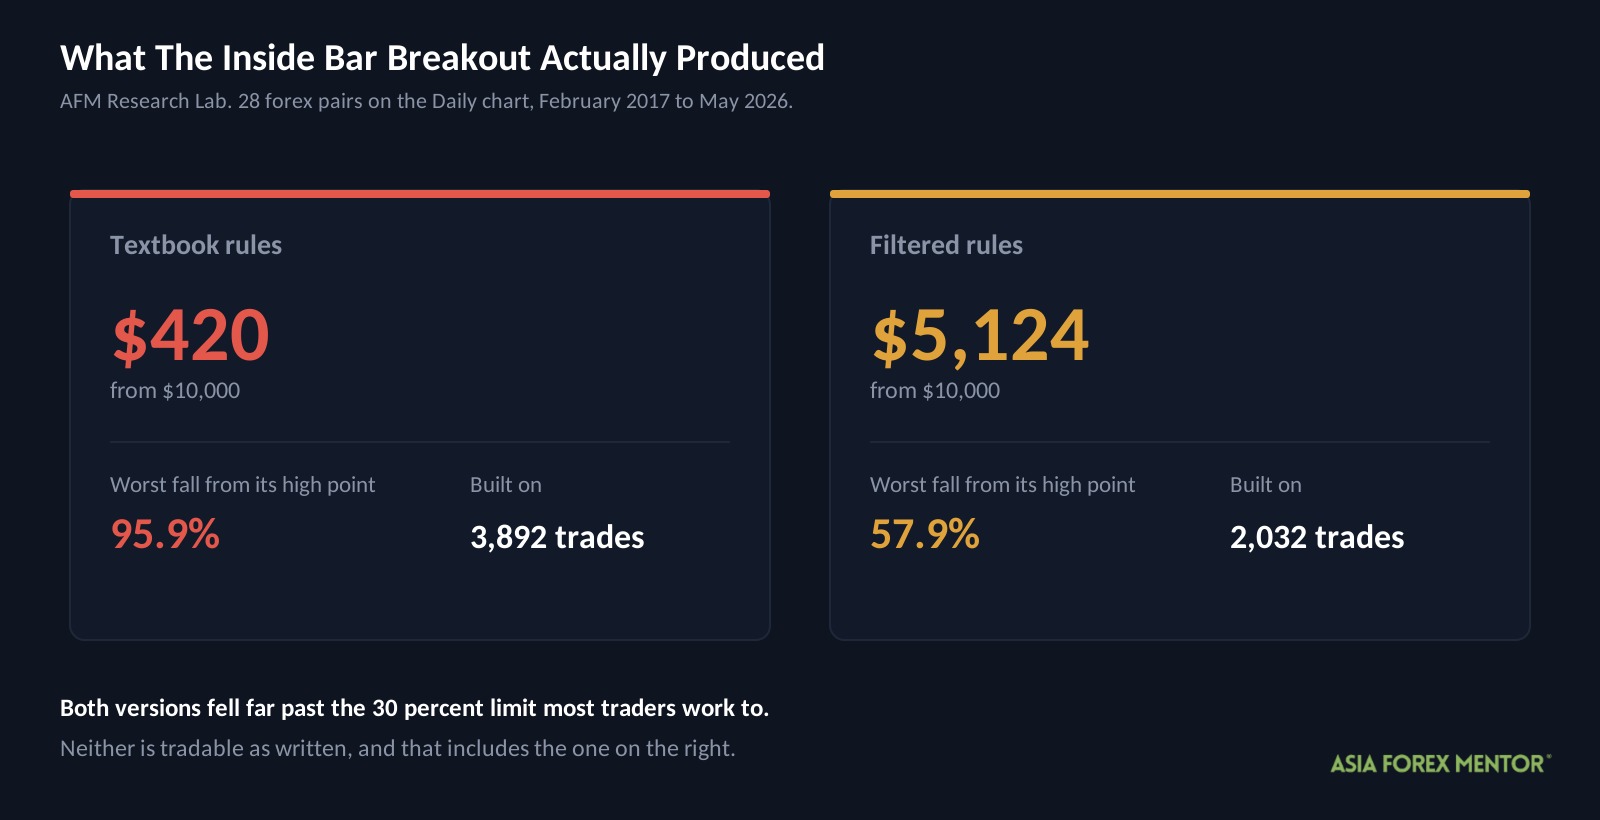
Two accounts, both starting at $10,000. One traded the rules you will find in most tutorials. The other traded a filtered version the AFM Research Lab built after the first one failed.
| Version | Start | End | Max drawdown | Trades |
|---|---|---|---|---|
| Textbook | $10,000 | $420 | 95.9% | 3,892 |
| Filtered | $10,000 | $5,124 | 57.9% | 2,032 |
Drawdown is how far an account falls from its highest point. In other words, it is not how far you are up or down overall, it is the size of the worst slide from a peak to the low that followed.
A 95.9 percent drawdown means almost everything was gone. At its lowest the textbook account held about $409, and the filtered account about $4,317.
Both versions fell far past the 30 percent limit most traders work to. As a result, neither is tradable as written, and that is true of the filtered version as well despite it losing less.
The test ran from February 26, 2017 to May 12, 2026, across 28 currency pairs on the Daily chart. Each trade risked 1 percent of the account, and trading costs were charged at 0.05 percent of the entry price per round trip.
These are backtest results. Backtesting is not live trading, and past results do not guarantee future performance.
Key Takeaways
- The textbook rules lost 96 percent of the account across 3,892 trades, finishing at $420.
- That is the worst result the AFM Research Lab has recorded on any strategy so far.
- However, the pattern did its job when it worked, paying an average of 1.48 times the risk on winning trades.
- It simply did not win often enough, falling about three percentage points short of the win rate it needed.
- Filtering cut the loss roughly in half, although a 57.9 percent drawdown still puts it well outside tradable.
What Is An Inside Bar Breakout And How Does It Work?
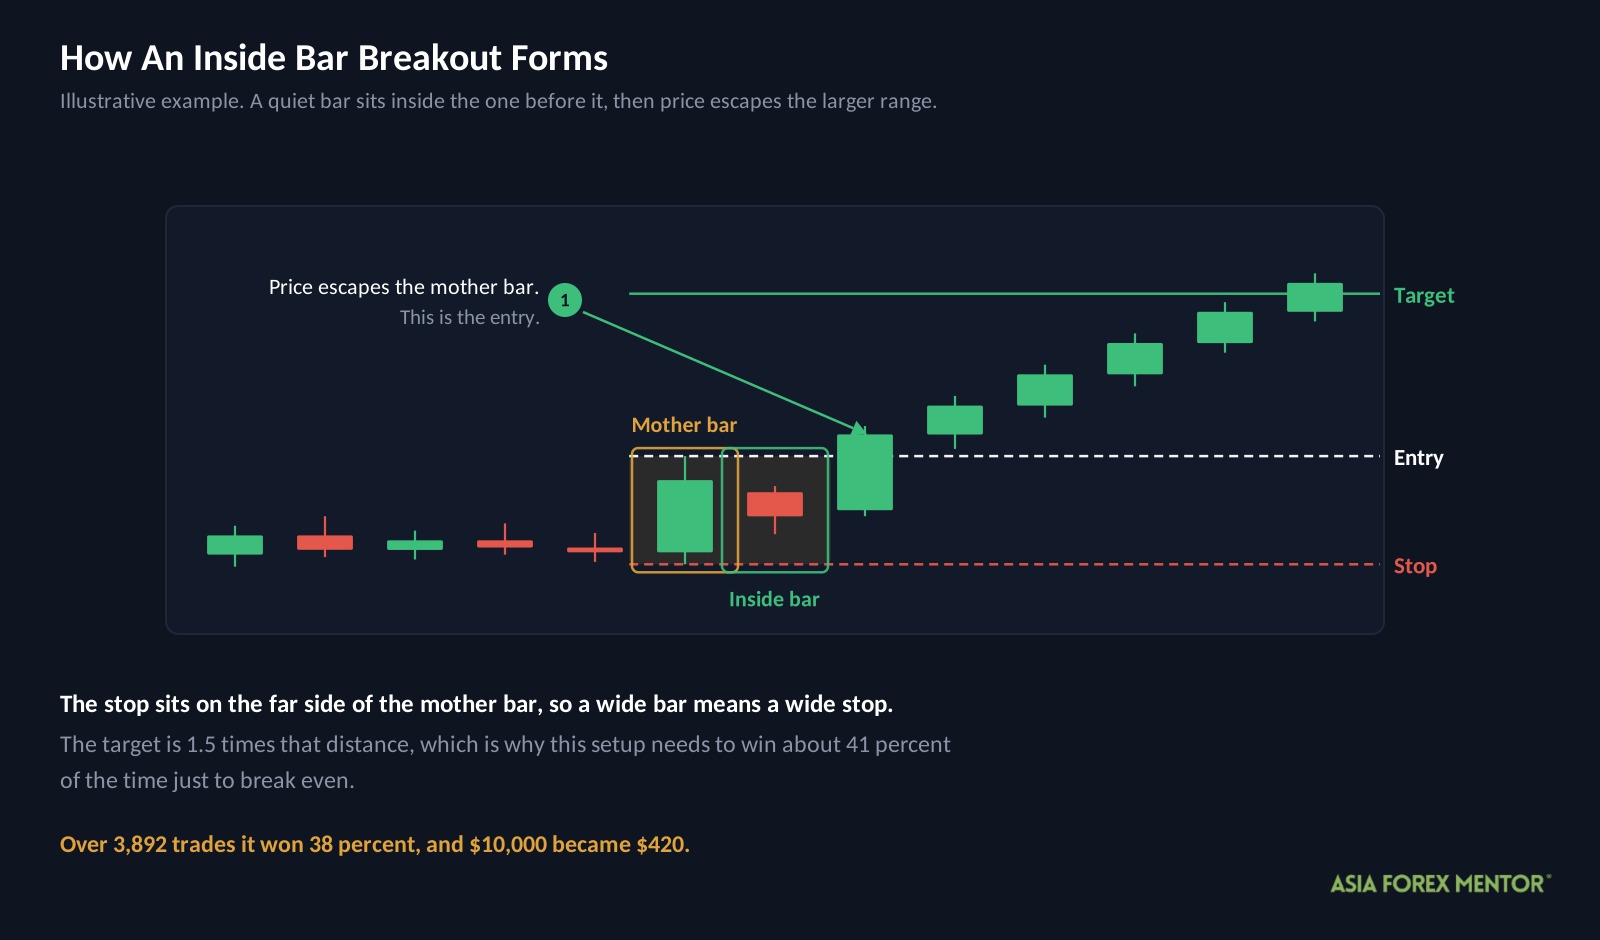
An inside bar breakout occurs when price escapes a bar that sat entirely inside the range of the bar before it. The larger bar is called the mother bar, and the smaller one inside it is the inside bar.
A bar here is one day, because this test ran on the Daily chart. An inside bar therefore means a day where price stayed within the previous day’s high and low, which is a quiet day following a busier one.
Traders read that quiet day as a pause. The market has stopped, pressure is building, and whichever side of the mother bar price escapes from is treated as the direction of the next move.
For example, a break above the mother bar’s high is read as buyers winning the standoff. Consequently, the trade goes long, with the stop placed on the other side of the mother bar.
How Do Most Traders Trade Inside Bars?
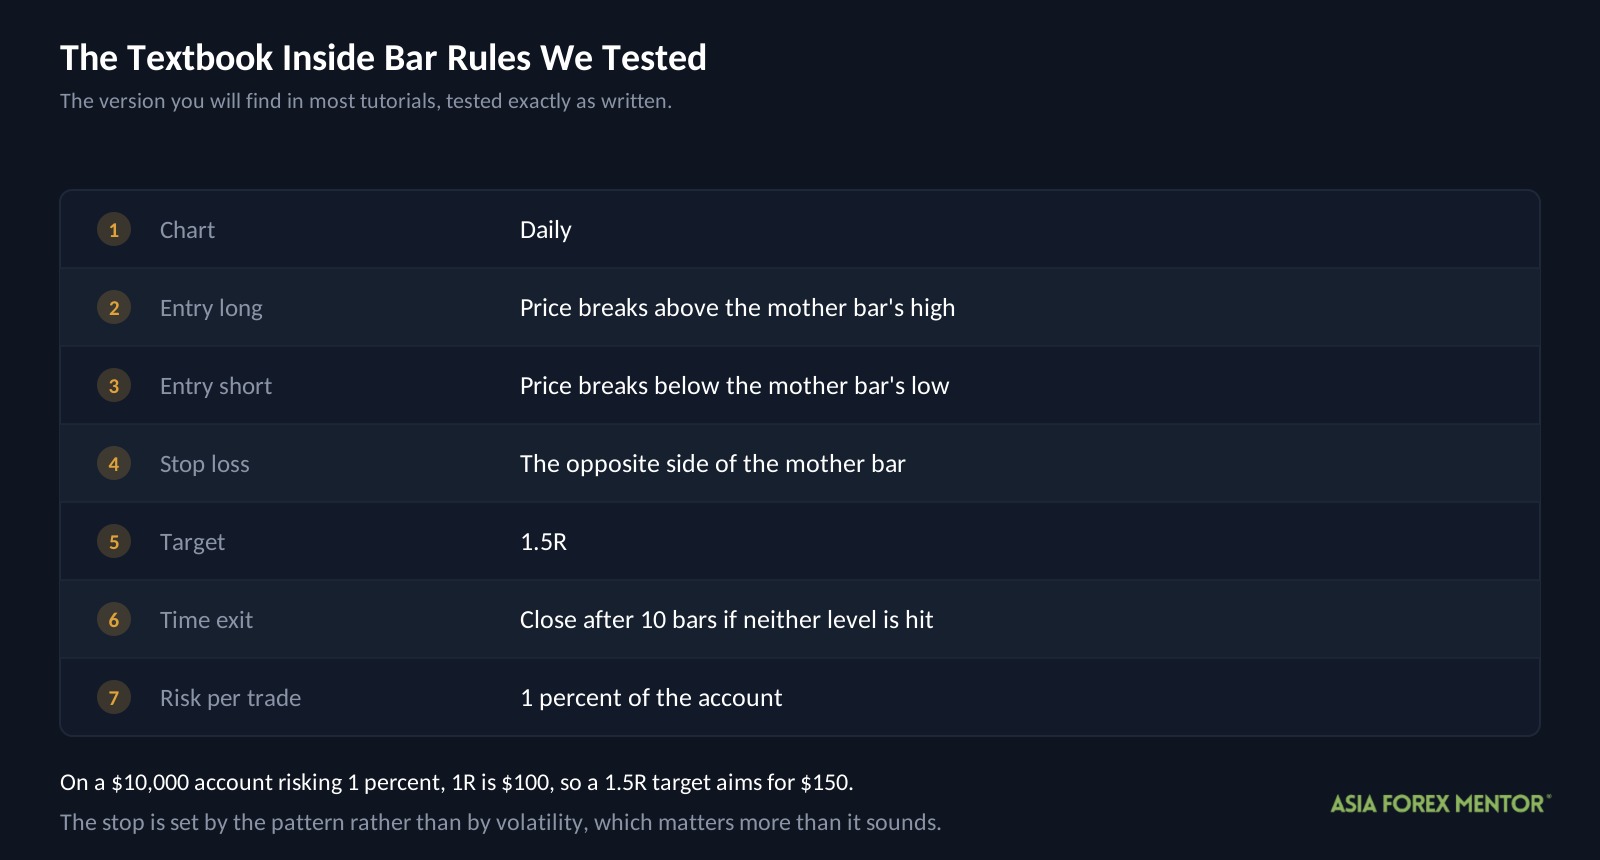
They wait for the quiet day, then take whichever side price leaves from.
Two terms you need first.
R is what you risk on one trade, measured from entry to stop. On a $10,000 account risking 1 percent, 1R is $100, so a 1.5R target aims for $150.
A pip is the standard unit of price movement in forex. On most pairs it is 0.0001, so a move from 1.3394 to 1.3427 is 33 pips.
Here are the rules exactly as we tested them.
| Rule | Setting |
|---|---|
| Chart | Daily |
| Entry long | Price breaks above the mother bar’s high |
| Entry short | Price breaks below the mother bar’s low |
| Stop loss | The opposite side of the mother bar |
| Target | 1.5R |
| Time exit | Close after 10 bars if neither level is hit |
| Risk per trade | 1 percent of the account |
Notice that the stop is defined by the pattern rather than by volatility. As a result, a wide mother bar produces a wide stop and a narrow one produces a tight stop, which matters more than it sounds.
Does The Textbook Version Make Money?
No. Over 3,892 trades and nine years it lost almost the entire account.
| Metric | Textbook |
|---|---|
| Trades | 3,892 |
| Win rate | 38% |
| Average win | +1.48R |
| Average loss | -1.04R |
| Expectancy | -0.07R |
| Profit factor | 0.89 |
| Max drawdown | 95.9% |
| Ending balance from $10,000 | $420 |
Two of those need defining.
Expectancy is what the average trade earns or loses, measured in R. At negative 0.07R, every trade gave back about a fourteenth of what it risked, and 3,892 of those is what empties an account.
Profit factor is total winnings divided by total losses. Above 1 means the strategy made money, so 0.89 says it paid out 89 cents for every dollar it took in.
Now look at the two middle rows, because they are the whole story. Winners paid 1.48R on average, which is almost exactly the 1.5R target, and losers cost 1.04R.
With those two figures, the strategy needed to win about 41 percent of its trades to break even. It won 38 percent.
That is the entire problem. The pattern was not broken and the targets were being reached, but the strategy fell roughly three percentage points short of the win rate it needed, and across 3,892 trades that gap compounds into a 96 percent loss.
What Settings Did AFM Change And Why?
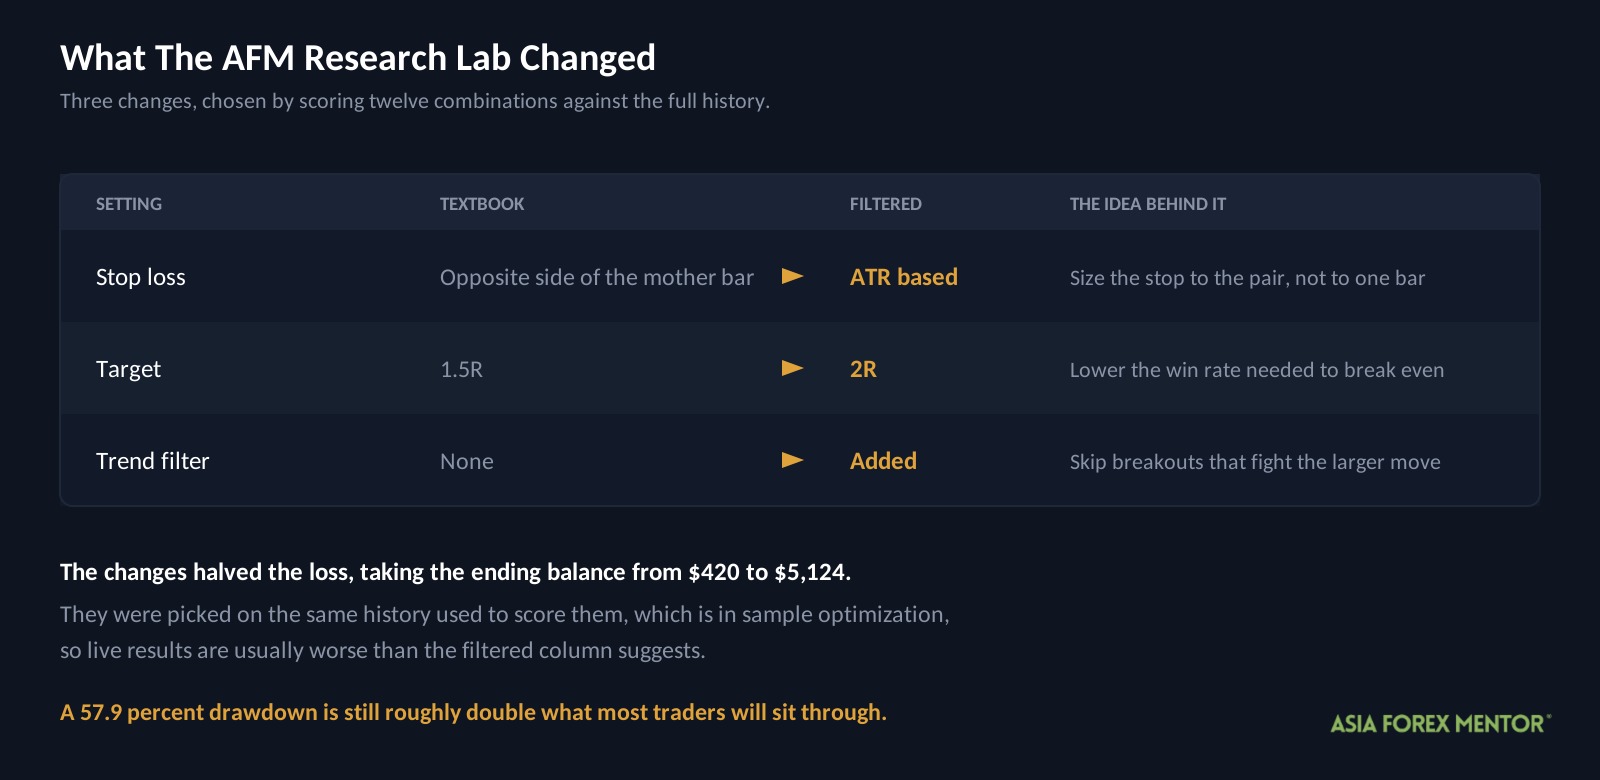
If the gap is three points, the obvious move is to cut the worst trades and let the good ones run further. The AFM Research Lab tested 12 combinations and kept the one that scored highest.
| Setting | Textbook | Filtered | The idea behind it |
|---|---|---|---|
| Stop loss | Opposite side of the mother bar | ATR based | Size the stop to the pair, not to one bar |
| Target | 1.5R | 2R | Lower the win rate needed to break even |
| Trend filter | None | Added | Skip breakouts that fight the larger move |
ATR means Average True Range, which is how much a pair usually moves in a day. Therefore a stop set in ATR sizes itself to each pair, instead of depending on whether one particular mother bar happened to be wide or narrow.
These settings were chosen by scoring combinations against the full history and keeping what did best. That has a name, in sample optimization, and it means the test already knew the answers. Consequently, live results are usually worse than the filtered column suggests.
Did The New Settings Work?
They halved the damage. They did not fix it.
| Metric | Textbook | Filtered |
|---|---|---|
| Trades | 3,892 | 2,032 |
| Win rate | 38% | 34% |
| Expectancy | -0.07R | -0.02R |
| Profit factor | 0.89 | 0.97 |
| Max drawdown | 95.9% | 57.9% |
| Ending balance from $10,000 | $420 | $5,124 |
Expectancy improved from negative 0.07R to negative 0.02R, and profit factor climbed from 0.89 to 0.97. In other words, the strategy went from clearly losing to almost breaking even.
Almost is the operative word. A profit factor of 0.97 still means paying out 97 cents for every dollar taken in, and 2,032 trades of that is how $10,000 becomes $5,124.
The drawdown tells the same story. Falling 57.9 percent instead of 95.9 percent is a real improvement, and it is still roughly double what most traders will sit through.
Did The Result Hold In Every Time Period?
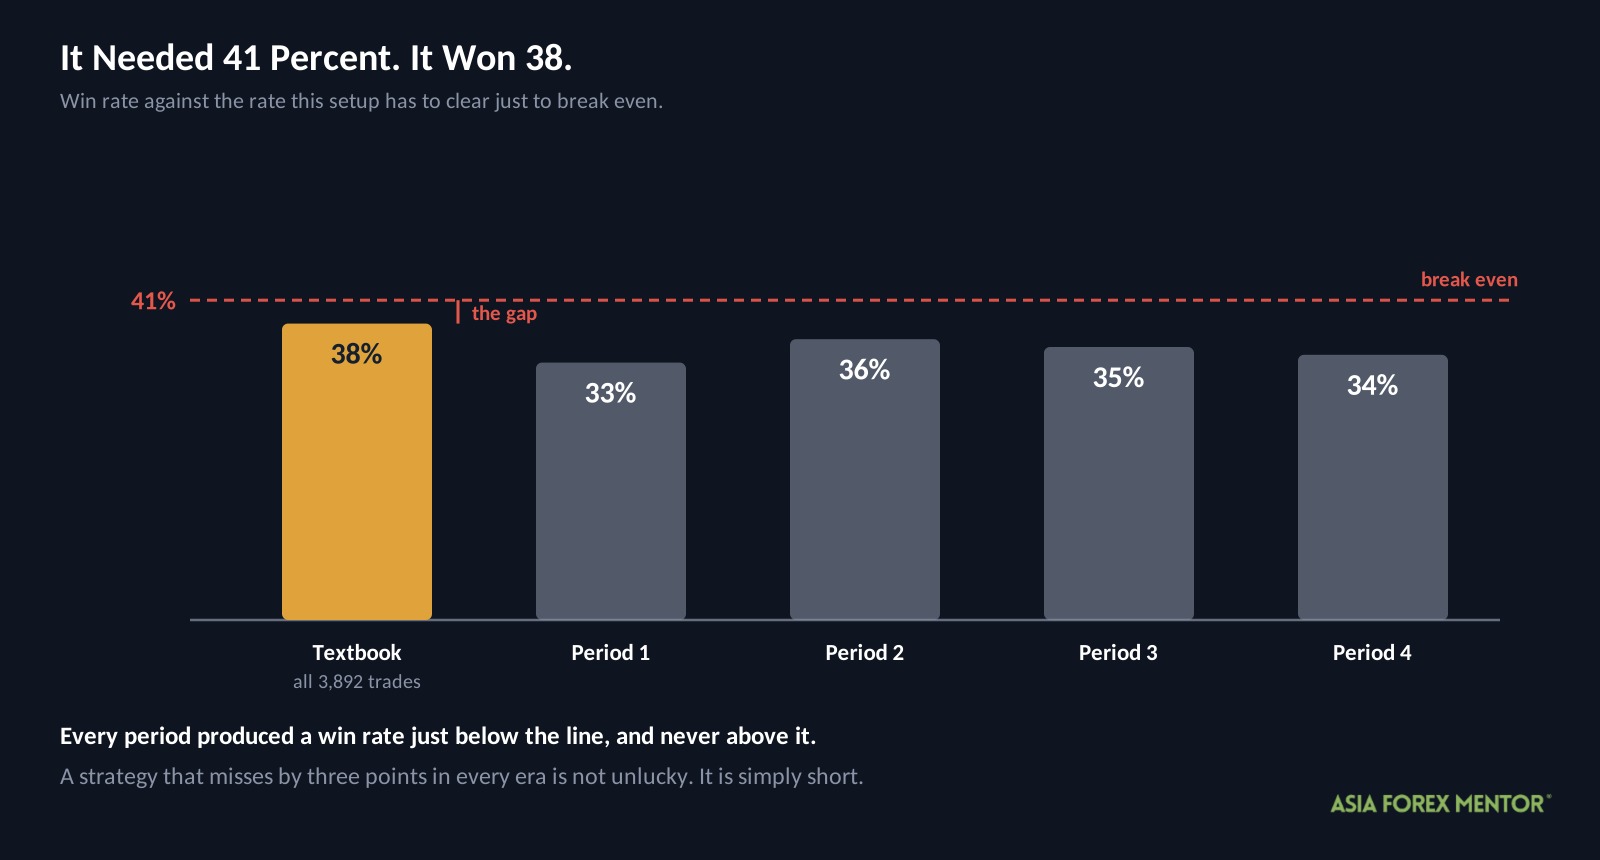
The AFM Research Lab split the nine years into four periods and scored the filtered rules separately in each. This is called walk forward testing, and it answers whether a result holds up in every era or only in one.
| Period | Win rate | Yearly growth rate | Max drawdown |
|---|---|---|---|
| 1 | 33% | -17.0% | 48.2% |
| 2 | 36% | +4.2% | 38.3% |
| 3 | 35% | -5.6% | 42.3% |
| 4 | 34% | -8.3% | 40.2% |
One period made money, returning 4.2 percent. The other three lost between 5.6 and 17.0 percent a year.
The win rate column is unusually steady, moving only between 33 and 36 percent. Normally that consistency would be encouraging, because it suggests the result is not an accident.
Here it means the opposite. The strategy reliably produced a win rate just below what it needed, in every period tested, which is a more damning finding than a result that swings around.
Every period also fell at least 38 percent from its high. Therefore there was no stretch of the last nine years where this would have been comfortable to trade.
What About The Pairs That Worked?
Some pairs did make money. NZDJPY had the best win rate at 47 percent, while EURJPY and GBPAUD also finished with small gains.
A 47 percent win rate clears the roughly 41 percent this strategy needs, so NZDJPY genuinely was profitable across the test. However, that is where most traders make their next mistake.
When you test 28 pairs, a few of them will look good even if the underlying idea is worthless. That is simple arithmetic rather than bad luck, and picking the winners afterwards is choosing the pairs that happened to suit the last nine years.
The honest reading is that most pairs lost money and a handful did not. Moreover, nothing in the data explains why NZDJPY behaved differently, which is exactly what you would expect if the difference were chance.
What Does A Winning Trade Look Like?
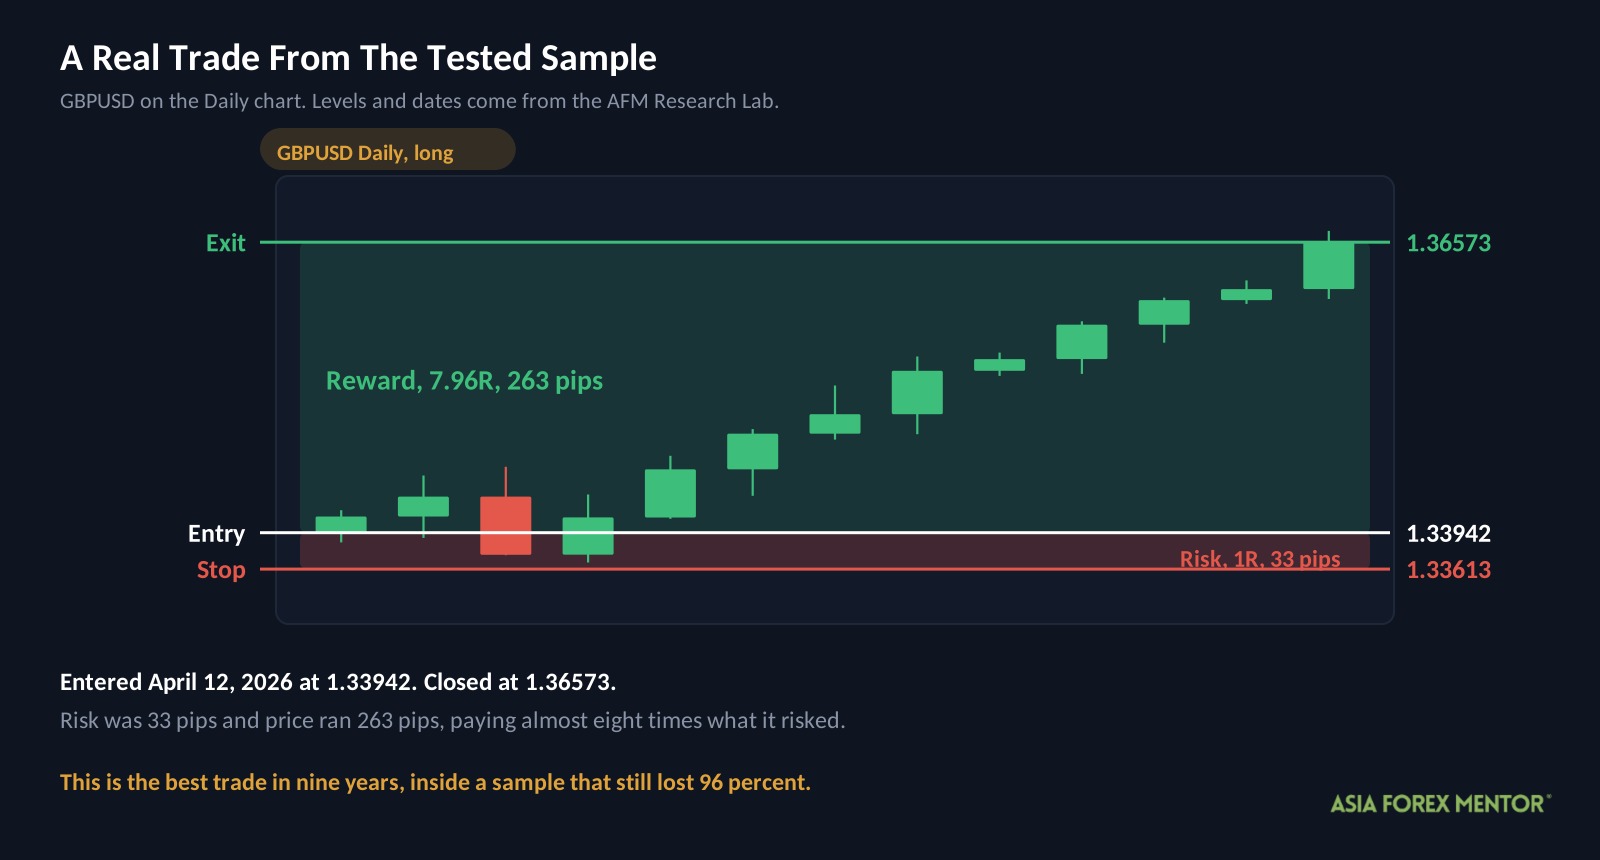
This is a real trade from the tested sample, and it is the best one in nine years rather than a typical week.
| Detail | Value |
|---|---|
| Pair and chart | GBPUSD, Daily |
| Direction | Long, meaning a buy |
| Entry | April 12, 2026 at 1.33942 |
| Stop | 1.33613 |
| Exit | 1.36573 |
| Result | +7.96R |
The risk on this trade was 33 pips, the distance from 1.33942 down to the stop at 1.33613. Price then ran 263 pips, which is why it paid almost eight times what it risked.
One trade returning nearly 8R inside a sample that lost 96 percent is worth sitting with. It tells you the pattern can produce a genuine move, and it also tells you how little that matters when the average trade is negative.
How Should You Practice Inside Bars?
I would not trade these rules with real money. Reading a quiet bar after a busy one is still a useful skill, so here is how I would build it.
- Open a Daily chart on one pair and mark every bar that sat entirely inside the one before it.
- For each one, write down both potential entries, the stop on the opposite side, and a 1.5R target.
- Walk the chart forward one bar at a time and record which came first, the target, the stop, or the tenth bar.
- Do at least 50 by hand, because fewer than that will not separate skill from chance.
- Count your win rate and compare it against the 41 percent this setup needs.
- Note whether each break went with or against the larger move on the chart.
- Check your results pair by pair, then resist the urge to keep only the pairs that worked.
That last step is the one that matters. Finding a pair that suits a strategy is easy, and it is usually the thing that loses people money.
Sound risk management is what keeps this exercise cheap while you find out.
Is The Inside Bar Breakout Worth Your Time?
As a mechanical system, no. As a piece of chart reading inside a wider method, possibly.
- The textbook rules turned $10,000 into $420 across 3,892 trades, with a 95.9 percent max drawdown.
- The filtered rules halved the loss to $5,124, although the drawdown was still 57.9 percent.
- Three of four periods lost money, and the win rate sat just below break even in all four.
What makes this result unusual is how close it came. Most failed strategies fail because the idea is wrong, whereas this one reached its targets at almost exactly the rate it was designed to.
It was simply three percentage points short, every period, for nine years. That is the most expensive rounding error in price action trading, and it is why a pattern can look right on every chart you check and still take your account apart.
Also Read: Candlestick Patterns Cheat Sheet
Frequently Asked Questions
What Is An Inside Bar?
An inside bar is a bar that sits entirely inside the high and low of the bar before it. For example, on a Daily chart it is a quiet day that stayed within the previous day’s range. Traders read it as a pause before the next move.
What Is A Mother Bar?
The mother bar is the larger bar that contains the inside bar. In other words, its high and low define the range price has to escape before a trade triggers.
Does The Inside Bar Breakout Strategy Work?
Not as written. In fact, the AFM Research Lab ran it across 3,892 trades and nine years of Daily data. As a result, a $10,000 account finished at $420, after falling 95.9 percent from its high point.
What Win Rate Does An Inside Bar Breakout Need?
About 41 percent, given a 1.5R target and the average loss this test produced. However, the textbook version won only 38 percent, and that three point gap is what cost it the account.
Which Pairs Work Best For Inside Bars?
NZDJPY had the highest win rate at 47 percent, while EURJPY and GBPAUD finished with small gains. However, most of the 28 pairs lost money, and across that many pairs a few winners are expected by chance alone.
Where Should The Stop Go On An Inside Bar Trade?
The textbook rule puts it on the opposite side of the mother bar. Alternatively, an ATR based stop sizes itself to how much the pair usually moves, which stops a single wide bar from dictating your risk.
Is A 95 Percent Drawdown Recoverable?
No. An account down 95.9 percent needs a gain of more than 2,300 percent to return to its starting point. Therefore the textbook version is not tradable as written, whatever else the numbers say.