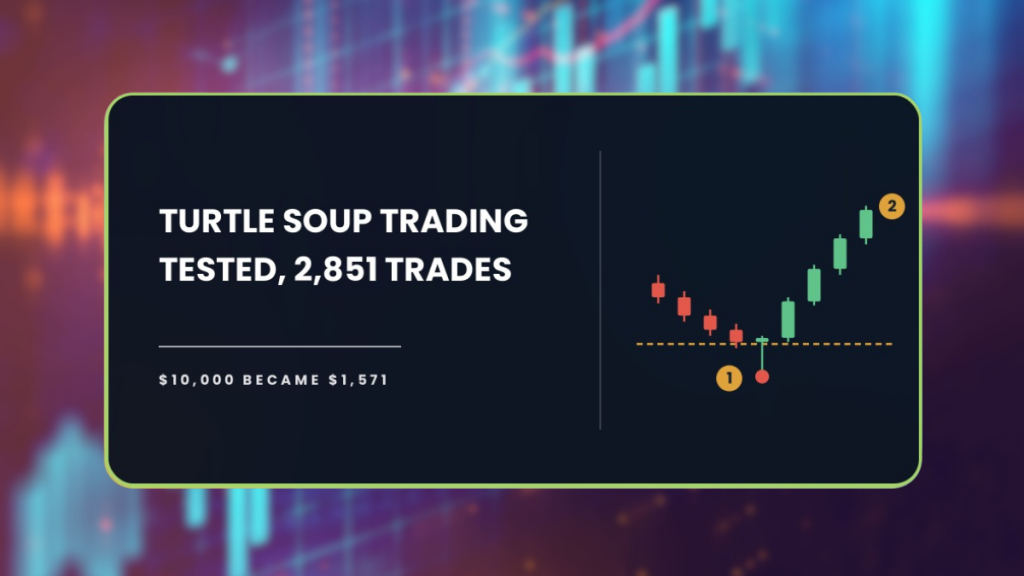
The Turtle Soup strategy turned $10,000 into $1,571. Then we filtered it until it made money, and the new version shows a 6 percent drawdown and a positive edge. It looks like the fix worked. It did not, and the giveaway sits in a column most people never read. Spot it before I point at it and you will never be fooled by a backtest again.
| About This Guide |
|---|
| This guide explains what Turtle Soup trading is, the exact entry, stop and exit rules we put through the AFM Research Lab, and what happened across 28 forex pairs and nine years of Daily data. You will finish knowing what the tested results say, and why the version that made money proves less than it appears to. |
| Quick Answer |
|---|
| Turtle Soup trading fades failed breakouts, buying when price breaks a recent low and then climbs back inside it. In the AFM Research Lab the textbook rules turned $10,000 into $1,571 across 28 pairs on the Daily chart, falling 89.5 percent from its high point. A filtered version finished slightly ahead, on only 42 trades. |
What Happened When We Tested Turtle Soup
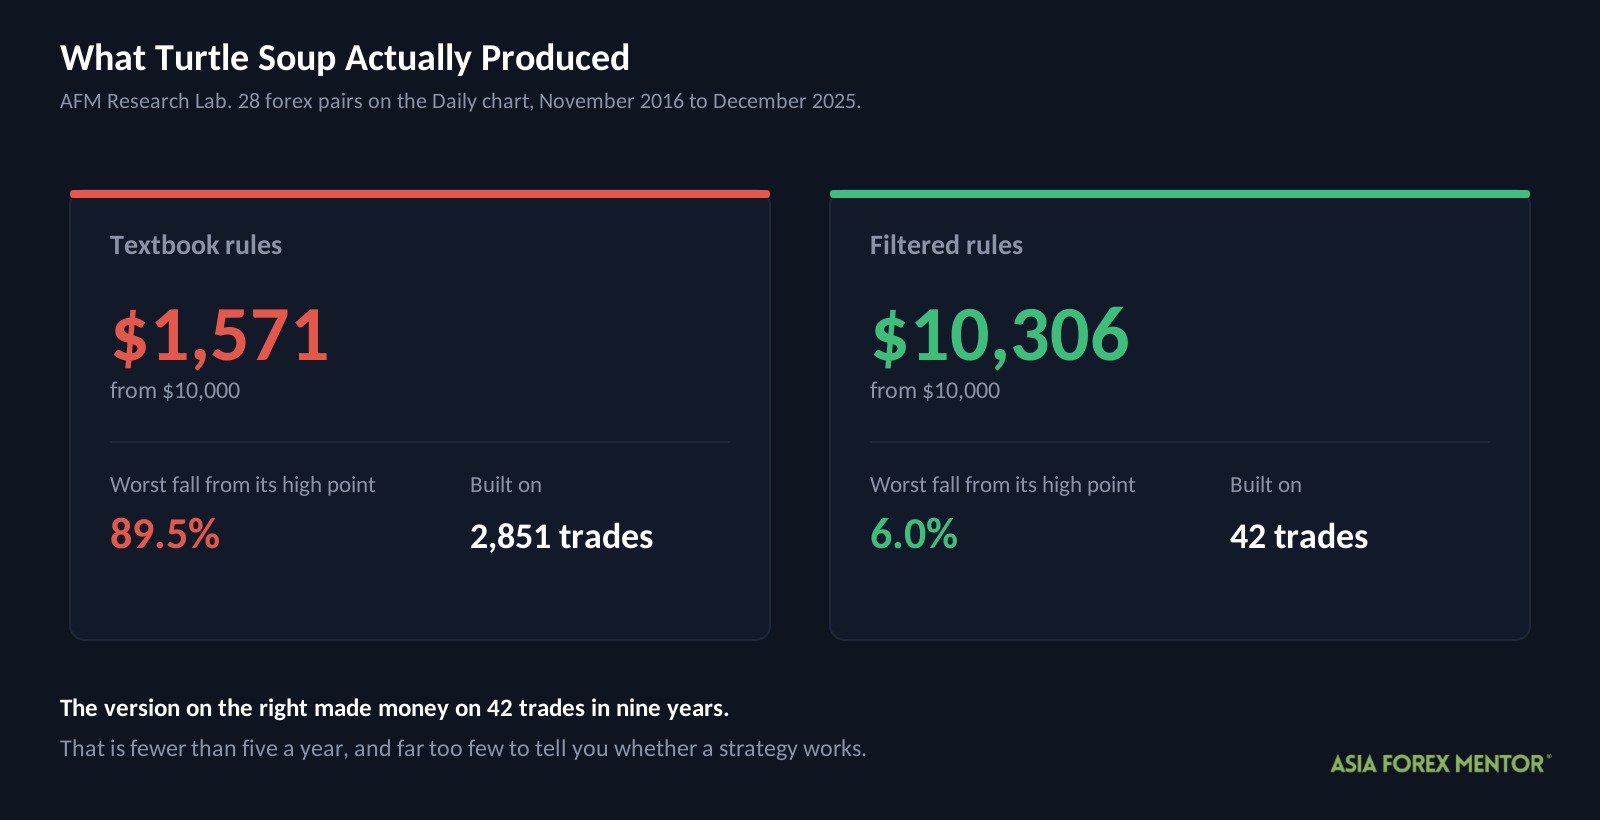
Two accounts, both starting at $10,000. One traded the rules you will find in most tutorials. The other traded a filtered version the AFM Research Lab built after the first one failed.
| Version | Start | End | Max drawdown | Trades |
|---|---|---|---|---|
| Textbook | $10,000 | $1,571 | 89.5% | 2,851 |
| Filtered | $10,000 | $10,306 | 6.0% | 42 |
Look at that last column before anything else, because it decides how much the rest of the table is worth.
Drawdown is how far an account falls from its highest point. It is not how far you are up or down overall, it is the size of the worst slide from a peak to the low that followed.
An 89.5 percent drawdown means nearly nine tenths of the account’s peak value was gone. At its lowest the textbook account was worth about $1,381, and no strategy that behaves like that is tradable as written.
The test ran from November 21, 2016 to December 14, 2025, across 28 currency pairs on the Daily chart. Each trade risked 1 percent of the account, and trading costs were charged at 0.05 percent of the entry price per round trip.
These are backtest results. Backtesting is not live trading, and past results do not guarantee future performance.
Key Takeaways
- The textbook rules lost 84 percent of the account across 2,851 trades, finishing at $1,571.
- The worst fall was 89.5 percent, which is three times the 30 percent limit most traders work to.
- The filtered version finished at $10,306, a gain of about 3 percent over nine years.
- It reached that on 42 trades, which is fewer than five a year, and a sample that small cannot tell you whether a strategy works.
- One of the four time periods contained only 8 trades, and it is the period that lost money.
What Is Turtle Soup Trading And How Does It Work?
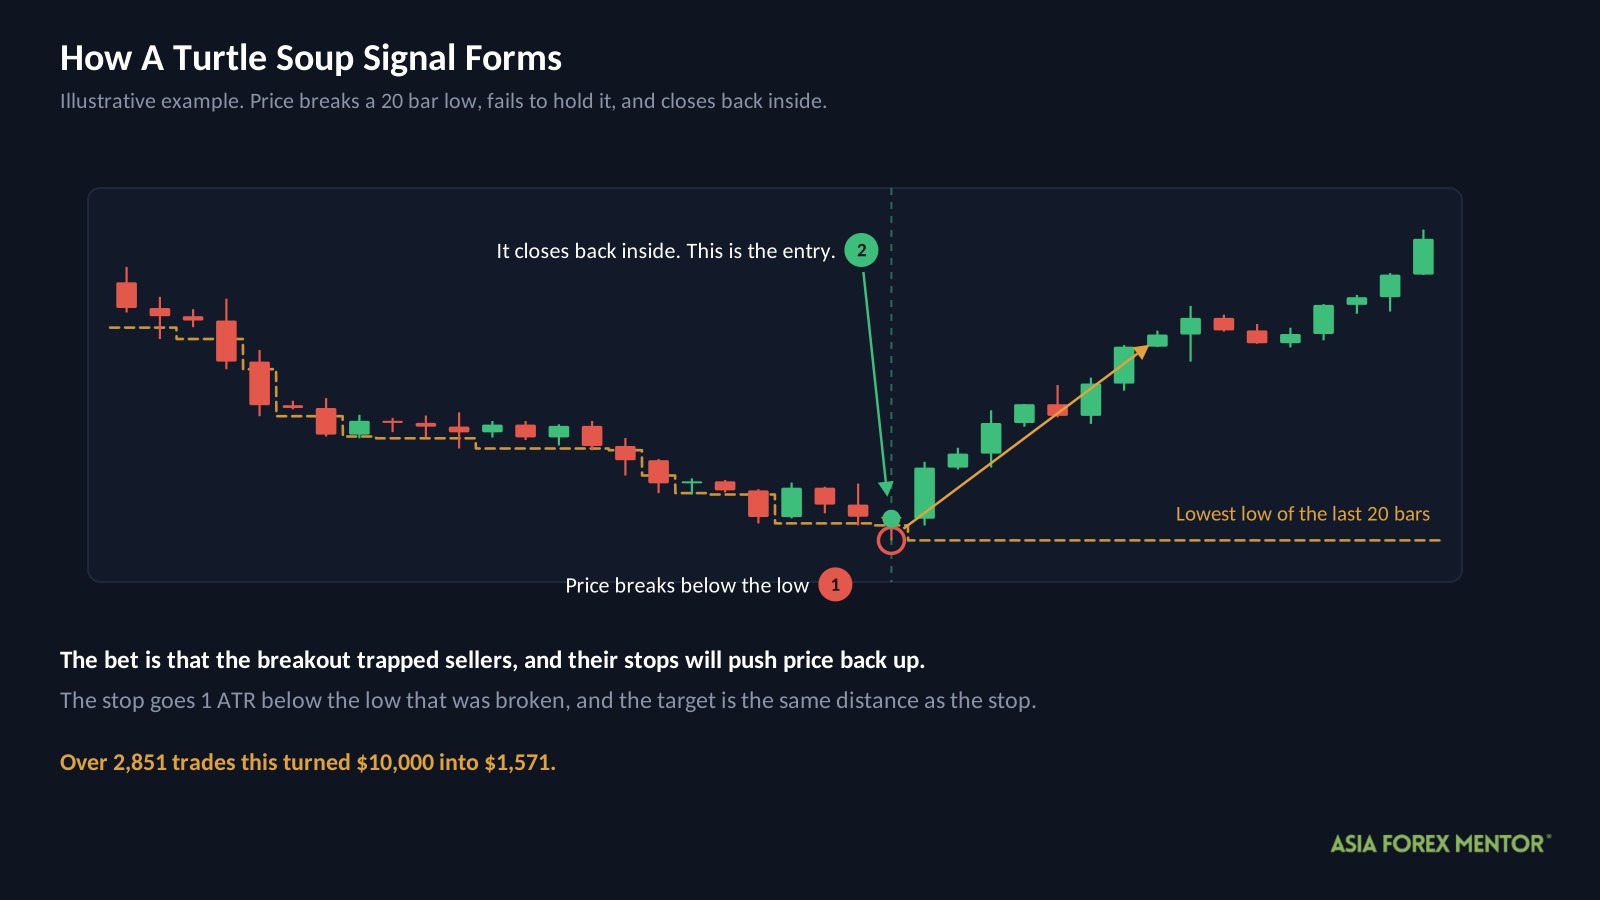
Turtle Soup trading is a strategy that fades failed breakouts. It waits for price to break a recent high or low, then enters in the opposite direction as soon as price climbs back inside the range it just left.
The bet is that the breakout was a trap rather than a beginning. Everyone who bought the break is now wrong, and their stop losses sit just behind them, which is the fuel for the move back.
The setup comes from Linda Raschke, and the name is a dig at the Turtle traders, whose system bought exactly the breakouts this one sells.
Notice what that means about the logic. Two respected strategies take opposite sides of the same event, which is a useful reminder that a convincing story is not evidence.
How Do Most Traders Trade Turtle Soup?
They mark a recent extreme, wait for price to poke through it and fail, and take the trade back into the range.
Three terms you need first.
ATR means Average True Range. It is how much a pair usually moves in a day, so a stop set in ATR sizes itself to each pair instead of using the same pip distance everywhere.
R is what you risk on one trade, measured from entry to stop. On a $10,000 account risking 1 percent, 1R is $100, so a 1R target aims for $100.
A bar is one day on this chart, so a 20 bar high is the highest price of the last twenty trading days.
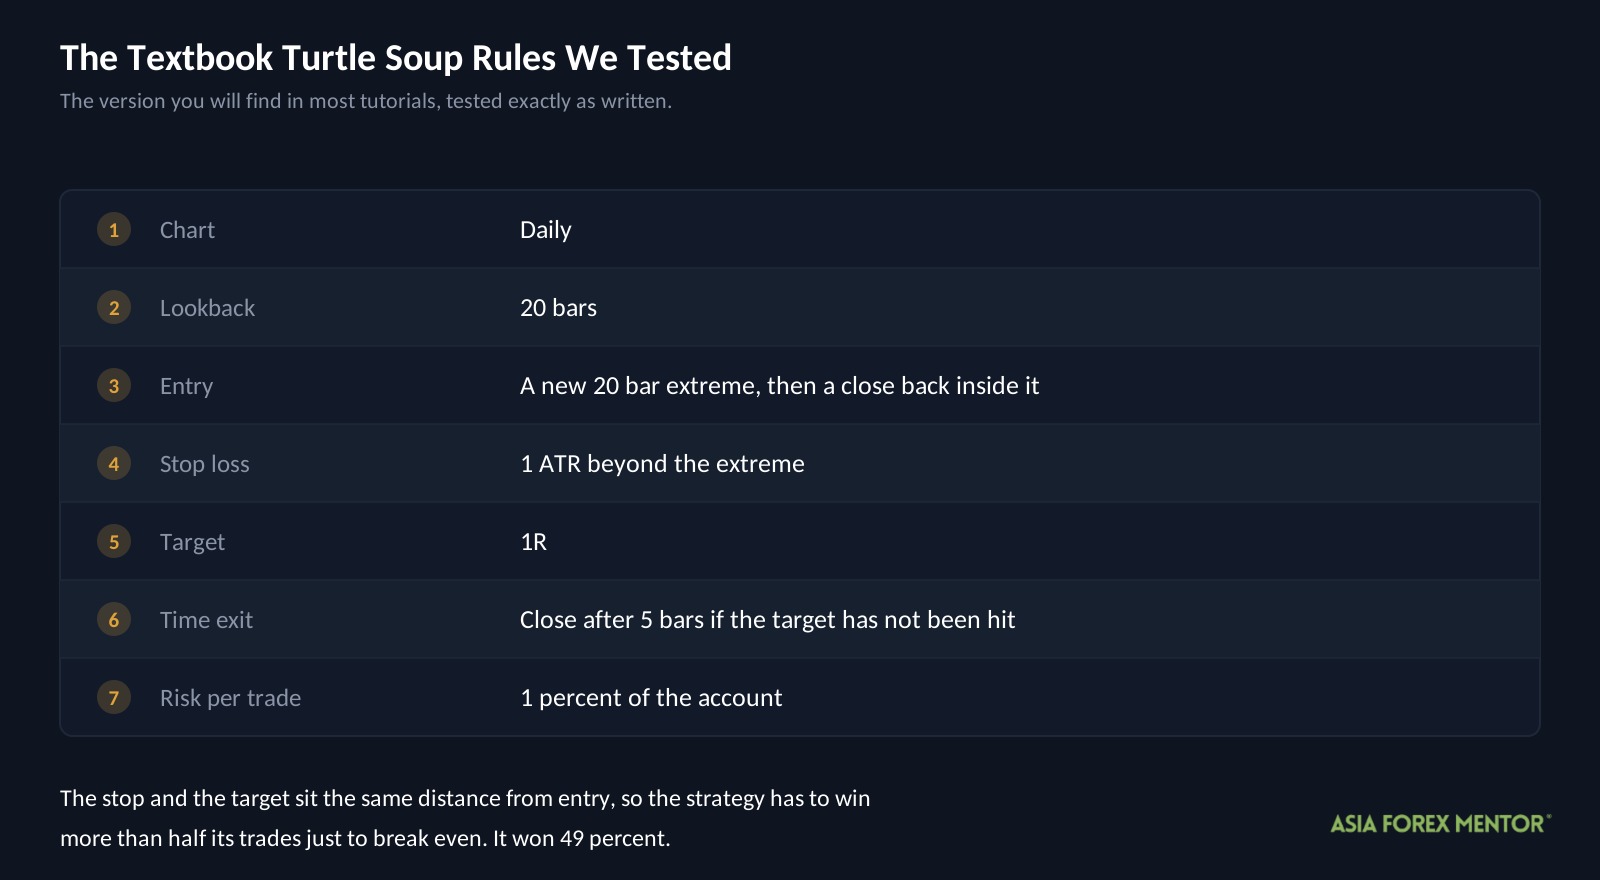
Here are the rules exactly as we tested them.
| Rule | Setting |
|---|---|
| Chart | Daily |
| Lookback | 20 bars |
| Entry | Price makes a new 20 bar extreme, then closes back inside it |
| Stop loss | 1 ATR beyond the extreme |
| Target | 1R |
| Time exit | Close the trade after 5 bars if the target has not been hit |
| Risk per trade | 1 percent of the account |
That time exit matters more than it looks. Most setups leave a trade open until it wins or loses, while this one gives the idea five days to work and then takes whatever is there.
Does The Textbook Version Make Money?
No. Over 2,851 trades and nine years it lost 84 percent of the account.
| Metric | Textbook |
|---|---|
| Trades | 2,851 |
| Win rate | 49% |
| Expectancy | -0.06R |
| Max drawdown | 89.5% |
| Lowest the account reached | about $1,381 |
| Ending balance from $10,000 | $1,571 |
Expectancy is what the average trade earns or loses, measured in R. At negative 0.06R, every trade gave back about a sixteenth of what it risked, and 2,851 of those is what empties an account.
Here is why that happened, and it is unusually clean. The stop and the target are the same distance from entry, so the strategy needs to win more than half its trades simply to stand still. It won 49 percent.
That is a hair under the line, and the spread did the rest. A setup that is almost right is still a losing setup once you add the cost of trading it 2,851 times.
The 49 percent win rate is the part that makes this seductive. Nearly half the trades worked, which is exactly the kind of result that convinces someone the idea is sound and the execution needs tuning.
What Settings Did We Change And Why?
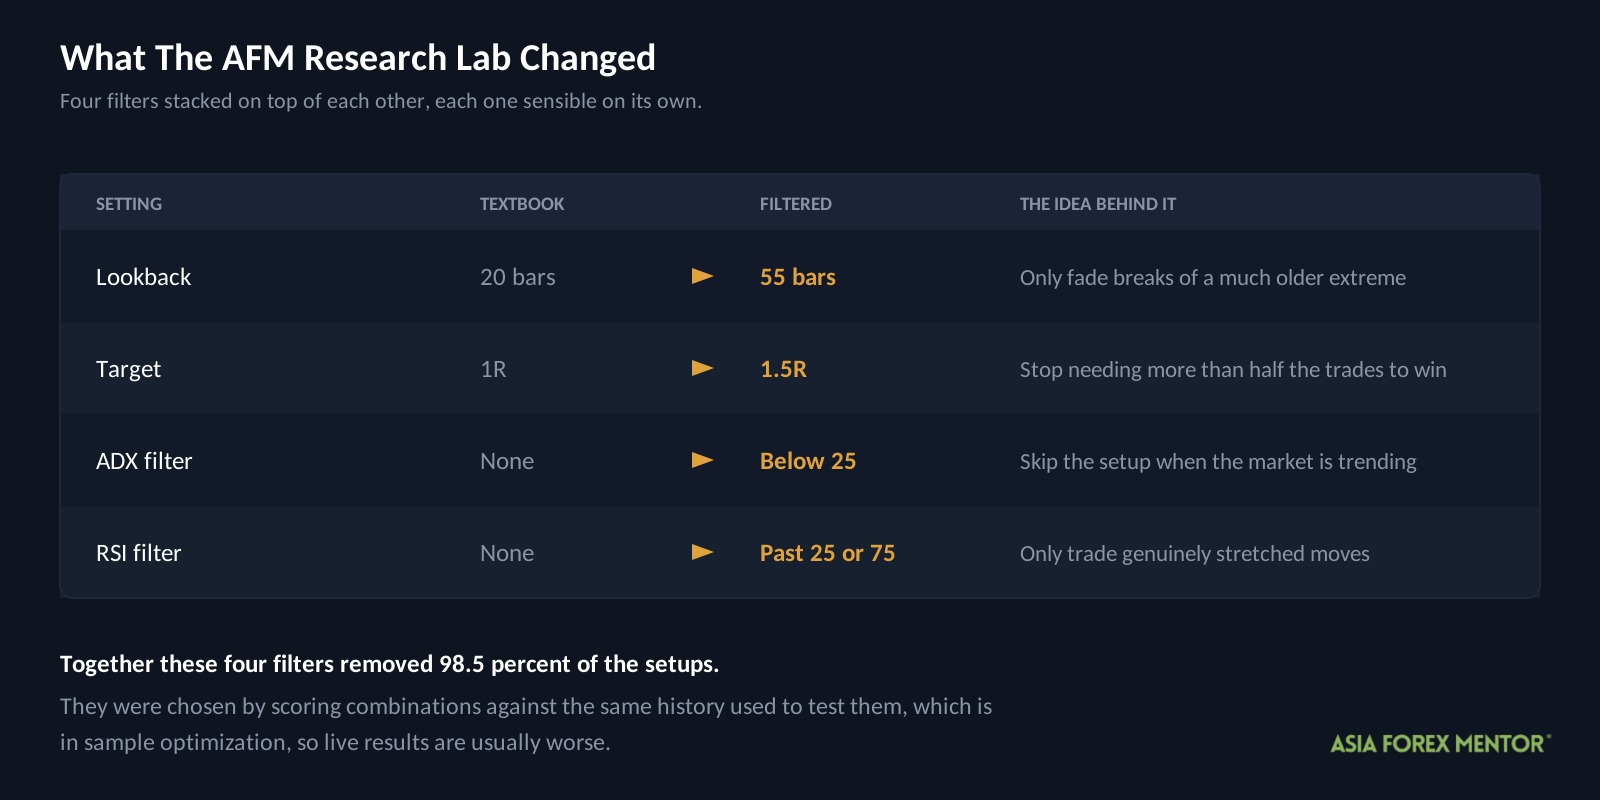
If the edge is nearly there, the obvious move is to demand better conditions and let the winners run further. The AFM Research Lab changed four things.
| Setting | Textbook | Filtered | The idea behind it |
|---|---|---|---|
| Lookback | 20 bars | 55 bars | Only fade breaks of a much older extreme |
| Target | 1R | 1.5R | Stop needing more than half the trades to win |
| ADX filter | None | Below 25 | Skip the setup when the market is trending |
| RSI filter | None | Below 25 long, above 75 short | Only trade genuinely stretched moves |
ADX is the Average Directional Index, a number from 0 to 100 measuring how strong a move is without saying which way it points. Requiring it below 25 keeps the strategy out of trending markets, where a breakout is more likely to be real.
RSI is the Relative Strength Index, a 0 to 100 reading comparing recent up closes against recent down closes. Demanding a reading past 25 or 75 means only acting on moves that are already unusual.
These settings were chosen by testing combinations against the full history and keeping what scored best. That has a name, in sample optimization, and it means the test already knew the answers.
Did The New Settings Work?
On paper, yes. In practice the question does not survive contact with the trade count.
| Metric | Textbook | Filtered |
|---|---|---|
| Trades | 2,851 | 42 |
| Win rate | 49% | 45% |
| Expectancy | -0.06R | +0.08R |
| Max drawdown | 89.5% | 6.0% |
| Lowest the account reached | about $1,381 | about $9,486 |
| Ending balance from $10,000 | $1,571 | $10,306 |
Every number in that right hand column looks better. Expectancy turned positive, the drawdown collapsed from 89.5 percent to 6 percent, and the account finished ahead.
The account finished ahead by $306, over nine years. That is about 3 percent in total, or roughly a third of a percent a year, which is less than leaving the money in a current account.
And it did that on 42 trades. Four filters stacked on top of each other removed 98.5 percent of the setups, leaving fewer than five trades a year.
Why 42 Trades Cannot Tell You Anything
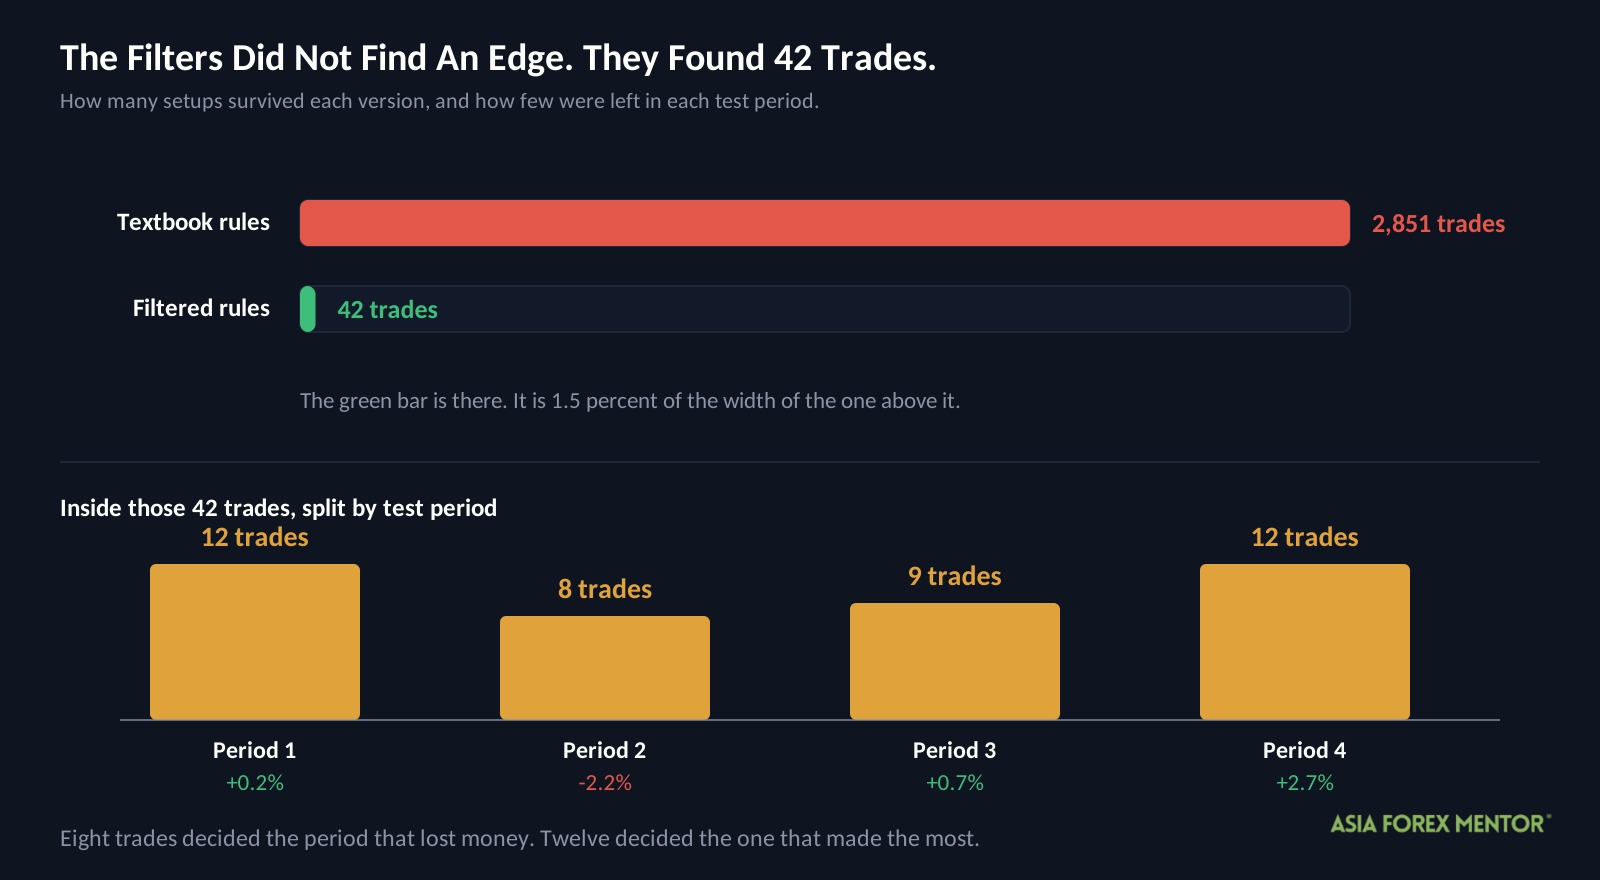
This is the part worth taking away from the whole article, because it applies to every backtest you will ever read.
A win rate of 45 percent across 42 trades means 19 winners and 23 losers. Move three trades from one column to the other, which is well within chance over nine years, and the strategy’s entire record changes.
The textbook version’s 2,851 trades tell you something real, because no run of luck survives that many repetitions. The filtered version’s 42 do not, no matter how good the numbers attached to them look.
This is what over filtering does. Each filter sounds sensible on its own, and stacking four of them produced a sample so small that the result became a coin flip wearing a suit.
If you take one habit from this test, make it this one. Before you believe a backtest, find the trade count, and treat anything under a few hundred as a hypothesis rather than a result.
Did The Result Hold In Every Time Period?
The AFM Research Lab split the nine years into four periods and scored the filtered rules separately in each. This is called walk forward testing, and it answers whether a result holds up in every era or only in one.
| Period | Trades | Win rate | Expectancy | Yearly growth rate | Max drawdown |
|---|---|---|---|---|---|
| 1 | 12 | 42% | +0.04R | +0.2% | 5.1% |
| 2 | 8 | 25% | -0.42R | -2.2% | 4.7% |
| 3 | 9 | 44% | +0.16R | +0.7% | 2.8% |
| 4 | 12 | 67% | +0.48R | +2.7% | 2.6% |
Read the trades column, not the returns column. Twelve, eight, nine and twelve.
Period 2 lost money on eight trades, of which two won. Period 4 made money on twelve trades, of which eight won. Neither of those is a verdict on a strategy, it is a description of what a small handful of trades happened to do.
The win rate swings from 25 percent to 67 percent across the four periods. A strategy with a genuine edge does not usually move that much, and a sample this small cannot be expected to stay still.
What Does A Winning Trade Look Like?
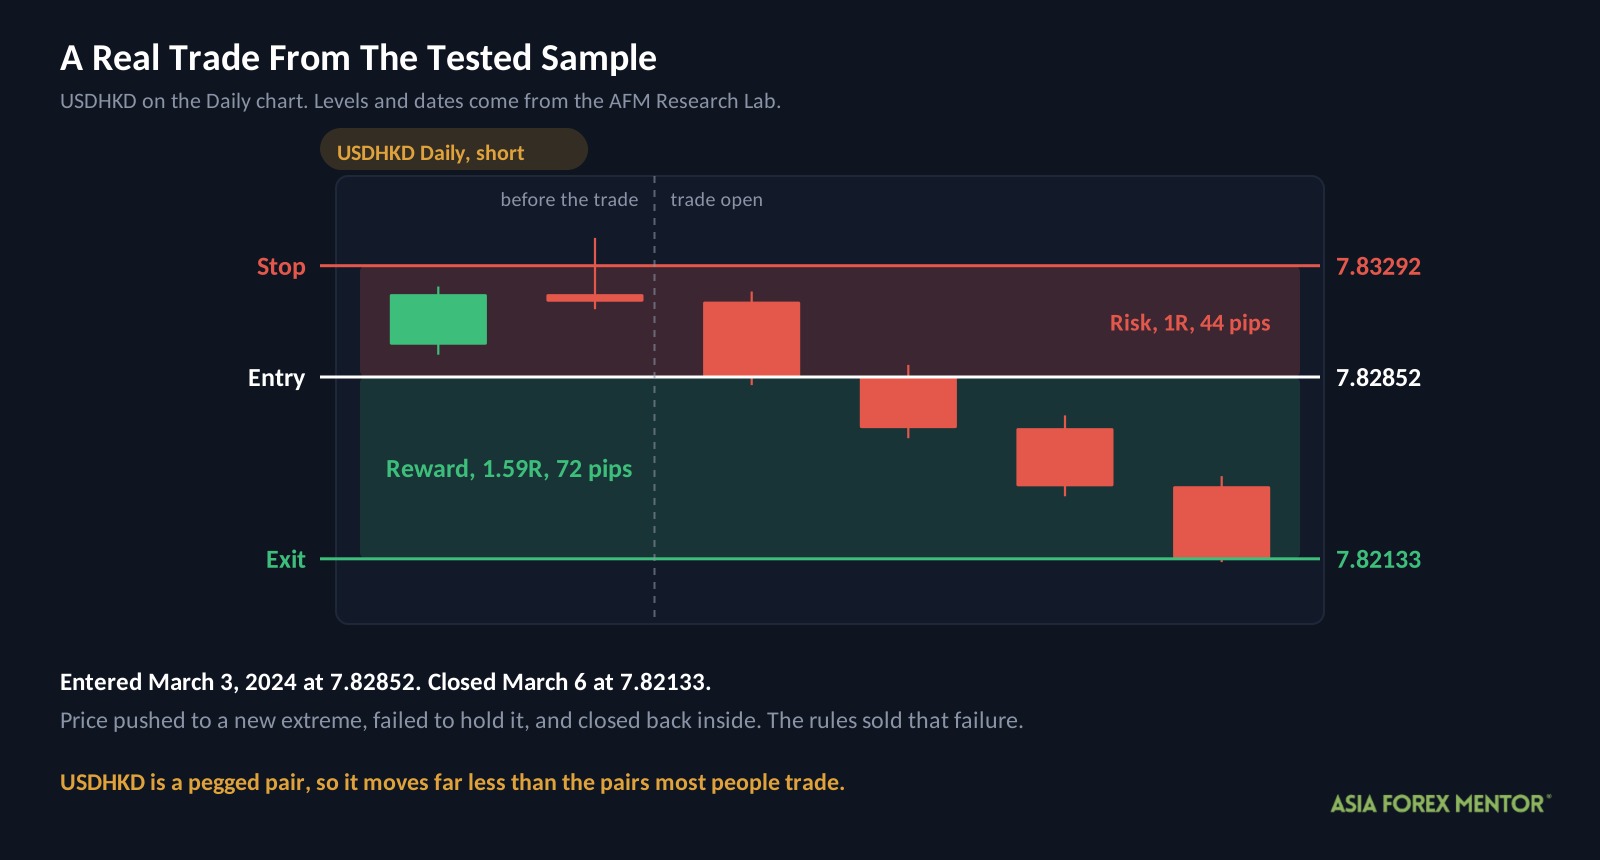
This is a real trade from the filtered sample, and it is an above average one rather than a typical week.
| Detail | Value |
|---|---|
| Pair and chart | USDHKD, Daily |
| Direction | Short, meaning a sell |
| Entry | March 3, 2024 at 7.82852 |
| Stop | 7.83292 |
| Exit | March 6, 2024 at 7.82133 |
| Result | +1.59R |
Price pushed to a new extreme, failed to hold it, and closed back inside. The rules sold the failure, risked 44 pips to the stop at 7.83292, and took 72 pips three days later.
One detail is worth noticing. USDHKD is a pegged currency pair, held by the Hong Kong Monetary Authority inside a narrow band, so it moves far less than the pairs most people trade.
That a pegged pair produced one of the better trades in the filtered set tells you something about what survived the filters. When only 42 setups clear your rules across 28 pairs, you do not get to choose which pairs they come from.
How Should You Practice Turtle Soup?
I would not trade these rules with real money. Spotting a failed breakout is a genuinely useful skill, so here is how I would build it.
- Open a Daily chart on one pair and mark the highest high and lowest low of the last 20 bars.
- Scroll forward and find every point where price traded beyond one of those levels and then closed back inside.
- For each one, write down the entry, a 1 ATR stop beyond the extreme, and a 1R target.
- Walk the chart forward one bar at a time and record whether the target, the stop, or the fifth bar came first.
- Do at least 50 by hand, because fewer than that will not tell you anything.
- Repeat with a 55 bar lookback and count how many setups you lose.
- Check your results pair by pair, and note which pairs produced most of them.
- Split your results into four date ranges and check whether each one made money on its own.
That sixth step is the one that teaches the lesson of this article. Watching your own sample shrink as you add filters is more convincing than reading about it.
Sound risk management is what keeps the exercise cheap if you decide to test any of this live.
Is Turtle Soup Worth Your Time?
As a mechanical system, no. However, as a lesson in how backtests mislead, it is the most valuable thing we have tested.
- The textbook rules turned $10,000 into $1,571 across 2,851 trades, with an 89.5 percent max drawdown.
- The filtered rules finished at $10,306, a gain of about 3 percent across nine years.
- However, that result rests on 42 trades, and one of the four periods inside it contained only 8.
The idea itself is not stupid. After all, failed breakouts are real, and traders really are trapped by them. Moreover, 49 percent of textbook trades won, which is close enough to suggest something is there.
In short, being close is not the same as being profitable. That is why filtering your way to a positive number is the easiest mistake in testing. The filters did not find the edge. They found 42 trades.
Also Read: Breakout Patterns, Profitably Trading The Chart Pattern Disruptions
Frequently Asked Questions
Does Turtle Soup Trading Work?
Not as written. In fact, the AFM Research Lab ran it across 2,851 trades and nine years of Daily data. As a result, a $10,000 account finished at $1,571, after falling 89.5 percent from its high point.
What Is Turtle Soup Trading?
Turtle Soup trading is a strategy that fades failed breakouts. For example, price breaks a recent high and then fails to hold it. The trade then goes the other way, because the breakout has trapped the traders who bought it.
How Many Trades Does A Backtest Need?
More than 42. A few hundred is a reasonable floor, because at smaller sizes a handful of trades landing differently changes the entire result, which is exactly what happened to the filtered version here.
Why Did The Filtered Version Make Money?
Because four filters removed 98.5 percent of the setups and left 42 trades. Those 42 happened to come out slightly ahead, by about 3 percent across nine years, which is a sample too small to separate skill from chance.
Is An 89.5 Percent Drawdown Survivable?
No. An account down 89.5 percent needs a gain of more than 850 percent to return to its starting point, and the textbook version is not tradable as written for that reason alone.
What Does The ADX Filter Do?
ADX measures how strong a move is, from 0 to 100, without saying which way it points. Requiring it below 25 keeps the strategy out of trending markets, where a breakout is more likely to be genuine rather than a trap.
Why Does Walk Forward Testing Matter?
Because an average hides the shape of a result. For example, splitting these nine years into four periods showed that each one held only 8 to 12 trades. As a result, the headline number rests on almost nothing.