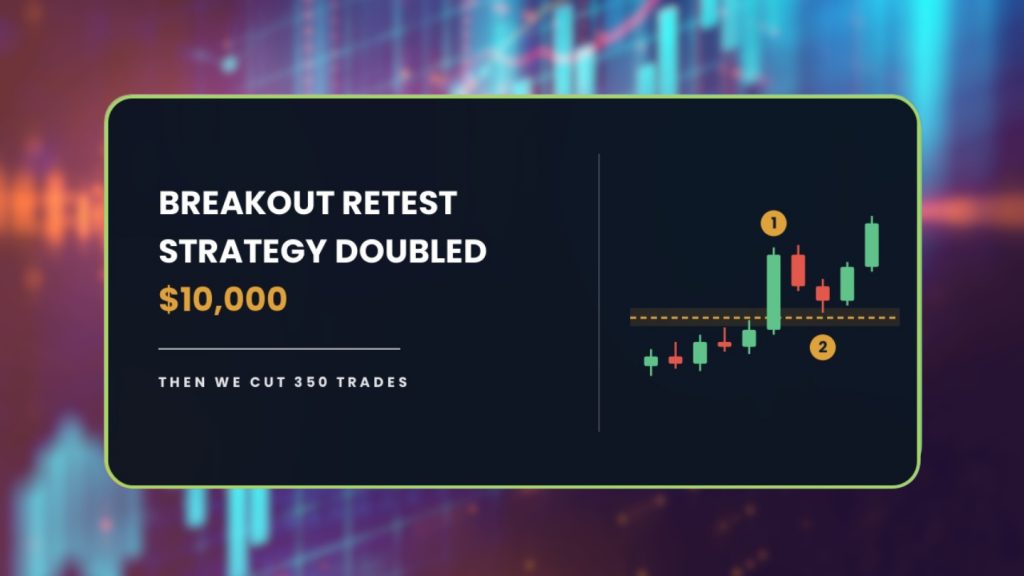
Almost every breakout retest strategy tutorial tells you to buy the pullback and skips the part that decides whether you make money. We tested the rules as written across 459 trades on 28 pairs. The entry was never the problem.
| About This Guide |
|---|
| This guide explains what the breakout retest strategy is, the exact entry, stop and target rules we put through the AFM Research Lab, and what happened across 28 forex pairs and just over eight years of Daily data. You will finish knowing what the tested results say, what the two filters changed, and how much of the improvement you should actually trust. |
| Quick Answer |
|---|
| The breakout retest strategy waits for price to break a recent high or low, then buys when price returns to touch that level again. In the AFM Research Lab the textbook rules turned $10,000 into $20,549 across 28 pairs on the Daily chart, with a 22.1 percent worst fall. A filtered version earned more per trade with a 7.7 percent fall. |
What Happened When We Tested The Breakout Retest Strategy
Two accounts, both starting at $10,000. One traded the rules you will find in most tutorials. The other traded a filtered version the AFM Research Lab built on top of them.
Both made money, which has not happened before in this series.
| Version | Start | End | Max drawdown | Trades |
|---|---|---|---|---|
| Textbook | $10,000 | $20,549 | 22.1% | 459 |
| Filtered | $10,000 | $14,750 | 7.7% | 109 |
Drawdown is how far an account falls from its highest point. In other words, it is not how far you are up or down overall, it is the size of the worst slide from a peak to the low that followed.
Both versions stayed inside the 30 percent limit most traders work to. That alone separates this test from everything else we have published.
The filtered version made fewer dollars because it took far fewer trades. At its lowest point it held about $9,230, barely below the starting balance.
The test ran from August 14, 2018 to October 15, 2026, across 28 currency pairs on the Daily chart. Each trade risked 1 percent of the account, and trading costs were charged at 0.05 percent of the entry price per round trip.
These are backtest results. Backtesting is not live trading, and past results do not guarantee future performance.
Key Takeaways
- The textbook rules more than doubled the account across 459 trades, finishing at $20,549.
- However, getting there meant holding through a 22.1 percent fall from the account’s high point.
- Two filters cut that fall to 7.7 percent and raised the result per trade from 16.9R to 36.9R per hundred.
- The filtered version made fewer dollars, because the filters cut the trade count from 459 to 109.
- All four time periods stayed positive, although one of them contained only 16 trades.
What Is The Breakout Retest Strategy And How Does It Work?
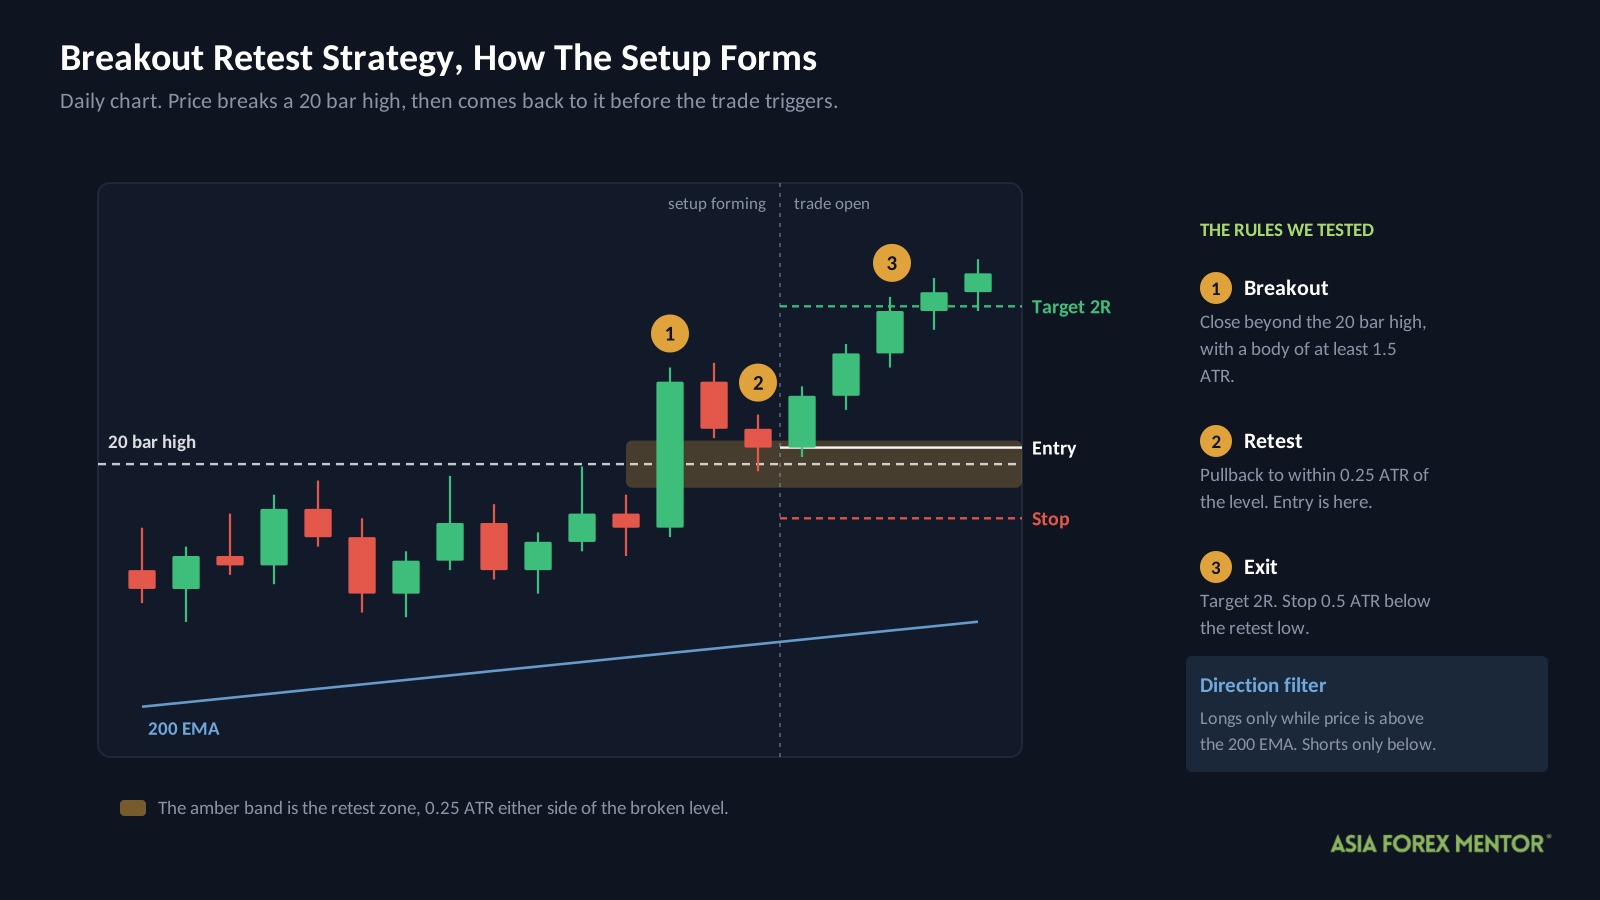
The breakout retest strategy waits for price to push through a level that has held for weeks, then enters when price comes back to touch that level from the other side. It does not buy the break itself.
The level in this test is the highest high or lowest low of the last 20 days. When price closes beyond it with a large enough candle, a breakout is recorded.
Then the waiting starts. The trade only triggers if price pulls back to that broken level, which is the retest the strategy is named after.
The logic is that a level which held for 20 days does not stop mattering the moment price crosses it. Instead it flips, and the old ceiling becomes the new floor.
How Do Most Traders Trade The Breakout Retest?
They confirm the direction, wait for a decisive break, then buy the pullback.
Four terms you need first.
R is what you risk on one trade, measured from entry to stop. On a $10,000 account risking 1 percent, 1R is $100, so a 2R target aims for $200.
ATR means Average True Range, which is how much a pair usually moves in a day. A stop set in ATR therefore sizes itself to each pair rather than using the same pip distance everywhere.
EMA means exponential moving average, an average of recent prices that weights the newest days most heavily. A 200 period EMA on the Daily chart describes the direction of roughly the last ten months.
Here are the rules exactly as we tested them.
| Rule | Setting |
|---|---|
| Chart | Daily |
| Direction filter | Price above the 200 EMA for longs, below it for shorts |
| Breakout level | The 20 bar high for longs, the 20 bar low for shorts |
| Breakout strength | The breaking candle’s body must be at least 1.5 ATR |
| Retest | Price must pull back within 0.25 ATR of the broken level |
| Entry | At the retest |
| Stop loss | 0.5 ATR below the retest low for longs |
| Target | 2R, closed after 10 bars if not reached |
| Risk per trade | 1 percent of the account |
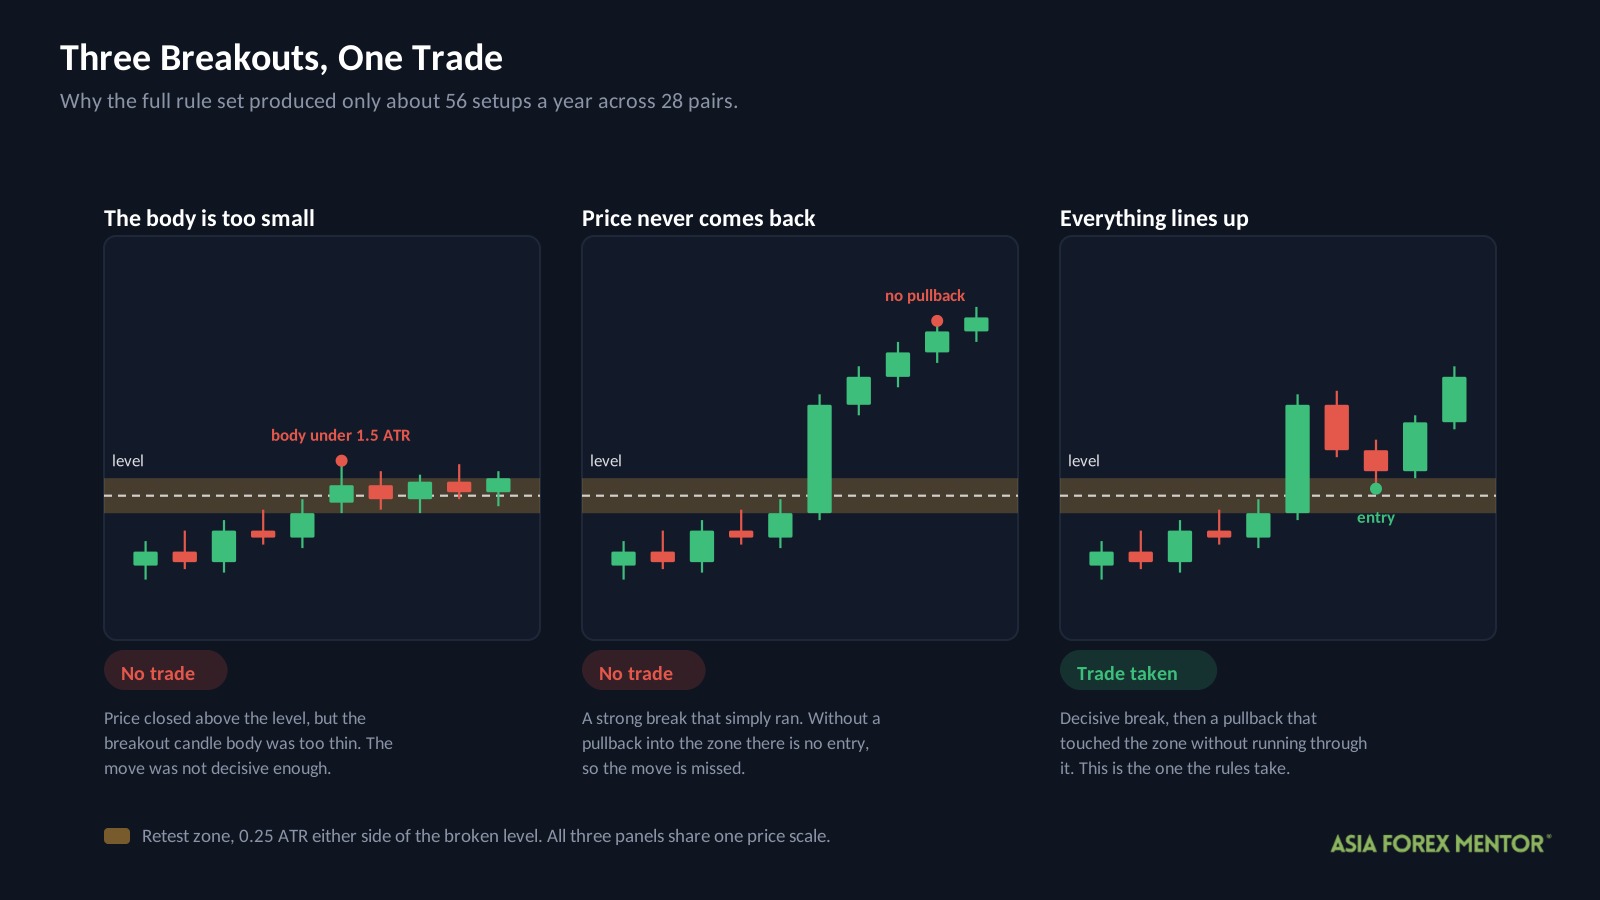
Notice how much has to line up. A trend, a break, a strong candle, and then a pullback that comes close without going too far. Consequently the setup is rare, which is why 28 pairs produced only about 56 trades a year.
Does The Textbook Version Make Money?
Yes. Over 459 trades and just over eight years it more than doubled the account.
| Metric | Textbook |
|---|---|
| Trades | 459 |
| Win rate | 41% |
| Average win | +1.91R |
| Average loss | -1.04R |
| Expectancy | +0.17R |
| Profit factor | 1.28 |
| Yearly growth rate | 9.2% |
| Max drawdown | 22.1% |
| Ending balance from $10,000 | $20,549 |
Three of those need defining.
Expectancy is what the average trade earns or loses, measured in R. At plus 0.17R, every trade made back about a sixth of what it risked, and 459 of those is what doubles an account.
Profit factor is total winnings divided by total losses. Above 1 means the strategy made money, so 1.28 says it took in $1.28 for every dollar it paid out.
Yearly growth rate, often written as CAGR, is the rate the account grew each year on average. At 9.2 percent a year, compounding over eight years, $10,000 becomes $20,549.
Now the useful part. The average win was 1.91R and the average loss 1.04R, so this setup only needs to win about 35 percent of the time to break even. It won 41 percent. That six point cushion is why it worked. Unlike most setups we have tested, this one was not scraping the line, it was comfortably clear of it.
The catch is the 22.1 percent fall. On a $10,000 account that means watching more than $2,200 disappear from a high point, which is where most people abandon a system that is actually working.
What Settings Did We Change And Why?
The entry, the stop and the 2R target were left alone. Instead the AFM Research Lab added two conditions that decide whether a valid setup gets taken at all.
| Filter | Condition | The idea behind it |
|---|---|---|
| Volatility | 14 day ATR between the 30th and 70th percentile of its own past year | Skip unusually quiet and unusually wild markets |
| Trend strength | ADX(14) at 25 or above | Only trade when a real trend is in place |
ADX means Average Directional Index, a reading from 0 to 100 that measures how strong a move is without saying which way it points. Above 25 is generally read as a trending market, while below 25 suggests price is drifting sideways.
The two work together rather than separately. One asks whether conditions are normal, the other asks whether there is a trend worth following.
These settings were chosen by searching 12 combinations against the test history. That has a name, in sample optimization, and it means the test already knew which settings scored best. Consequently the filtered figures should be read as promising rather than proven.
Did The New Settings Work?
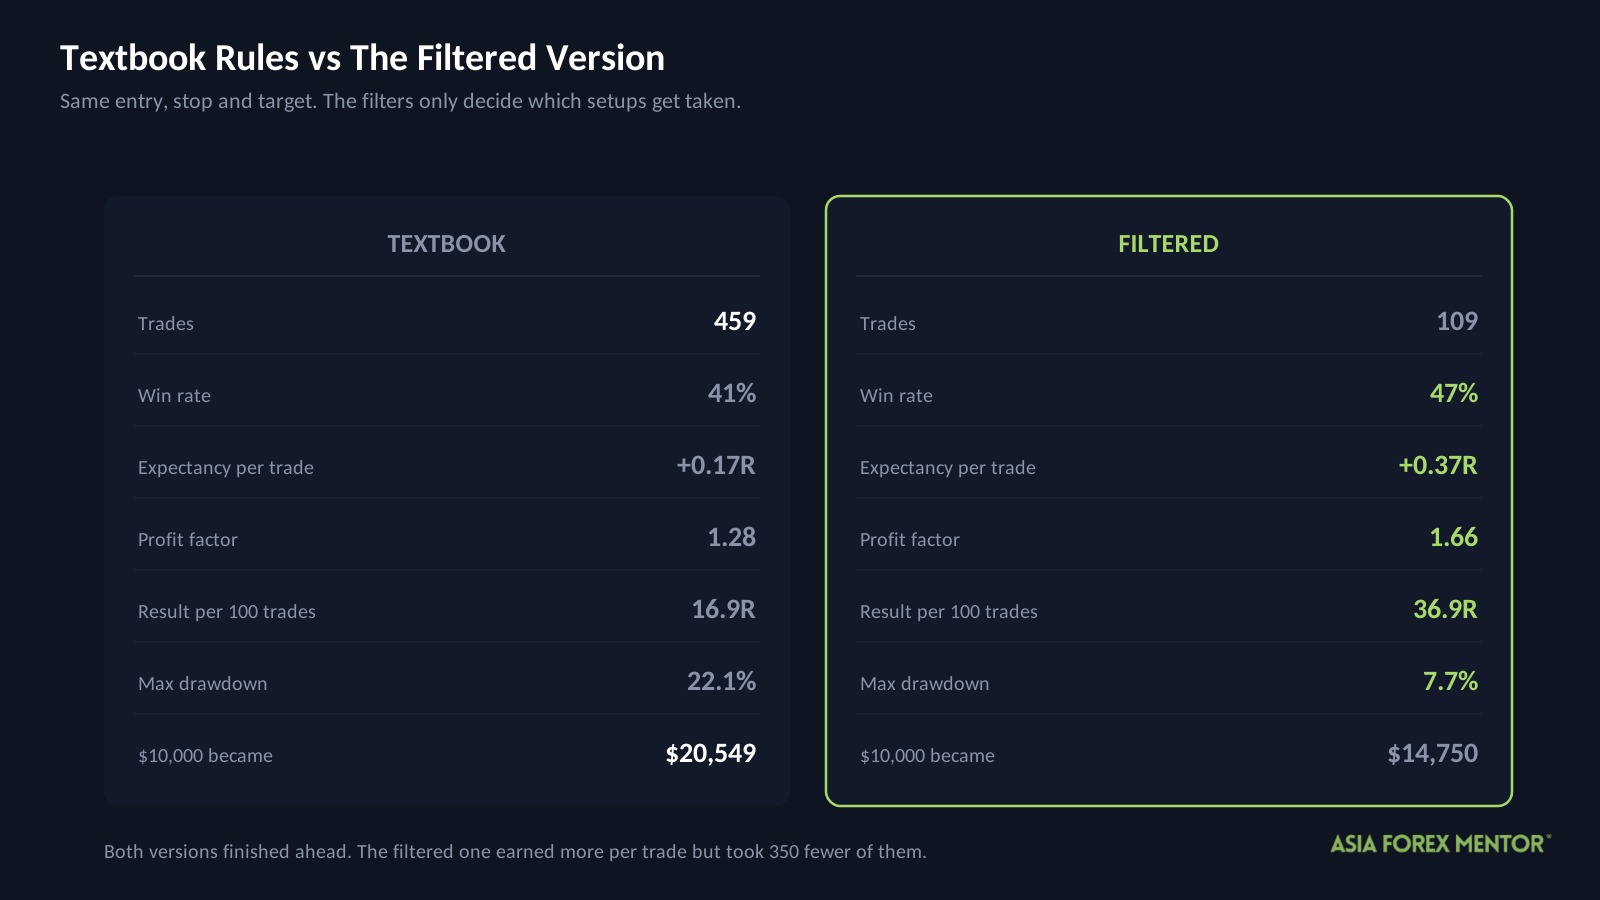
Every quality measure improved. The total dollar result went down.
| Metric | Textbook | Filtered |
|---|---|---|
| Trades | 459 | 109 |
| Win rate | 41% | 47% |
| Expectancy | +0.17R | +0.37R |
| Profit factor | 1.28 | 1.66 |
| Yearly growth rate | 9.2% | 4.9% |
| Max drawdown | 22.1% | 7.7% |
| Ending balance from $10,000 | $20,549 | $14,750 |
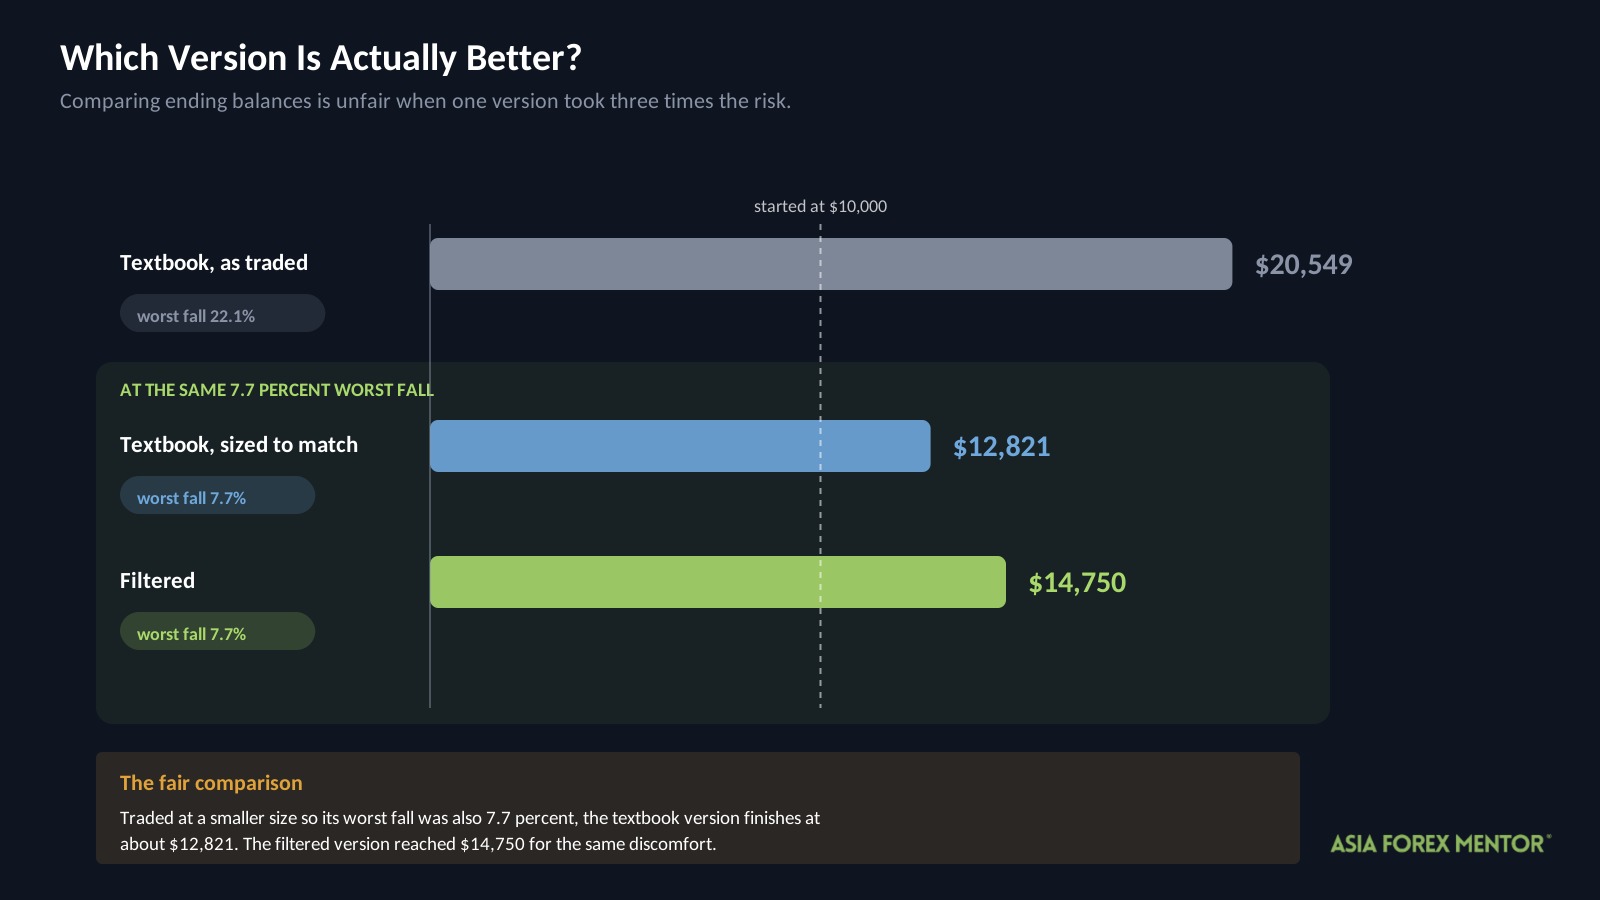
The win rate rose six points, expectancy more than doubled, and the worst fall dropped from 22.1 percent to 7.7 percent. Measured per hundred trades, the filtered version earned 36.9R against the textbook version’s 16.9R.
The ending balance fell because the filters removed 350 of the 459 setups. A better edge applied 13 times a year produces fewer dollars than a thinner edge applied 56 times a year.
So which is actually better? Comparing the ending balances answers the wrong question, because the two versions took very different amounts of risk to get there.
The fair comparison holds the pain constant. If you traded the textbook version at a smaller size so that its worst fall was also 7.7 percent, it would have finished at about $12,821. The filtered version reached $14,750 with that same 7.7 percent fall.
That is the real finding. For the same discomfort, the filtered version produced more.
Did The Result Hold In Every Time Period?
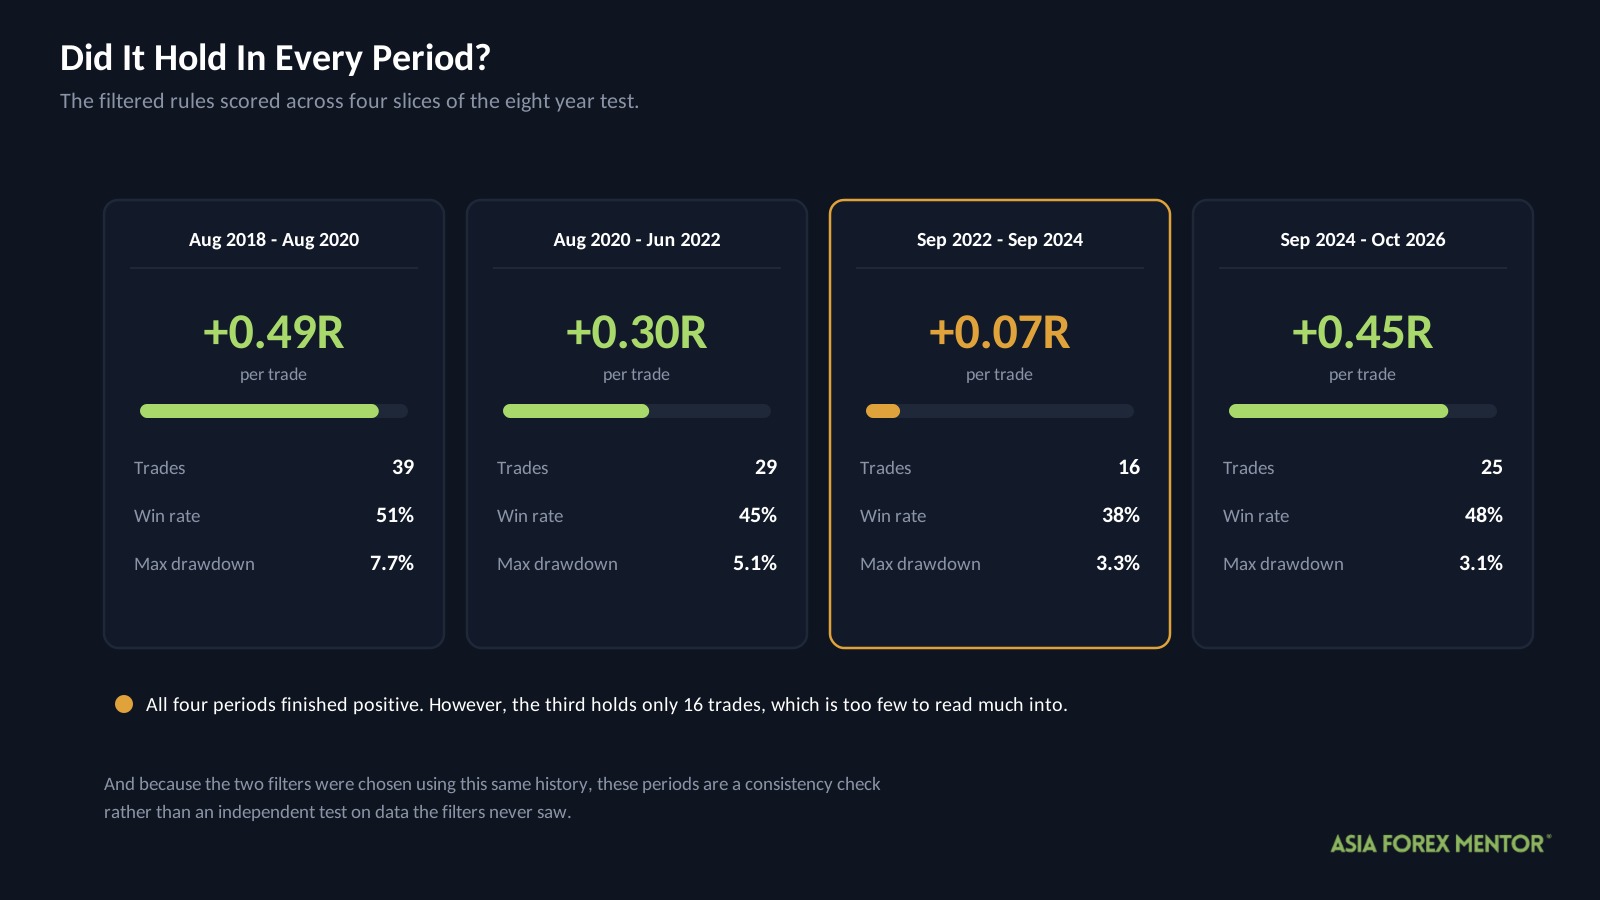
The AFM Research Lab split the eight years into four periods and scored the filtered rules in each. This is called walk forward testing, and it checks whether a result holds across eras or rests on one lucky stretch.
| Period | Trades | Win rate | Expectancy | Yearly growth rate | Max drawdown |
|---|---|---|---|---|---|
| Aug 2018 to Aug 2020 | 39 | 51% | +0.49R | +10.0% | 7.7% |
| Aug 2020 to Jun 2022 | 29 | 45% | +0.30R | +6.9% | 5.1% |
| Sep 2022 to Sep 2024 | 16 | 38% | +0.07R | +0.5% | 3.3% |
| Sep 2024 to Oct 2026 | 25 | 48% | +0.45R | +5.7% | 3.1% |
All four periods were positive, and no period fell more than 7.7 percent from its high. That is the most consistent set of numbers in anything we have tested.
However, two things keep this from being conclusive. The filters were chosen using this same history, so these periods are a consistency check rather than an independent test.
And the third period produced only 16 trades at plus 0.07R, which is close enough to flat that it tells you very little on its own. A sample that small can land either side of zero by chance.
What About The Pairs?
In the filtered version, USDHKD, EURUSD and GBPCHF produced the highest expectancy. Meanwhile AUDNZD, GBPCAD and GBPUSD finished negative.
More importantly, no single pair held up across both halves of the data. The pairs that worked early were not the pairs that worked late.
That matters more than the rankings. It means picking the best pairs from this table would be fitting to the past rather than finding an edge, and the sensible response is to spread study across many pairs rather than concentrate on three.
One note on USDHKD. It is a pegged currency pair, held inside a narrow band, so it moves far less than the pairs most people trade and its appearance near the top says more about the filters than about the pair.
What Does A Winning Trade Look Like?
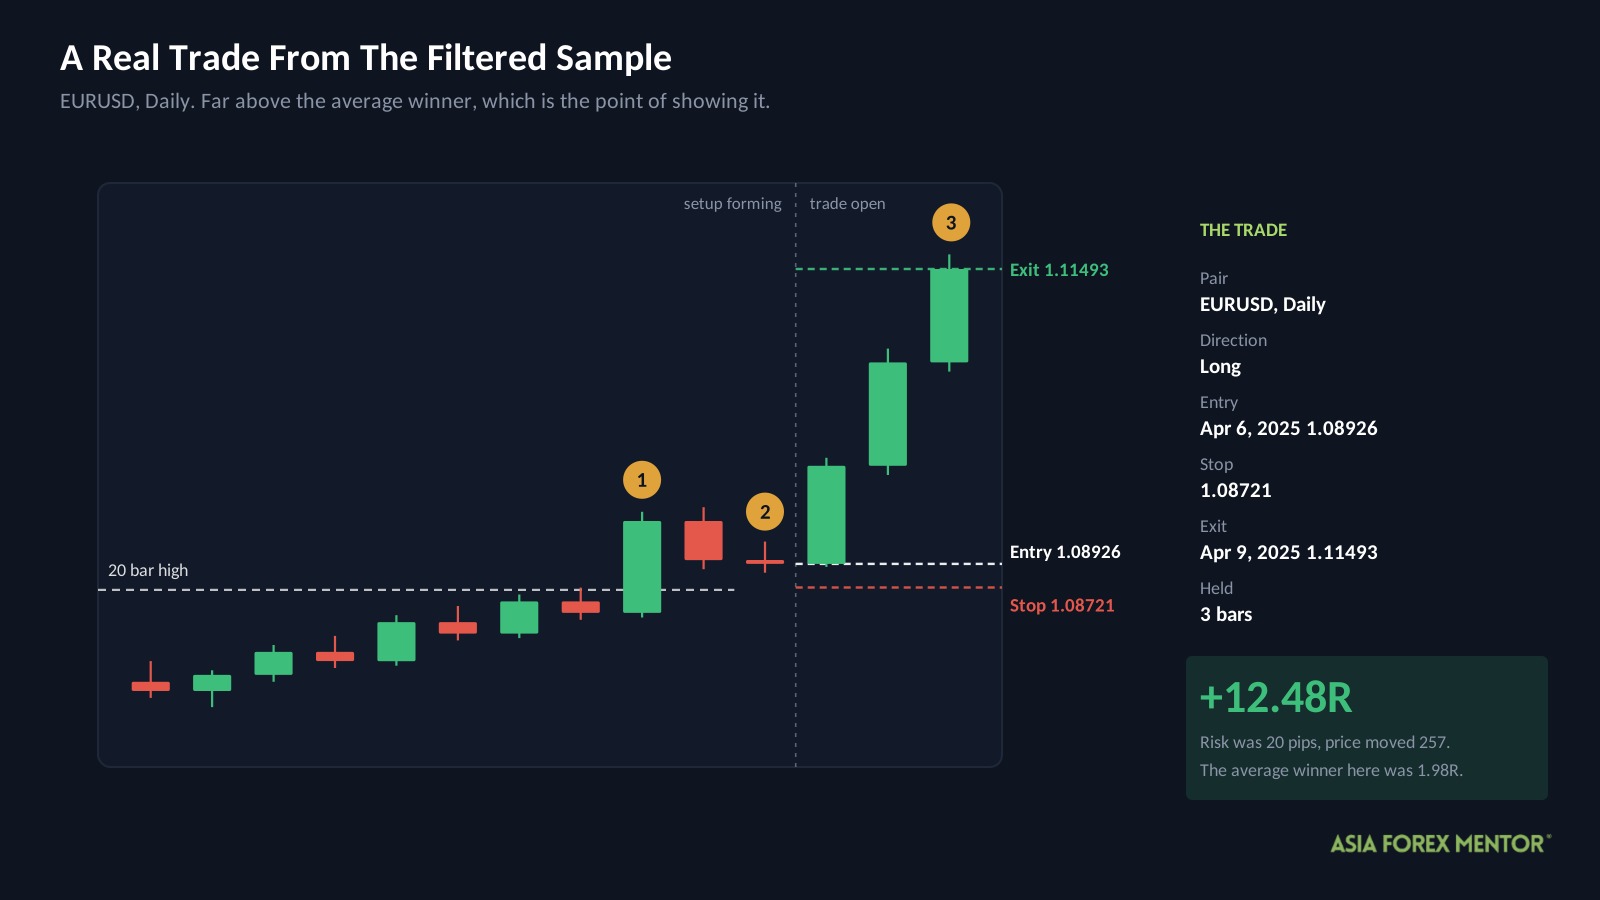
This is a real trade from the filtered sample, and it is far above average rather than typical.
| Detail | Value |
|---|---|
| Pair and chart | EURUSD, Daily |
| Direction | Long, meaning a buy |
| Entry | April 6, 2025 at 1.08926 |
| Stop | 1.08721 |
| Exit | April 9, 2025 at 1.11493 |
| Result | +12.48R in 3 bars |
The risk here was tiny, only 20 pips from entry to stop. Price then moved 257 pips in three days, which is why the payoff was so large relative to the risk.
At entry, price had broken the 20 bar high with a large candle and pulled back close to that level. Both filters were satisfied, with ATR in its normal range and ADX above 25.
Set this against the filtered version’s average win of 1.98R. One trade paid more than six times the usual winner, which tells you how much a single trending week can distort a small sample.
How Should You Practice The Breakout Retest?
This is the first setup in the series I would say is worth studying properly rather than only as a cautionary tale. That is still not the same as trading it next week.
- Open a Daily chart on one pair and add the 200 EMA, ADX(14) and ATR(14).
- Mark the 20 bar high and the 20 bar low, and update them each day.
- Scroll back a year and find every close beyond one of those levels with a large candle body.
- For each one, note whether ADX was above 25 and whether ATR sat in the middle of its past year range.
- Where both held, mark the retest entry, a 0.5 ATR stop and a 2R target.
- Walk the chart forward and record whether the target, the stop, or the tenth bar came first.
- Log at least 30 before comparing your win rate and expectancy against the figures above.
- Then paper trade for at least 30 days before any real money is involved.
The slow part is unavoidable. At roughly 13 filtered trades a year, feedback arrives slowly, which makes this a setup you learn from history rather than from live screens.
Sound risk management is what makes a 22 percent drawdown survivable if you ever trade the unfiltered version.
Is The Breakout Retest Strategy Worth Your Time?
For once, yes, with conditions.
- The textbook rules turned $10,000 into $20,549 across 459 trades, with a 22.1 percent max drawdown.
- The filtered version earned 36.9R per hundred trades against 16.9R, and cut the worst fall to 7.7 percent.
- All four periods stayed positive, although the filters were selected on this same history.
What makes this different from the other setups we have tested is the cushion. A 41 percent win rate against a 35 percent break even point is real margin, and margin is what survives contact with live spreads and slippage.
What should hold you back is the sample. 109 filtered trades across eight years is thin, one period contained only 16, and the filters have not yet been tested on data they did not help choose.
So treat the textbook result as the finding and the filtered result as a promising direction. If you want to understand why the retest matters at all, start with how breakouts behave when they fail, because that is the other half of the same idea.
Also Read: Breakout Patterns, Profitably Trading The Chart Pattern Disruptions
Frequently Asked Questions
Does The Breakout Retest Strategy Work In Forex?
In this test, yes. The AFM Research Lab ran it across 459 trades and just over eight years of Daily data, and a $10,000 account finished at $20,549. However, holding that result meant sitting through a 22.1 percent fall from the account’s high point.
What Is A Breakout Retest?
It is the moment price returns to touch a level it has just broken through. For example, price closes above a 20 day high, then pulls back to that old high before continuing. Traders enter on that pullback rather than on the break.
What Filters Improve A Breakout Retest Strategy?
In this test, keeping ATR in its normal range and requiring ADX above 25 helped most. Together they cut the worst fall from 22.1 percent to 7.7 percent and more than doubled the result per trade.
How Many Trades Does The Breakout Retest Produce?
The textbook version produced about 56 trades a year across 28 pairs. Meanwhile the filtered version produced about 13, because the two filters skip most setups.
What Win Rate Does The Breakout Retest Need?
About 35 percent, given an average win of 1.91R against an average loss of 1.04R. The textbook version won 41 percent, which is a genuine cushion rather than a rounding error.
Which Pairs Work Best For Breakout Retests?
USDHKD, EURUSD and GBPCHF showed the highest expectancy in the filtered version. However, no pair held up across both halves of the data, so choosing pairs from that list would be fitting to the past.
Can A Part Time Trader Use This Setup?
Yes, because the Daily chart only needs checking once a day after the close. The tradeoff is that roughly 13 trades a year means feedback arrives slowly, so the learning curve is longer than on faster timeframes.