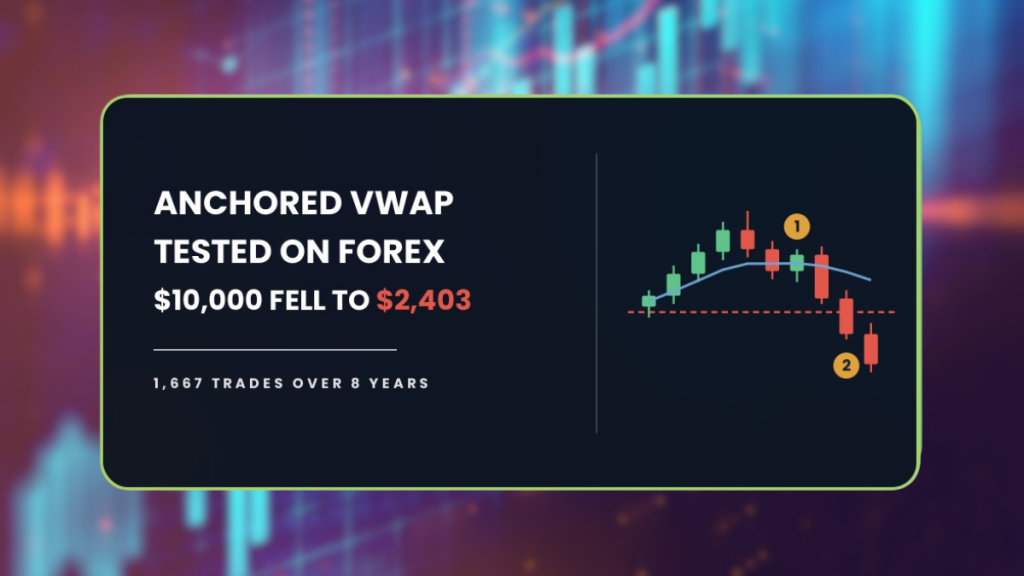
If you are trading anchored VWAP on forex, the line on your chart is not measuring what you think. Across 1,667 trades it took $10,000 down to $2,403. Here is what it is actually weighted by.
| About This Guide |
|---|
| This guide explains what anchored VWAP is, why it behaves differently on forex than on stocks, and the exact rules we put through the AFM Research Lab across 28 pairs and 8.2 years of Daily data. You will finish knowing what the test found, what two filters changed, and why neither version is tradable as written. |
| Quick Answer |
|---|
| Anchored VWAP pins an average price line to a swing point you choose, then treats that line as fair value to trade back to. In the AFM Research Lab it lost money across 1,667 trades on 28 forex pairs, ending at $2,403 from a $10,000 start. Two filters cut the loss per trade by 32 percent. |
What Happened When We Tested Anchored VWAP
Two accounts, both starting at $10,000. One traded the rules as they are commonly taught. The other added two conditions from the AFM Research Lab.
Both lost money.
| Version | Start | End | Max drawdown | Trades |
|---|---|---|---|---|
| Textbook | $10,000 | $2,403 | 80.0% | 1,667 |
| Filtered | $10,000 | $6,796 | 42.4% | 630 |
Drawdown is how far an account falls from its highest point. In other words, it is not your overall loss, it is the size of the worst slide from a peak to the low that followed.
Most traders treat 30 percent as the limit of what is survivable. Neither version came close, so neither is tradable as written.
The test ran from July 17, 2018 to October 15, 2026, across 28 currency pairs on the Daily chart. Each trade risked 1 percent of the account, and trading costs were charged at 0.05 percent of the entry price per round trip.
These are backtest results. Backtesting is not live trading, and past results do not guarantee future performance.
Key Takeaways
- The textbook rules lost money across 1,667 trades, ending at $2,403 from a $10,000 start.
- The worst fall was 80 percent, which almost no real account survives.
- The setup needed a 41 percent win rate to break even, and it managed 38.
- Two filters cut the loss per trade by 32 percent and the worst fall to 42.4 percent, yet the account still finished at $6,796.
- Forex has no central volume, so every forex VWAP is built on tick counts rather than contracts traded.
What Is Anchored VWAP?
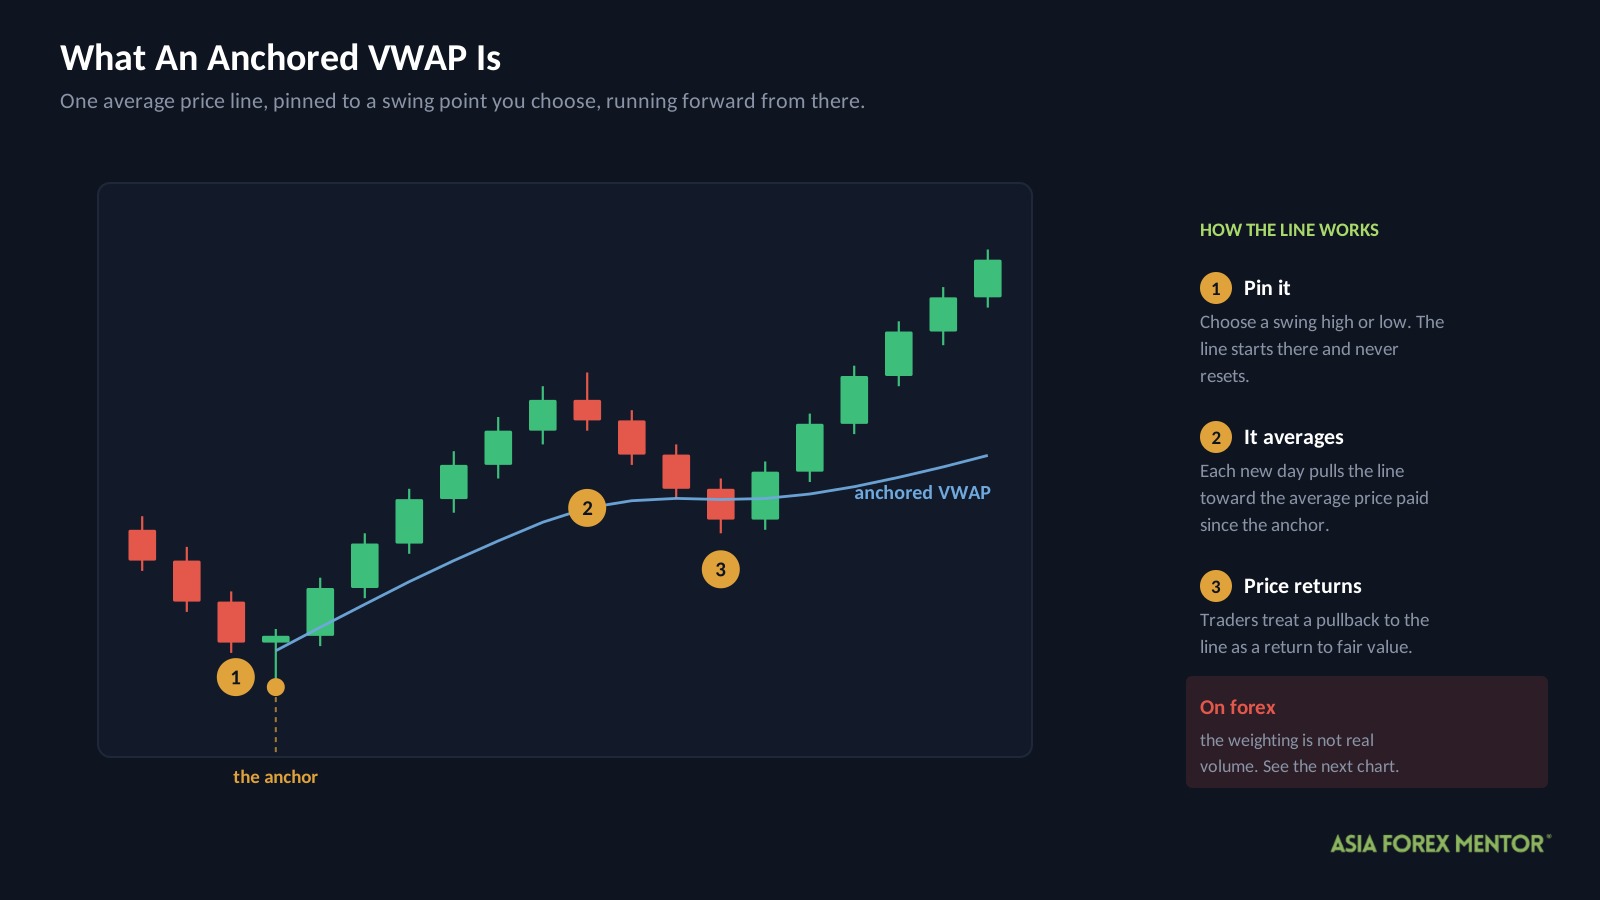
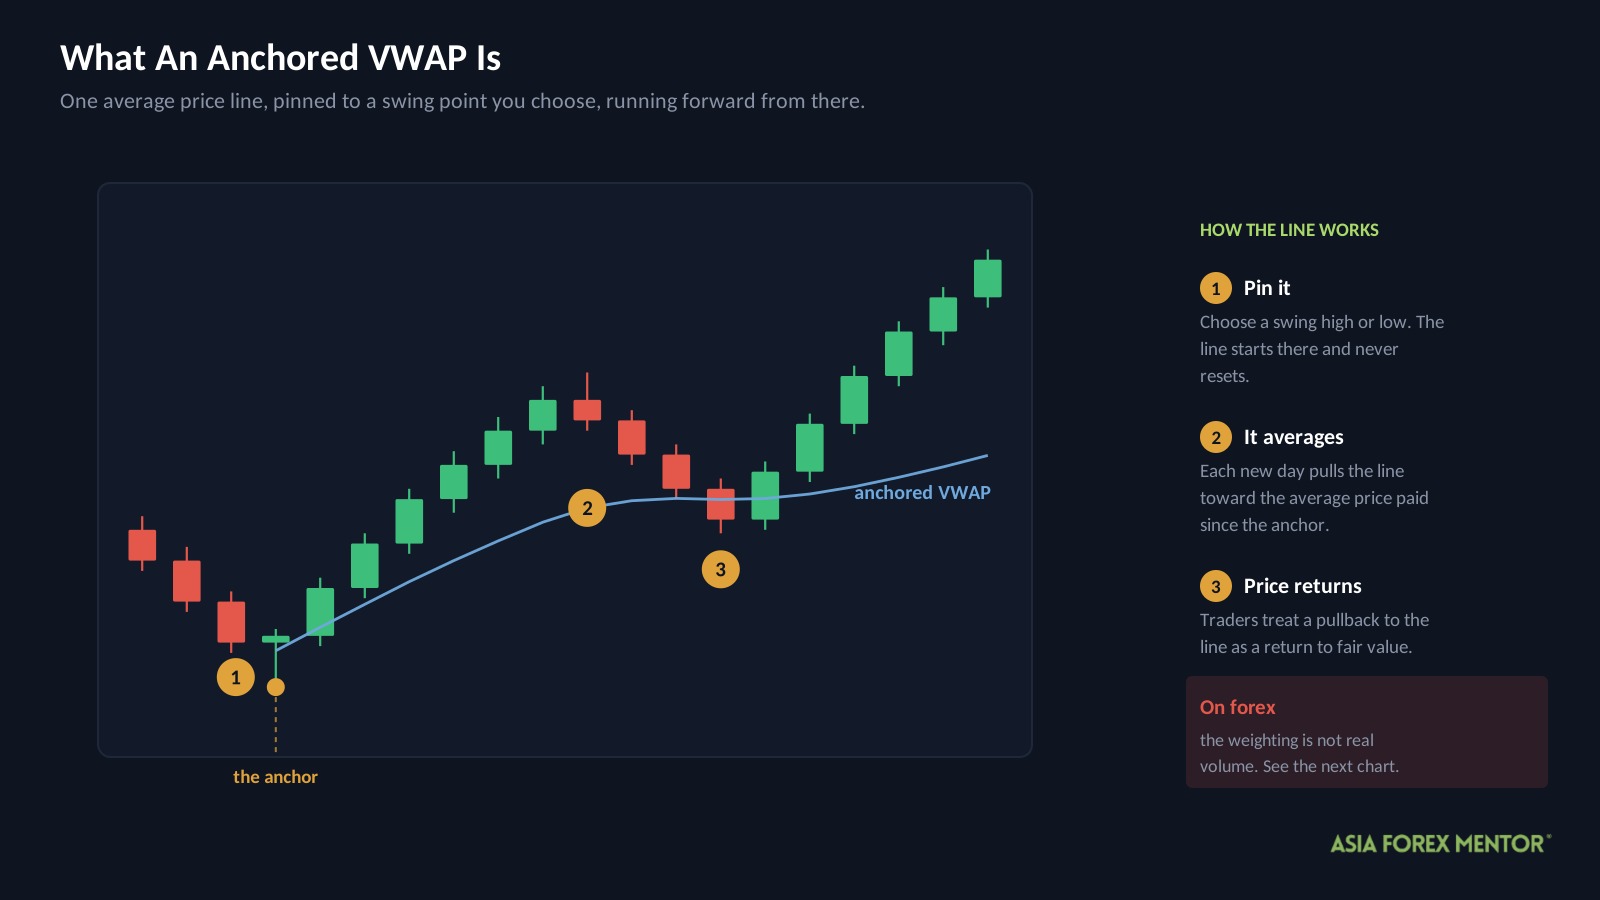
VWAP stands for volume weighted average price. It is the average price paid since a starting point, with busier prices counting for more than quiet ones.
A normal VWAP resets at the start of each session. An anchored VWAP does not. Instead you pin it to one moment you choose, usually a major swing high or swing low, and the line runs forward from there.
The idea is that the line shows what the market has agreed is fair since that event. When price drifts away and then returns to the line, traders read that as a pullback to fair value and enter in the direction of the original move.
Why Does Anchored VWAP Work Differently On Forex?
This is the part most guides leave out, and it matters more than any setting.
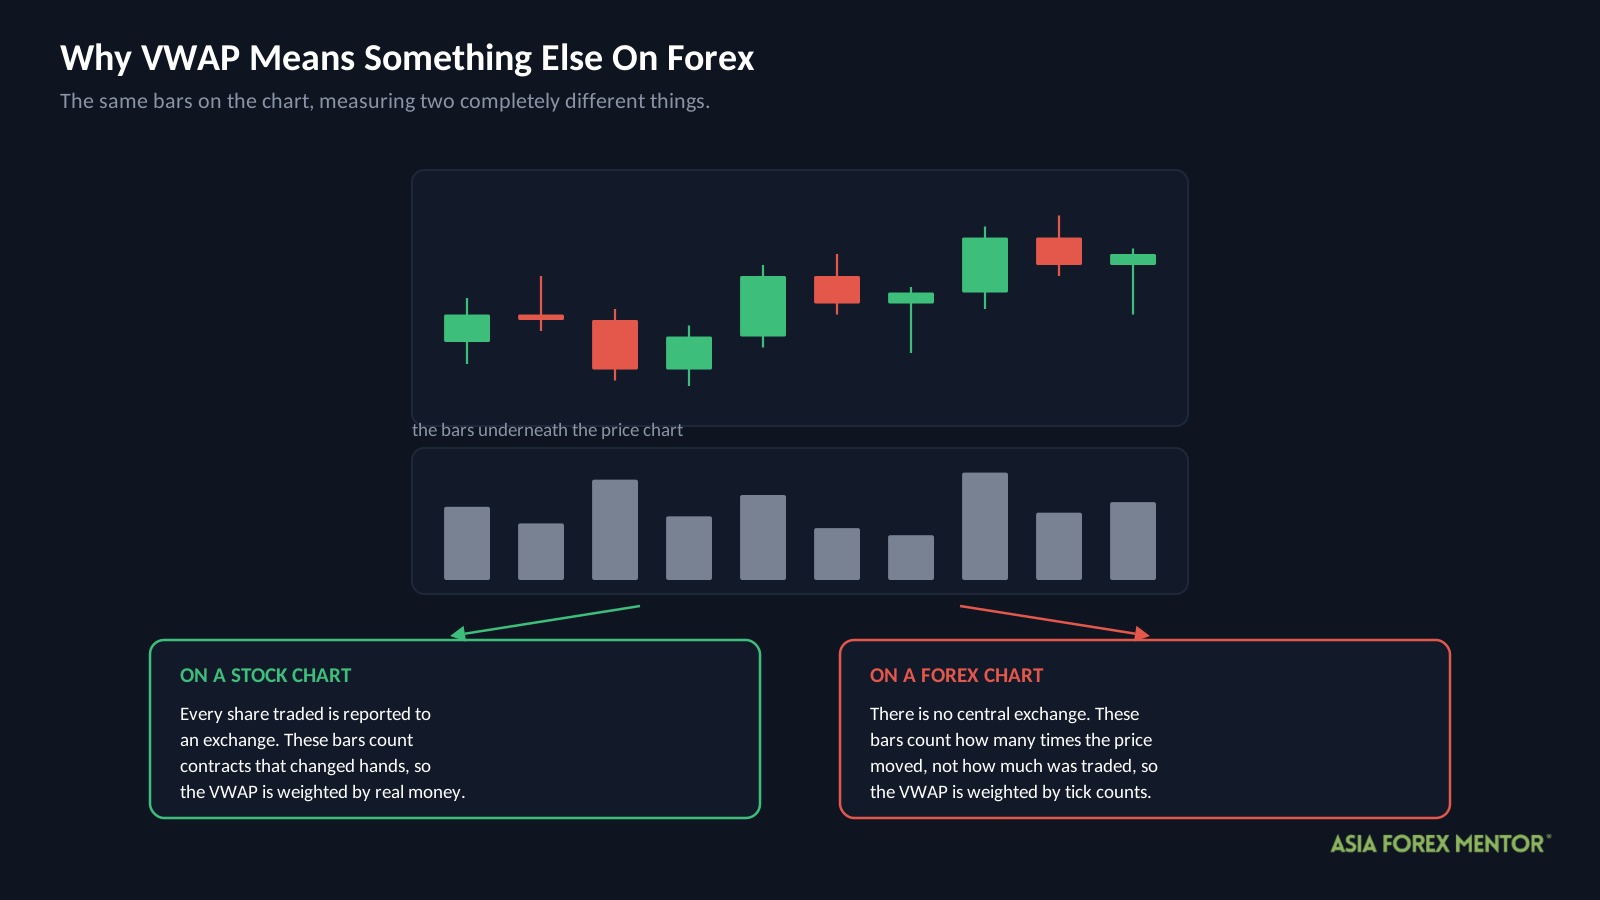
Forex has no central exchange and no consolidated volume report. Stocks trade on exchanges that publish every share traded, so a stock VWAP is weighted by real volume.
Currencies do not work that way. What a forex chart labels as volume is tick volume, which counts how many times the price changed rather than how much was traded. Every anchored VWAP on a forex chart is built on that number, including the one in this test.
That does not make the line meaningless. Tick activity and real activity usually rise and fall together, so the shape is roughly right.
However, it does mean a forex VWAP measures something looser than its stock equivalent. Anyone carrying this tool over from stocks should know that before they trust the line.
How Do Most Traders Trade Anchored VWAP?
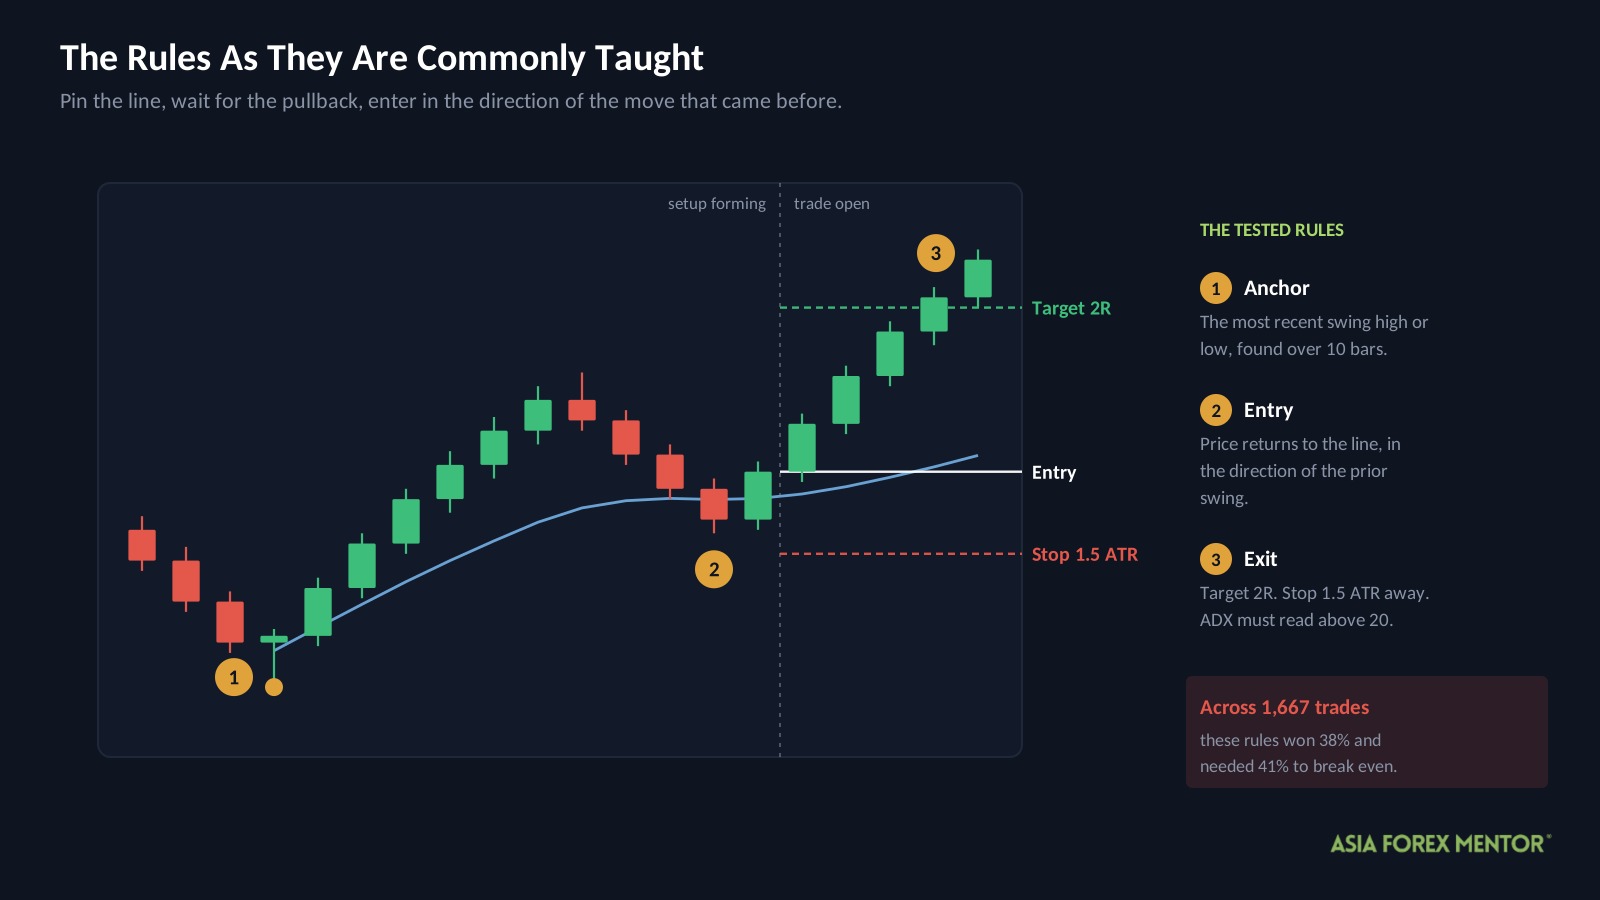
Anchor the line, wait for price to come back to it, and enter in the direction of the move that came before.
Three terms you need first.
R is what you risk on one trade, measured from entry to stop. On a $10,000 account risking 1 percent, 1R is $100, so a 2R target aims for $200.
ATR means Average True Range, which is how far a pair usually moves in a day. A stop set in ATR therefore sizes itself to each pair instead of using the same pip distance everywhere.
ADX means Average Directional Index, a reading from 0 to 100 that measures how strong a move is without saying which way it points. Above 20 suggests some trend is present.
Here are the rules exactly as we tested them.
| Rule | Setting |
|---|---|
| Chart | Daily |
| Anchor | The most recent swing high or low, found with a 10 bar lookback |
| Entry | When price returns to the VWAP line, in the direction of the prior swing |
| Stop loss | 1.5 times ATR below entry for longs, above for shorts |
| Target | 2R |
| Trend filter | ADX above 20 |
| Timing check | 14 period RSI |
| Risk per trade | 1 percent of the account |
That is the version taught almost everywhere, and it is the version that produced the $2,403.
Why Did The Textbook Version Lose?
| Metric | Textbook |
|---|---|
| Trades | 1,667 |
| Win rate | 38% |
| Average win | +1.38R |
| Average loss | -0.97R |
| Expectancy | -0.08R |
| Profit factor | 0.87 |
| Yearly growth rate | -15.9% |
| Max drawdown | 80.0% |
| Ending balance from $10,000 | $2,403 |
Three of those need defining.
Expectancy is what the average trade earns or loses, in R. At minus 0.08R, every trade cost about a twelfth of what it risked, and 1,667 of those is how an account reaches $2,403.
Profit factor is total winnings divided by total losses. Below 1 means the strategy lost money, so 0.87 says it paid out $1 for every 87 cents it took in.
Yearly growth rate, often written as CAGR, is the average rate the account changed each year. At minus 15.9 percent a year, compounding over eight years, $10,000 becomes $2,403.
Now the arithmetic that explains it. The average win was 1.38R and the average loss 0.97R, so this setup needed to win about 41 percent of the time just to break even.
It won 38 percent.
Three points is a small miss. However, applied across 1,667 trades it is the difference between a flat account and three quarters of the money gone. Every hundred trades cost about 7.8R.
What Did We Change?
The entry, stop and target were left alone. Instead the AFM Research Lab added two conditions that decide whether a valid setup gets taken.
| Filter | Condition | The idea behind it |
|---|---|---|
| Calm market | 14 day ATR in the bottom 40 percent of its past year | In fast markets price overshoots the line before reversing |
| Candle close | The daily candle must close in the trade’s direction | A candle that touches the line and closes back through it was already failing |
Both rules point at the same weakness. An anchored VWAP entry assumes price will respect a line, and the two situations where it does not are a market moving too fast to care and a candle that has already rejected it.
One caution before the results. These settings were chosen by searching the test history, which has a name, in sample optimization, so treat the improvement as the optimistic case rather than a proven one.
Did The Filters Work?
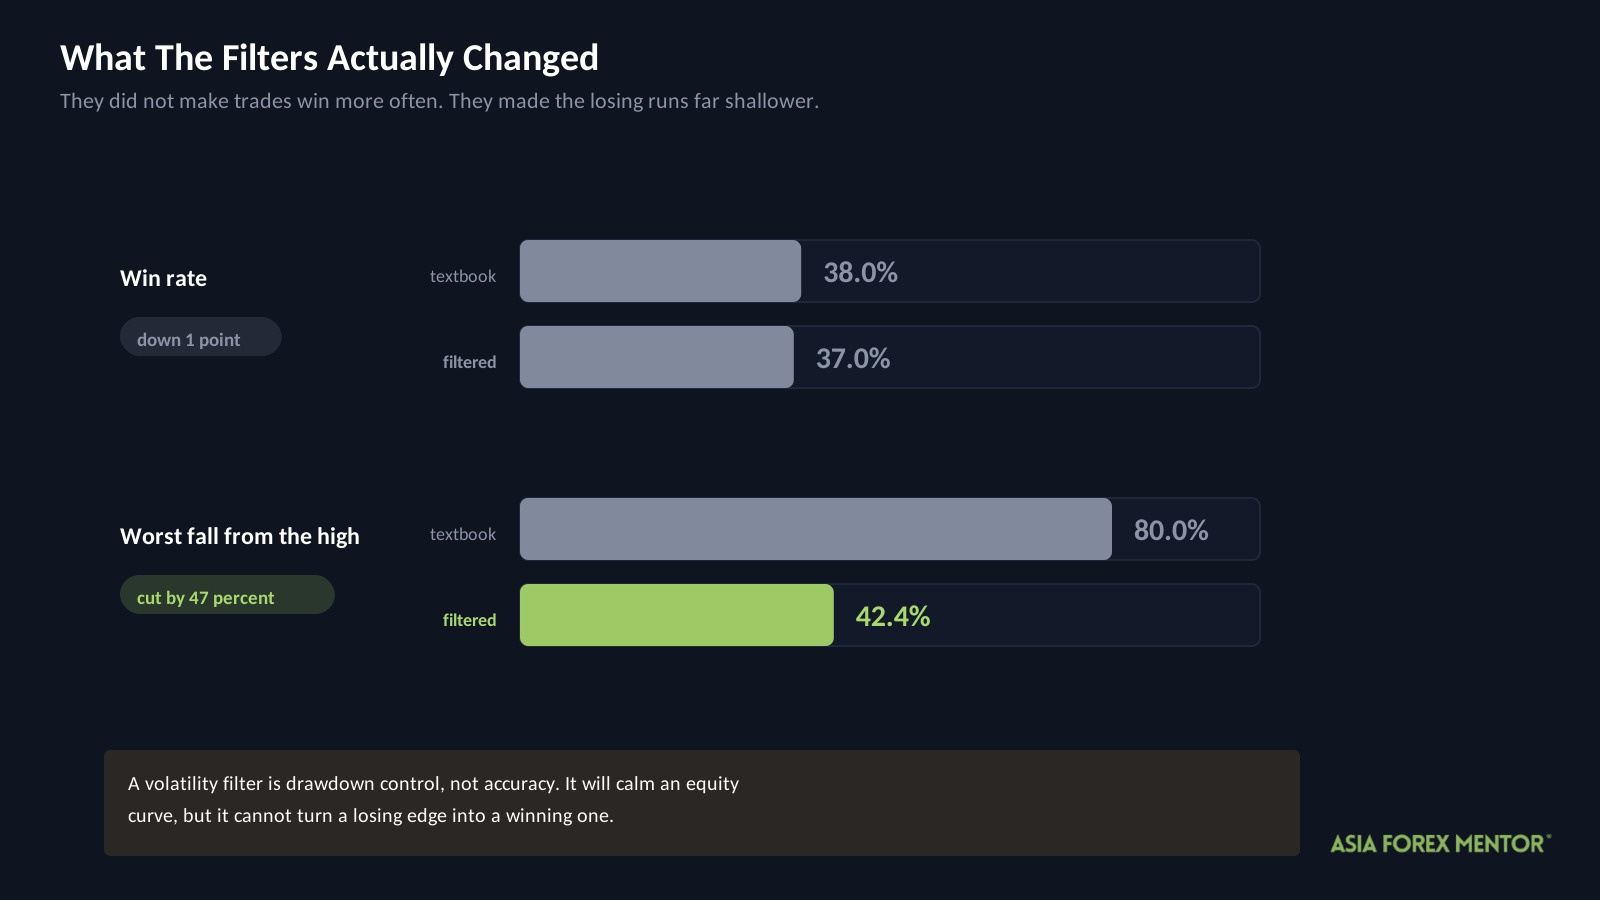
The account still lost money, but the damage changed shape.
| Metric | Textbook | Filtered |
|---|---|---|
| Trades | 1,667 | 630 |
| Win rate | 38% | 37% |
| Expectancy | -0.08R | -0.05R |
| Profit factor | 0.87 | 0.92 |
| Loss per 100 trades | -7.8R | -5.3R |
| Max drawdown | 80.0% | 42.4% |
| Ending balance from $10,000 | $2,403 | $6,796 |
Look at what did not move. The win rate went down by a point, from 38 to 37.
Now look at what did. The worst fall dropped from 80 percent to 42.4 percent, and the loss per trade fell by 32 percent.
That gap is the most useful finding in this test. The filters did not make trades win more often, they made the losing runs shorter and shallower. Volatility filters generally behave this way, which is worth remembering whenever one is sold to you as a way to win more.
Losing less is still losing, though. A 42.4 percent drawdown is well above the 30 percent line, so the filtered version is not tradable as written either.
Did The Result Hold In Every Time Period?
The eight years were split into four periods and both versions scored in each. This is called walk forward testing, and it checks whether a result is steady or driven by one stretch.
| Period | Textbook per 100 | Filtered per 100 | Filtered drawdown | Filtered trades |
|---|---|---|---|---|
| Jul 2018 to Aug 2020 | -12.5R | -9.2R | 18.2% | 145 |
| Aug 2020 to Aug 2022 | -9.3R | -6.1R | 17.4% | 126 |
| Sep 2022 to Sep 2024 | -10.1R | -4.9R | 29.5% | 196 |
| Sep 2024 to Oct 2026 | +0.5R | -1.8R | 24.1% | 163 |
The filtered version lost money in all four periods. There is no stretch where this setup worked.
The last row is the one to read twice. Between September 2024 and October 2026 the textbook version turned slightly positive while the filtered version stayed negative, which is the only period where the filters made things worse.
Two further limits apply. The filters were chosen using this same history, so these periods are a consistency check rather than an independent test.
What About The Pairs?
In the filtered version, GBPJPY produced the best result at plus 0.28R per trade across 75 trades, followed by CHFJPY at plus 0.15R across 67 trades.
Those are small samples inside a losing system. Seventy five trades is enough to notice and nowhere near enough to rely on.
The textbook data tells a slightly different story, with GBPUSD, EURJPY and GBPJPY all positive across both halves of the period. Only GBPJPY appears on both lists, which is the single weak signal in the whole test.
What Did A Winning Trade Look Like?
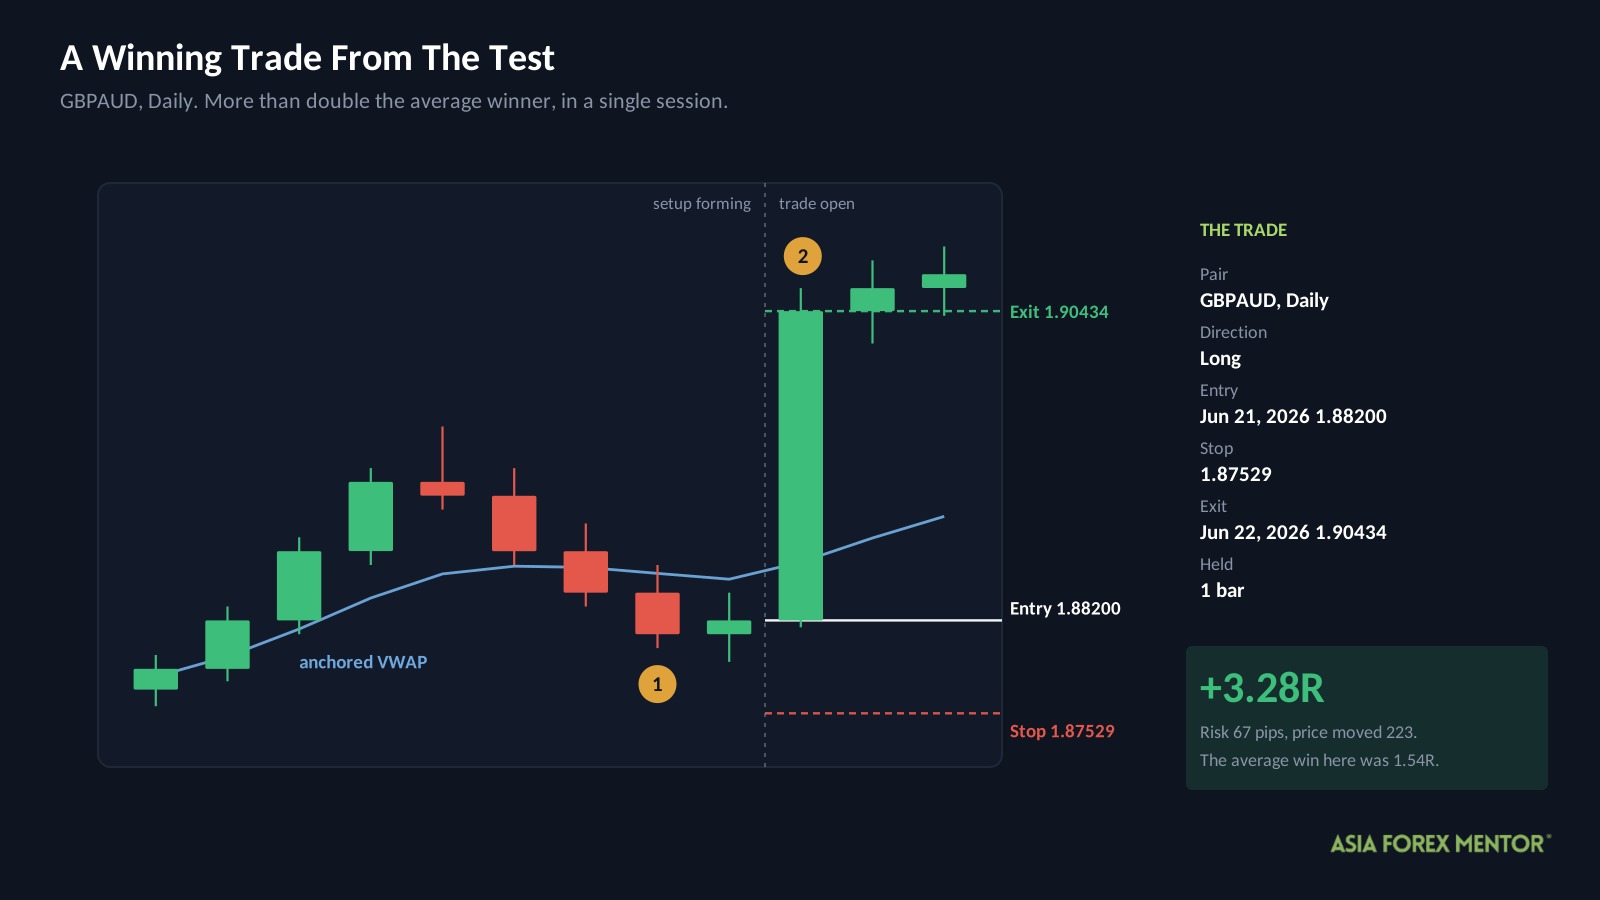
This is a real trade from the filtered sample, and it is far above average.
| Detail | Value |
|---|---|
| Pair and chart | GBPAUD, Daily |
| Direction | Long |
| Entry | June 21, 2026 at 1.88200 |
| Stop | 1.87529 |
| Exit | June 22, 2026 at 1.90434 |
| Result | +3.28R in 1 bar |
Price had pulled back to the anchored VWAP line, the daily candle closed above it, and ATR sat in the bottom 40 percent of its past year. Both filters were satisfied.
The risk was 67 pips and price travelled 223 pips in a single session. Set that against the filtered version’s average win of 1.54R, and this trade paid more than double the usual winner.
Remember what surrounds it. Roughly six in ten filtered trades lost, which is why the account still finished at $6,796.
What Should You Take From This?
Not a trading plan. Two things worth keeping, though, and both outlive this setup.
- Check what a tool is actually measuring before you trust it. A forex VWAP weights by tick count, not contracts, which is not what the name implies.
- Work out the break-even win rate of anything before you trade it. Divide the average loss by the sum of the average win and average loss.
- Run that number against the win rate being advertised. Anchored VWAP needed 41 percent and delivered 38.
- Treat volatility filters as drawdown control, not accuracy. Here they halved the worst fall and moved the win rate by one point.
That last point is the one most traders get backwards. A filter that calms your equity curve is valuable, but it will not turn a losing edge into a winning one.
If you want a reference line that is measured directly rather than inferred, a moving average does the same job on forex without the volume problem. And read about risk management before testing anything with real money.
Also Read: Simple Moving Average Trading Strategy
Is Anchored VWAP Worth Your Time?
Not as it is taught, and 1,667 trades is a large enough sample to say so plainly.
- The textbook rules lost money across 1,667 trades, ending at $2,403 with an 80 percent drawdown.
- Two filters cut the loss per trade by 32 percent and the worst fall to 42.4 percent, yet still finished at $6,796.
- All four periods lost money for the filtered version, and in the most recent one the filters made things worse.
The concept is not the problem. Price does return to levels that saw heavy trading, and that idea underpins a lot of serious work.
What fails here is the mechanical version of it on forex: a 10 bar anchor, a 1.5 ATR stop and a 2R target, on a line built from tick counts. The tool was designed for a market that reports its volume, and forex does not.
If you are already trading this, the number to check is your own. Work out your average win and average loss, find your break-even win rate, and see which side of it you are on.
Frequently Asked Questions
Does Anchored VWAP Work On Forex?
Not in this test. The AFM Research Lab ran it across 1,667 trades and 8.2 years of Daily data, and $10,000 finished at $2,403. A filtered version lost less but still ended at $6,796.
What Is An Anchored VWAP?
An anchored VWAP pins its average price line to one moment you choose, usually a major swing high or low. A normal VWAP resets each session instead. Traders use it as a fair value reference and trade pullbacks to the line.
Why Is VWAP Different On Forex Than On Stocks?
Stocks trade on exchanges that report every share traded, so a stock VWAP uses real volume. Forex has no central exchange, so charts show tick volume, which counts price changes instead. Every forex VWAP inherits that difference.
What Win Rate Does Anchored VWAP Need?
About 41 percent, given an average win of 1.38R against an average loss of 0.97R. The textbook version won 38 percent, which is why it lost steadily rather than occasionally.
Do Volatility Filters Make Anchored VWAP Profitable?
Not on this data. Requiring a calm market and a confirming candle close cut the worst fall from 80 percent to 42.4 percent, but moved the win rate by only one point and left the account down.
Which Pairs Work Best With Anchored VWAP?
GBPJPY showed the best filtered result at plus 0.28R across 75 trades, with CHFJPY next at plus 0.15R. Both samples are small and sit inside a losing system, so neither is a recommendation.