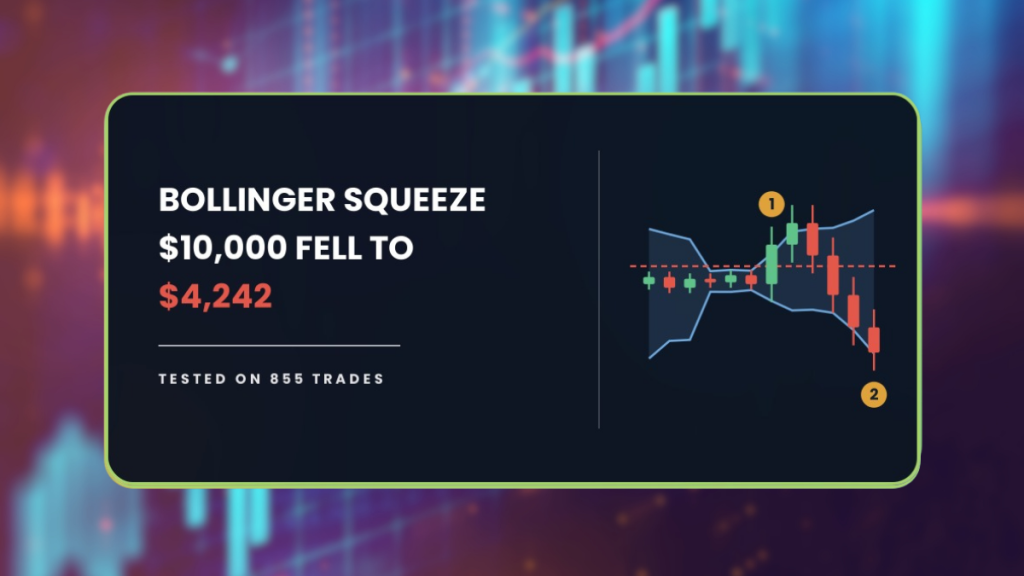
The Bollinger Squeeze has no rule about which way the market is going. It takes the break either way, and across 855 trades that took $10,000 down to $4,242. Adding a direction filter fixed the drawdown and created a different problem.
| About This Guide |
|---|
| This guide explains what the Bollinger Squeeze is, the exact rules we put through the AFM Research Lab across 28 forex pairs and eight years of Daily data, and what happened to an account trading them. You will finish knowing why the textbook version lost money, what three filters changed, and why their improvement cannot be trusted. |
| Quick Answer |
|---|
| The Bollinger Squeeze waits for the Bollinger Bands to pinch together, then enters when price breaks out of that tight range. In the AFM Research Lab the textbook version lost money across 855 trades on 28 forex pairs, ending at $4,242 from $10,000. A filtered version lost far less across only 142 trades. |
What Happened When We Tested The Bollinger Squeeze
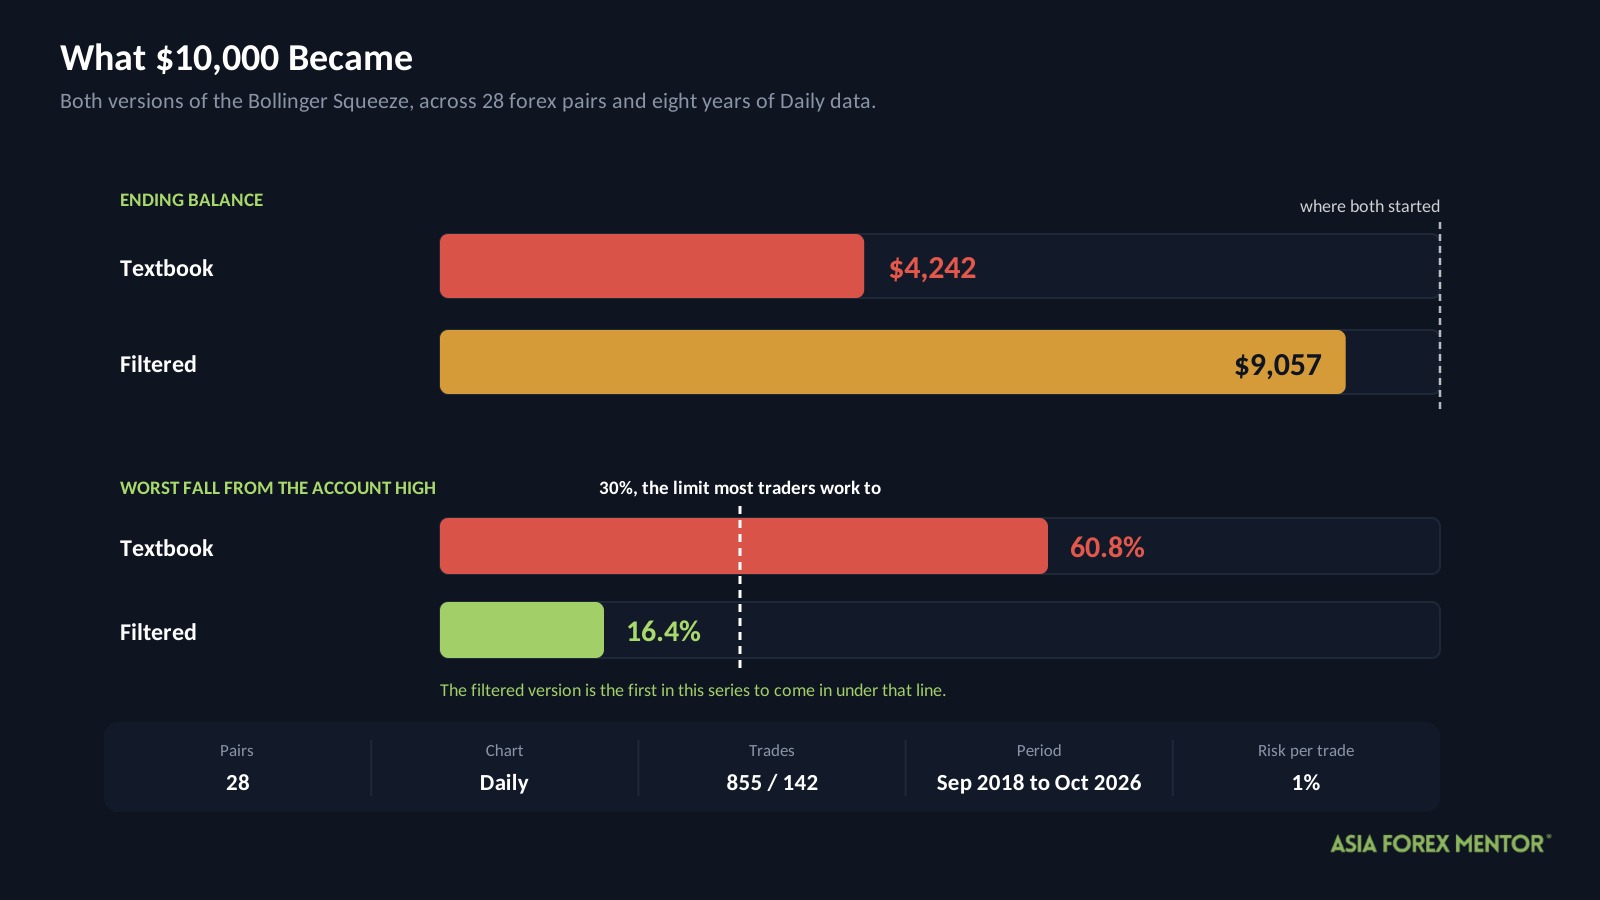
Two accounts, both starting at $10,000. One traded the rules as they are commonly taught. The other added three conditions from the AFM Research Lab.
Both lost money, but they lost it very differently.
| Version | Start | End | Max drawdown | Trades |
|---|---|---|---|---|
| Textbook | $10,000 | $4,242 | 60.8% | 855 |
| Filtered | $10,000 | $9,057 | 16.4% | 142 |
Drawdown is how far an account falls from its highest point. In other words, it is not your overall loss, it is the size of the worst slide from a peak to the low that followed.
Most traders treat 30 percent as the limit of what is survivable. The textbook version is nowhere near it, so it is not tradable as written.
The filtered version is the first in this series to come in under that line. Whether you can believe that figure is the question the rest of this article answers.
The test ran from September 27, 2018 to October 15, 2026, across 28 currency pairs on the Daily chart. Each trade risked 1 percent of the account, and the test charged 0.05 percent of the entry price per round trip in costs.
These are backtest results. Backtesting is not live trading, and past results do not guarantee future performance.
Key Takeaways
- The textbook rules lost money across 855 trades, ending at $4,242 from a $10,000 start.
- The worst fall was 60.8 percent, double what most traders treat as survivable.
- The setup needed a 39 percent win rate to break even, and it managed 35.
- Three filters cut the worst fall to 16.4 percent, the first filtered version in this series to clear the 30 percent bar.
- Those filters left only 142 trades, with period results swinging from minus 38R to plus 30R per hundred.
What Is The Bollinger Squeeze?
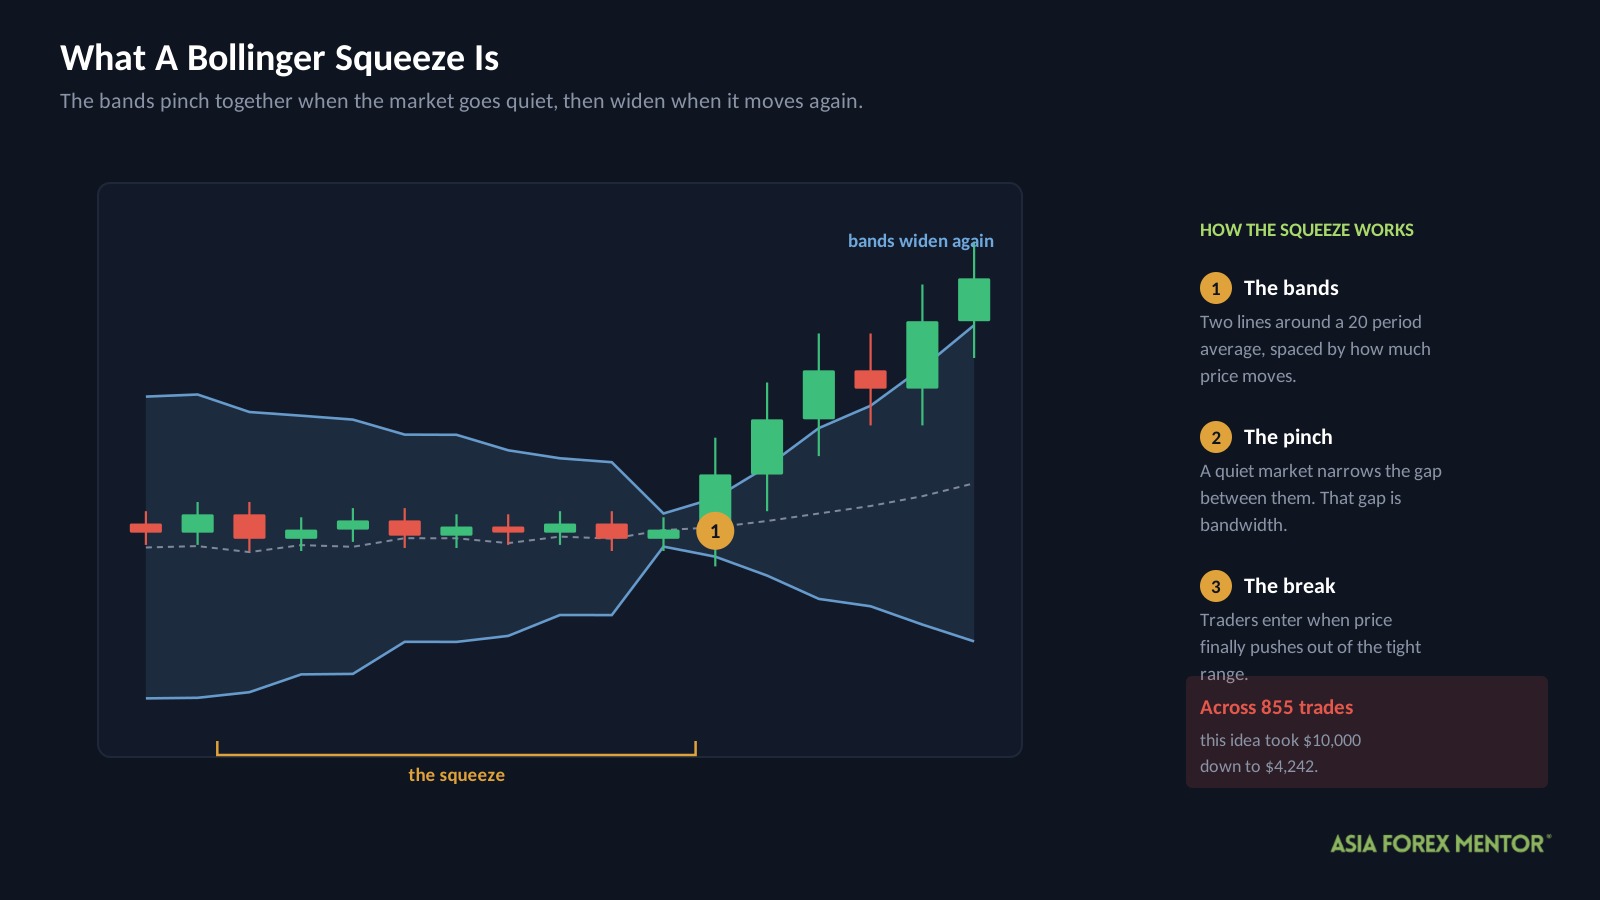
Bollinger Bands sit above and below a 20 period moving average, and the market’s own movement sets how far out they sit. When the market goes quiet, the lines pinch together.
That pinch is the squeeze. Traders call the distance between the two lines bandwidth, and a squeeze is simply bandwidth reaching the low end of its recent range.
The logic is that quiet markets do not stay quiet. So traders watch for the pinch, then enter when price finally pushes out of it, hoping to be positioned before the move runs.
How Do Most Traders Trade The Bollinger Squeeze?
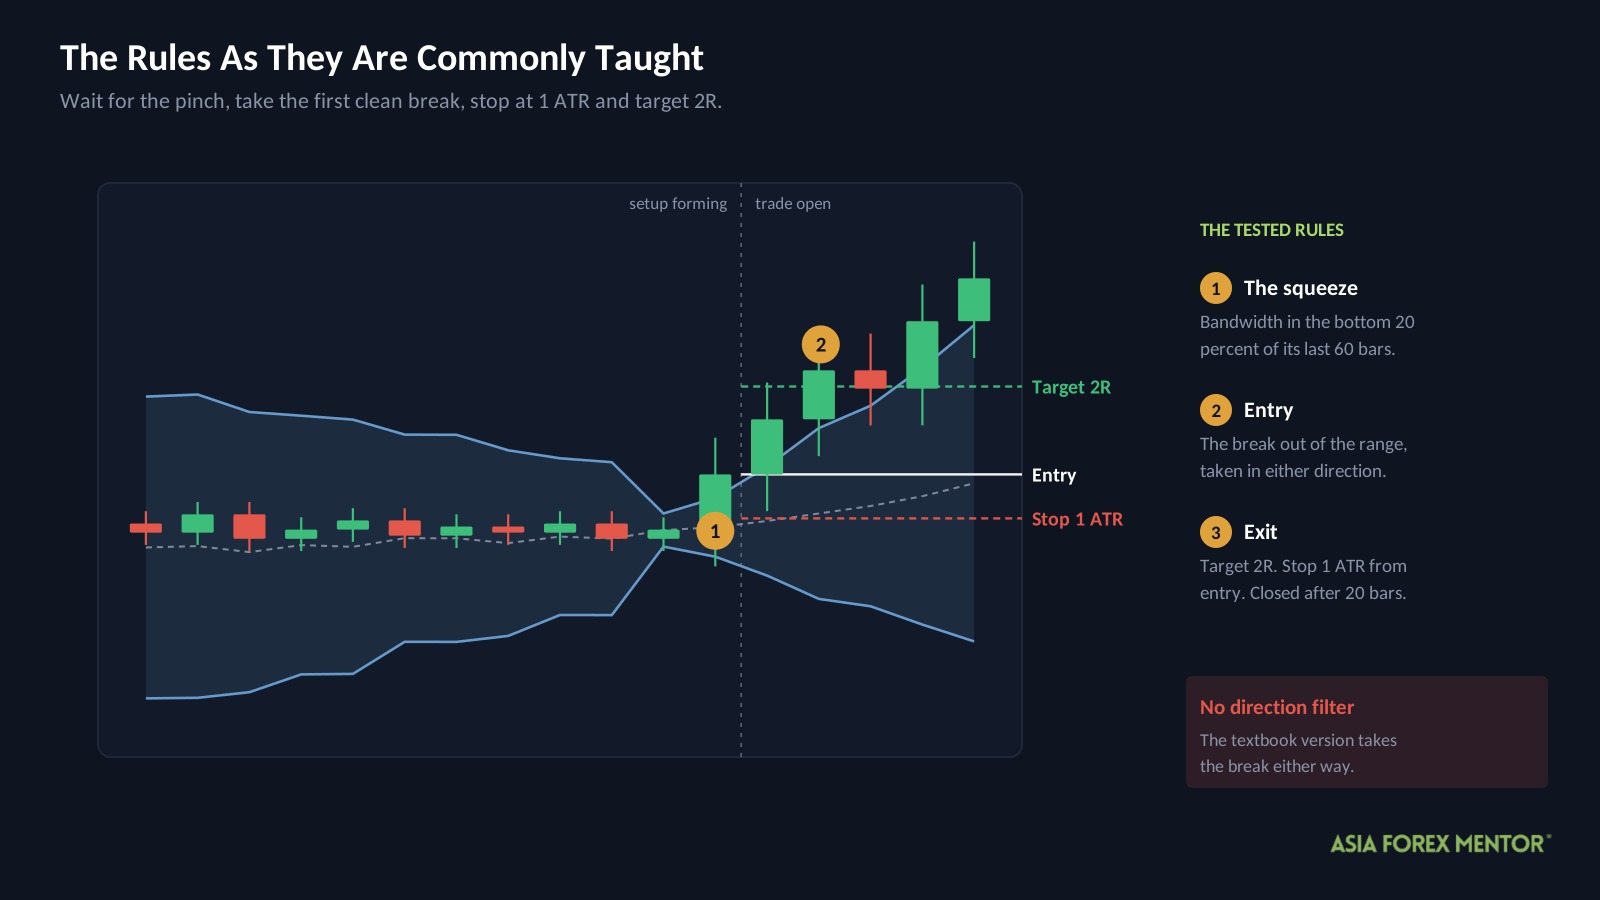
They wait for the bands to pinch, then take the first clean break in either direction.
Three terms you need first.
R is what you risk on one trade, measured from entry to stop. On a $10,000 account risking 1 percent, 1R is $100, so a 2R target aims for $200.
ATR means Average True Range, which is how far a pair usually moves in a day. A stop set in ATR sizes itself to each pair rather than using the same pip distance everywhere.
Bandwidth percentile is a ranking. A threshold of 0.2 says the bands must be tighter than 80 percent of their readings over the last 60 bars.
Here are the rules exactly as we tested them.
| Rule | Setting |
|---|---|
| Chart | Daily |
| Bands | 20 period Bollinger Bands |
| Squeeze trigger | Bandwidth in the bottom 20 percent of its last 60 bars |
| Entry | The break out of the squeeze, either direction |
| Stop loss | 1 ATR from entry |
| Target | 2R |
| Time exit | Close after 20 bars |
| Direction filter | None |
Note the last row. The textbook version takes the break either way, with nothing checking whether the wider market agrees.
Why Did The Textbook Version Lose?
| Metric | Textbook |
|---|---|
| Trades | 855 |
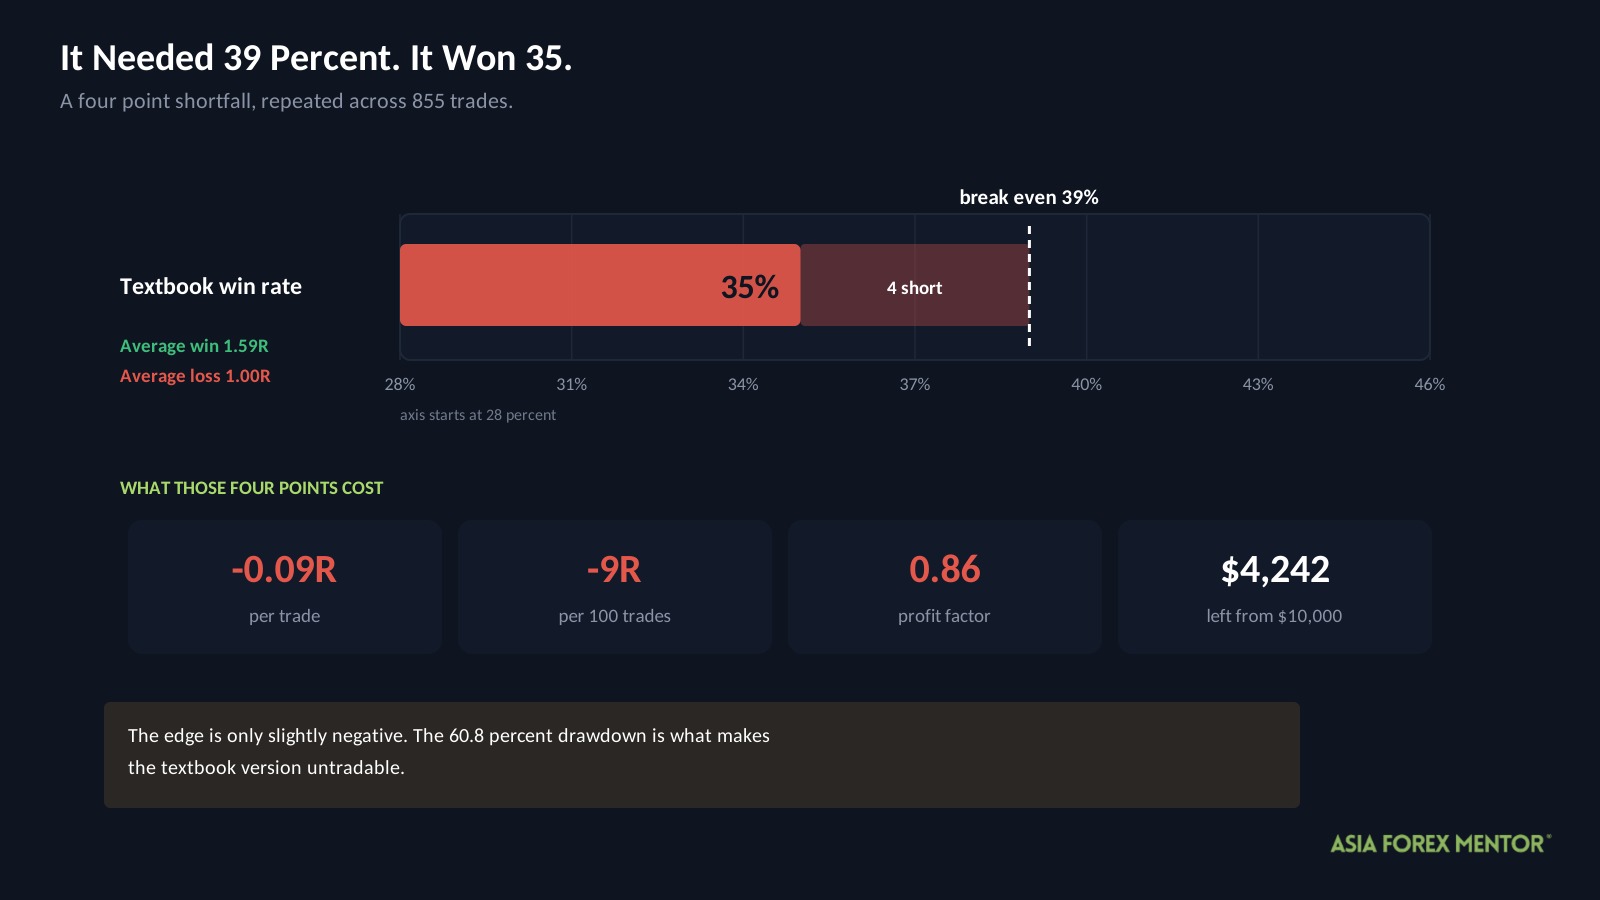
| Win rate | 35% |
| Average win | +1.59R |
| Average loss | -1.00R |
| Expectancy | -0.09R |
| Profit factor | 0.86 |
| Yearly growth rate | -10.1% |
| Max drawdown | 60.8% |
| Ending balance from $10,000 | $4,242 |
Three of those need defining.
Expectancy is what the average trade earns or loses, in R. At minus 0.09R, every trade cost about a eleventh of what it risked, and 855 of those is how an account reaches $4,242.
Profit factor is total winnings divided by total losses. Below 1 means the strategy lost money, so 0.86 says it paid out $1 for every 86 cents it took in.
Yearly growth rate, often written as CAGR, is the average rate the account changed each year. At minus 10.1 percent a year, compounding over eight years, $10,000 becomes $4,242.
Now the arithmetic. The average win was 1.59R and the average loss 1.00R, so this setup needed to win about 39 percent of the time just to break even.
It won 35 percent.
Four points does not sound like much. However, the real damage here is the 60.8 percent drawdown, which is more than double what most traders treat as survivable.
That is the textbook version’s actual problem. The edge is slightly negative, and the path is brutal.
What Did We Change?
The entry, stop and target were left alone. The AFM Research Lab added three conditions that decide whether a squeeze gets traded at all.
| Filter | Condition | The idea behind it |
|---|---|---|
| Volatility | 14 day ATR in the bottom 40 percent of its past year | A squeeze inside a fast market is usually just a pause |
| Trend strength | ADX(14) at 25 or above | Breaks in directionless markets reverse quickly |
| Direction | Price above the 200 day EMA for longs, below it for shorts | Stop taking breaks that fight the larger trend |
ADX means Average Directional Index, a reading from 0 to 100 that measures how strong a move is without saying which way it points. Above 25 generally means a trend is in place.
An EMA is an exponential moving average, a line that smooths price and weights recent days most heavily.
The third rule is the interesting one, because it is the only one that addresses the missing direction filter in the textbook rules.
Did The Filters Work?
Every figure improved, and the sample behind them is too small to rely on.
| Metric | Textbook | Filtered |
|---|---|---|
| Trades | 855 | 142 |
| Win rate | 35% | 36% |
| Expectancy | -0.09R | -0.06R |
| Profit factor | 0.86 | 0.91 |
| Max drawdown | 60.8% | 16.4% |
| Ending balance from $10,000 | $4,242 | $9,057 |
The loss per trade fell by a third, and the worst fall dropped from 60.8 percent to 16.4 percent. That clears the 30 percent bar for the first time in this series.
However, the filters left 142 trades across eight years. That works out to about 18 trades a year across all 28 pairs combined.
These settings were also chosen by searching the test history, which has a name, in sample optimization. So treat the figures above as the optimistic case rather than a proven one.
Did It Hold In Every Period?
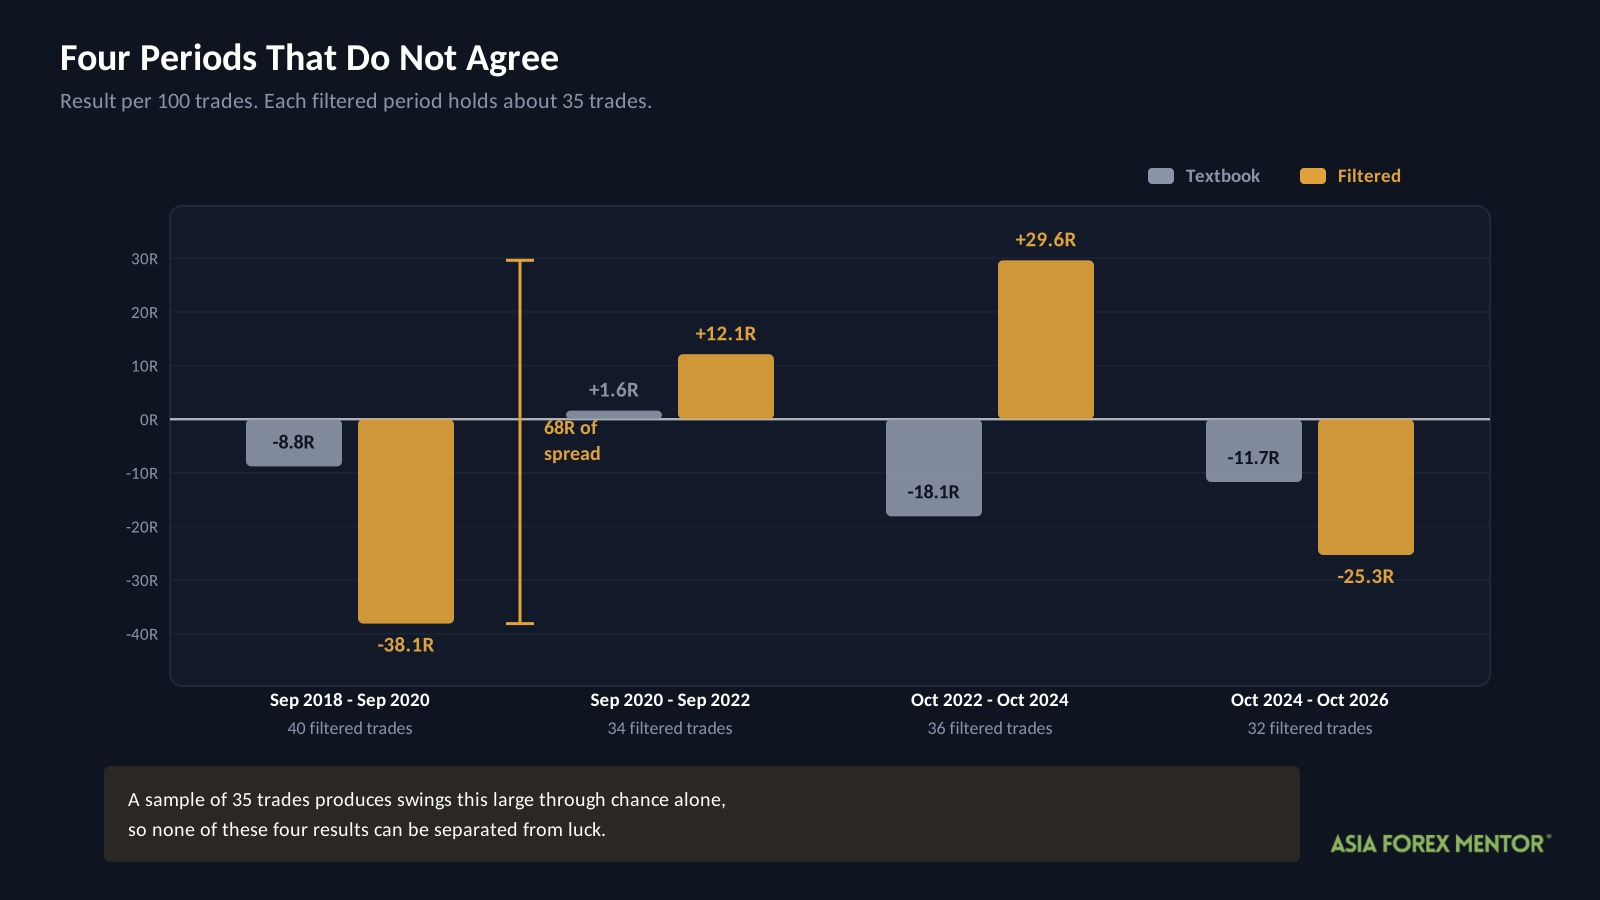
The eight years were split into four periods and both versions scored in each. This is called walk forward testing, and it checks whether a result is steady or driven by one stretch.
| Period | Textbook per 100 | Filtered per 100 | Filtered win rate | Trades |
|---|---|---|---|---|
| Sep 2018 to Sep 2020 | -8.8R | -38.1R | 22% | 40 |
| Sep 2020 to Sep 2022 | +1.6R | +12.1R | 41% | 34 |
| Oct 2022 to Oct 2024 | -18.1R | +29.6R | 53% | 36 |
| Oct 2024 to Oct 2026 | -11.7R | -25.3R | 28% | 32 |
The filtered version beat the textbook in two periods and lost badly to it in the other two. Its win rate moved between 22 and 53 percent, and its result swung from minus 38R to plus 30R per hundred.
Each of those periods holds about 35 trades. A sample that size produces swings of exactly this size through chance alone, so none of these four results can be separated from luck.
That is the honest reading of the filtered version. It may be a genuine improvement, and 142 trades cannot show it either way.
What About The Pairs?
USDHKD, AUDJPY and USDCAD produced the highest expectancy in the filtered version.
USDHKD needs its usual warning. It is a pegged pair, held inside a narrow band by policy, so it behaves nothing like the pairs most people trade.
More importantly, no pair held up across both halves of the data. With 142 trades spread over 28 pairs, most pairs contributed fewer than six trades each, which is not enough to rank anything.
What Did A Winning Trade Look Like?
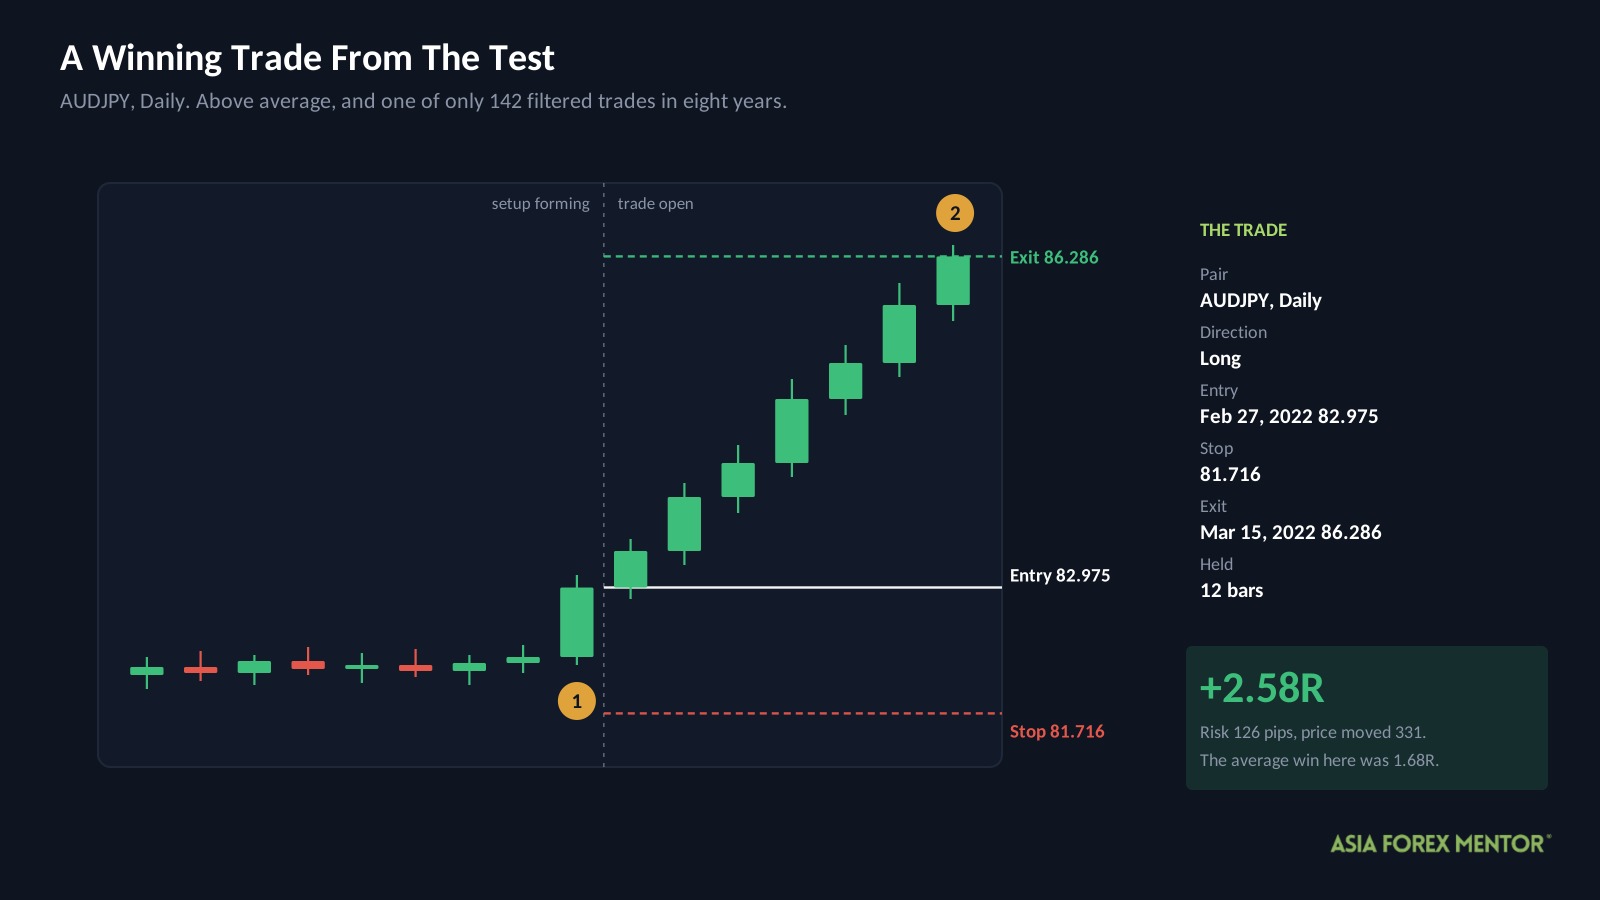
This is a real trade from the filtered sample, and it is above average.
| Detail | Value |
|---|---|
| Pair and chart | AUDJPY, Daily |
| Direction | Long |
| Entry | February 27, 2022 at 82.975 |
| Stop | 81.716 |
| Exit | March 15, 2022 at 86.286 |
| Result | +2.58R in 12 bars |
The bands had pinched, ATR sat in the bottom 40 percent of its past year, ADX was above 25, and price was above the 200 day EMA. All three filters passed.
The risk was 126 pips and price travelled 331 pips over twelve days. Set that against the filtered version’s average win of 1.68R, and this trade paid about half as much again as the usual winner.
Most trades did not get there. At a 36 percent win rate, roughly two trades in three closed at the stop.
What Should You Take From This?
Not a trading plan. Two things worth keeping, and the second applies well beyond this setup.
- Work out the break-even win rate before you trade anything. Divide the average loss by the sum of the average win and the average loss.
- Count the trades behind any improvement before you believe it. An impressive result across 142 trades tells you less than an unimpressive one across 855.
The second point is what this test exists to demonstrate. The filtered version improved on every single metric, and its four periods disagree so widely that you cannot trust any of them.
When a backtest reports an unusually good drawdown figure, the sample size is the first thing to check rather than the method.
Before testing any of this with real money, read about risk management and size accordingly.
Is The Bollinger Squeeze Worth Your Time?
Not as it is taught, and 855 trades is enough to say that part plainly.
- The textbook rules lost money across 855 trades, ending at $4,242 with a 60.8 percent drawdown.
- Three filters improved every metric and cut the worst fall to 16.4 percent, clearing the 30 percent bar for the first time in this series.
- Those filters left 142 trades, with period results swinging from minus 38R to plus 30R per hundred.
The idea behind the squeeze is not wrong. Quiet markets genuinely do give way to active ones, and that observation is the basis of a lot of volatility work.
What fails is the textbook packaging: a bandwidth threshold, a 1 ATR stop, and a break taken in either direction with nothing checking the wider trend. Adding that missing direction filter is where most of the improvement came from.
If you want to trade the squeeze anyway, those three filters are the minimum. However, you would be applying rules this test cannot confirm to a setup it can confirm does not work.
Also Read: Bollinger Bands Forex Trading Strategy
Frequently Asked Questions
Does The Bollinger Squeeze Work In Forex?
Not as it is commonly taught. The AFM Research Lab ran it across 855 trades and eight years of Daily data, and $10,000 finished at $4,242 with a 60.8 percent drawdown.
What Is A Bollinger Squeeze?
It is the point where Bollinger Bands pinch together because the market has gone quiet. Traders watch for that pinch and enter when price finally breaks out of the tight range.
What Win Rate Does The Bollinger Squeeze Need?
About 39 percent, given an average win of 1.59R against an average loss of 1.00R. The textbook version won 35 percent, which is why it lost money steadily.
Do Filters Make The Bollinger Squeeze Profitable?
Not on this data. Three filters improved every metric and cut the worst fall to 16.4 percent, but they left only 142 trades, with period results ranging from minus 38R to plus 30R per hundred.
How Often Does The Filtered Bollinger Squeeze Trade?
About 18 times a year across all 28 pairs, which is roughly one trade per pair every 18 months. The filters removed 83 percent of the signals the textbook version took.
What Is The Difference Between A Squeeze And A Band Breakout?
A standard breakout enters whenever price crosses either band. The squeeze waits for bandwidth to reach the low end of its range first, which cuts the number of signals and targets moves that follow a quiet stretch.