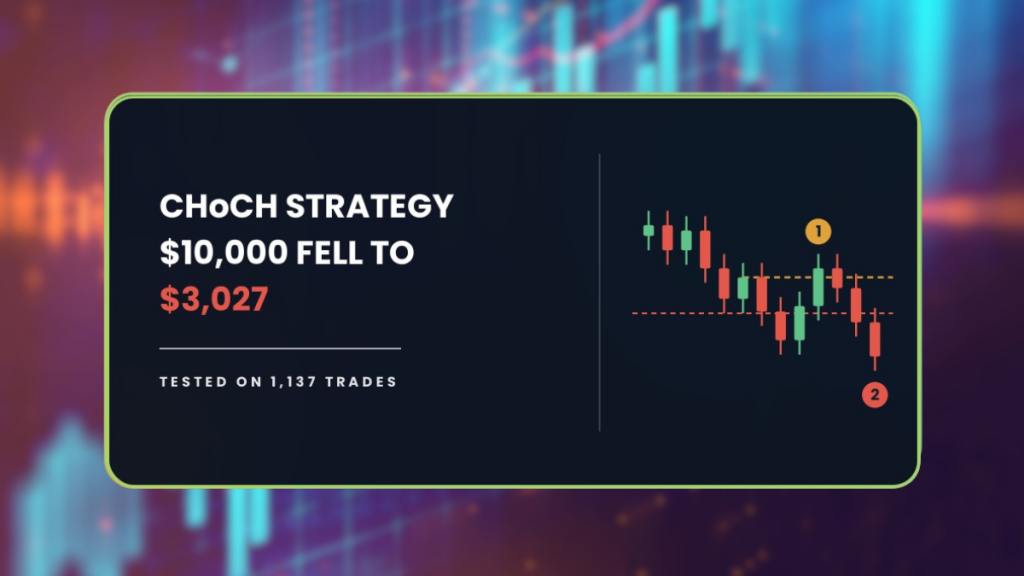
The CHoCH strategy took $10,000 down to $3,027 across 1,137 trades. Two filters then cut the worst fall by nearly two thirds, and one of them is backwards.
| About This Guide |
|---|
| This guide explains what the CHoCH strategy is, the exact rules we put through the AFM Research Lab across 28 forex pairs and eight years of Daily data, and what happened to an account trading them. You will finish knowing why the textbook version lost money, what two filters changed, and why the best drawdown figure in this series still cannot be trusted. |
| Quick Answer |
|---|
| CHoCH, short for Change of Character, enters when price breaks the most recent swing point against the trend. In the AFM Research Lab the textbook version lost money across 1,137 trades on 28 forex pairs, ending at $3,027 from $10,000. A filtered version lost far less, but it left only 224 trades. |
What Happened When We Tested The CHoCH Strategy
Two accounts, both starting at $10,000. One traded the rules as they are commonly taught. The other added two conditions from the AFM Research Lab.
Both lost money, but they lost it very differently.
| Version | Start | End | Max drawdown | Trades |
|---|---|---|---|---|
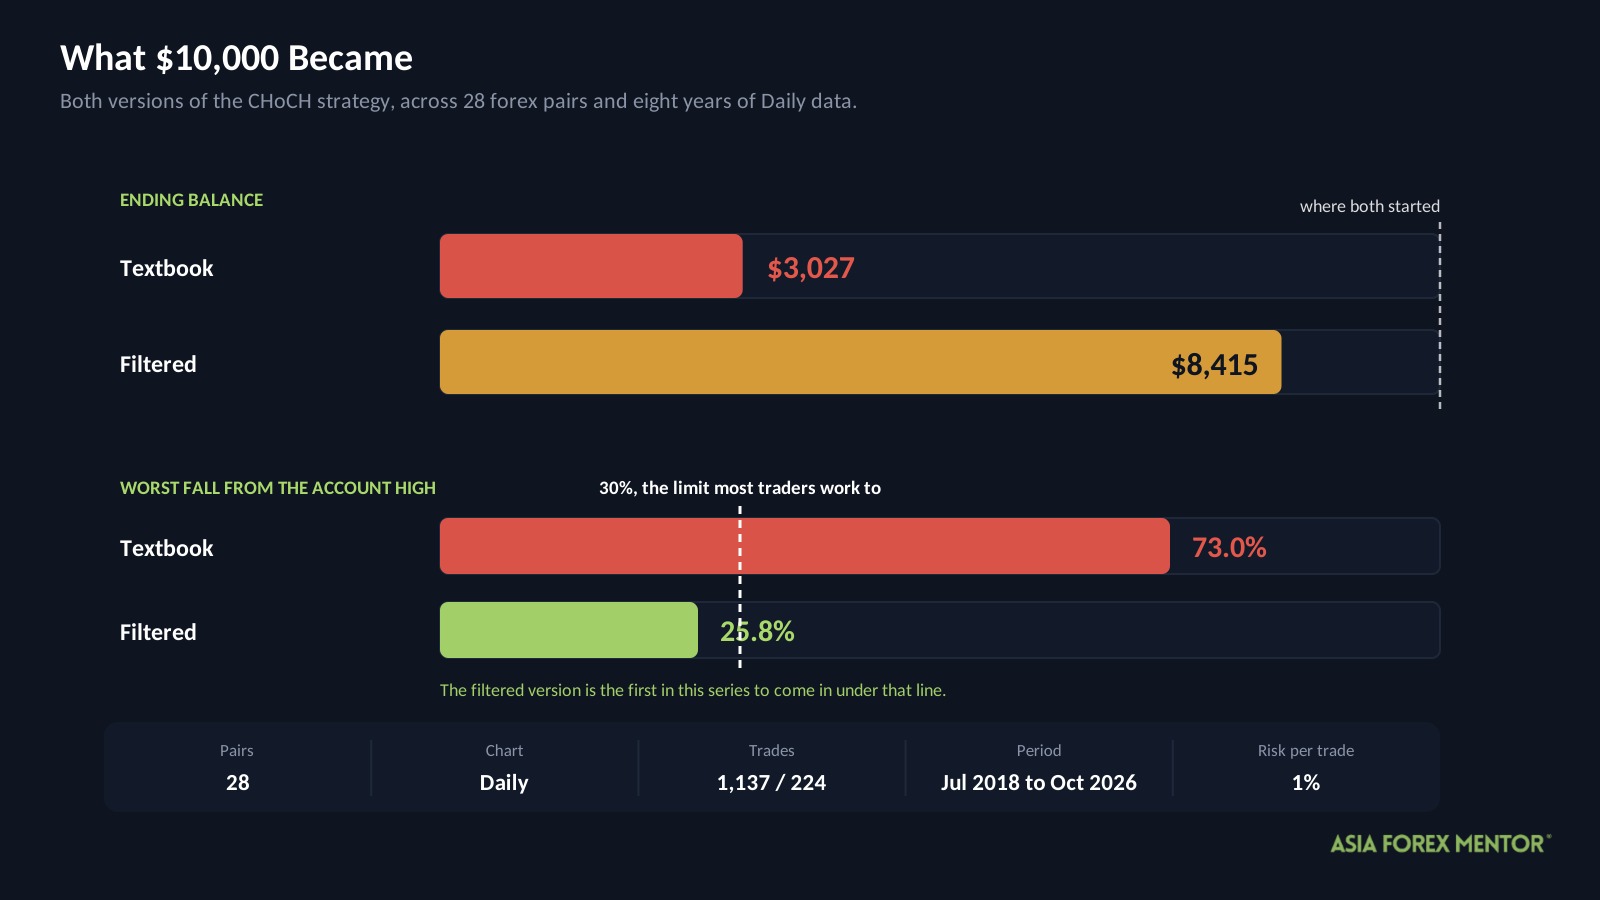
| Textbook | $10,000 | $3,027 | 73.0% | 1,137 |
| Filtered | $10,000 | $8,415 | 25.8% | 224 |
Drawdown is how far an account falls from its highest point. In other words, it is not your overall loss, it is the size of the worst slide from a peak to the low that followed.
At its worst the textbook account held about $2,700. The filtered account bottomed near $7,420 before recovering to $8,415.
Most traders treat 30 percent as the limit of what is survivable. The textbook version is nowhere near it. The filtered version is the first in this series to come in under that line, and whether you can believe that figure is the question the rest of this article answers.
The test ran from July 19, 2018 to October 15, 2026, across 28 currency pairs on the Daily chart. Each trade risked 1 percent of the account, and the test charged 0.05 percent of the entry price per round trip in costs.
These are backtest results. Backtesting is not live trading, and past results do not guarantee future performance.
Key Takeaways
- The textbook rules lost money across 1,137 trades, ending at $3,027 from a $10,000 start.
- The worst fall was 73.0 percent, more than double what most traders treat as survivable.
- The setup needed a 35 percent win rate to break even, and it managed 32.
- Two filters cut the worst fall to 25.8 percent, the first version in this series to clear the 30 percent bar.
- Those filters left only 224 trades, and the rules behind them were chosen on the same data that measured them.
What Is The CHoCH Strategy?
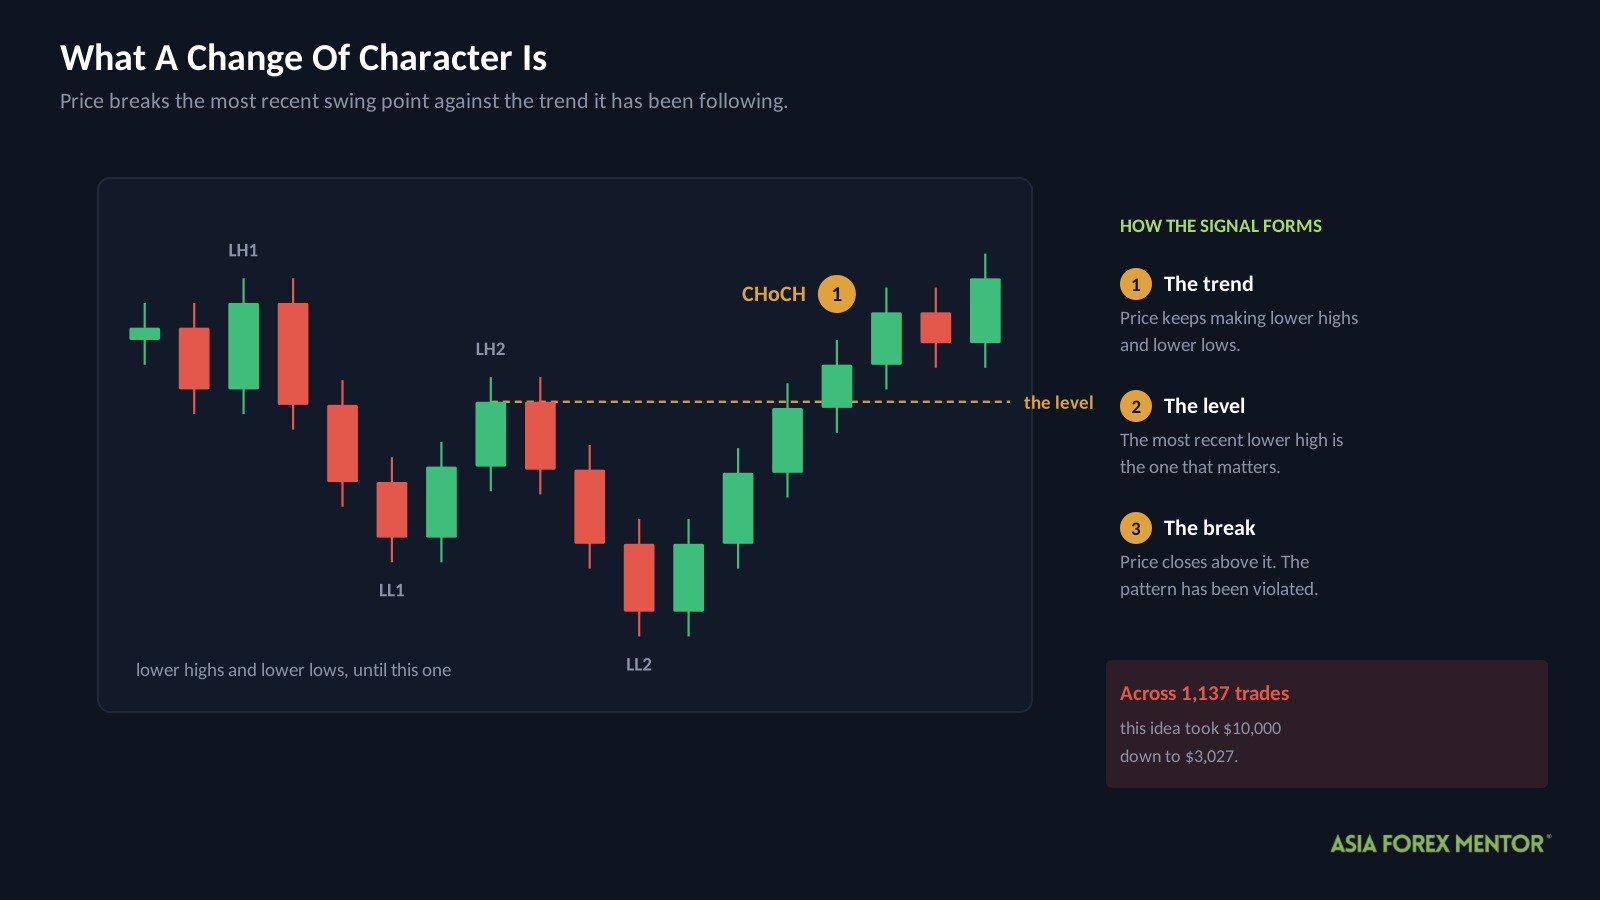
CHoCH stands for Change of Character. It marks the moment price breaks the most recent swing point in the opposite direction to the trend it has been following.
In a downtrend, price makes a series of lower highs and lower lows. A CHoCH happens when price pushes above the most recent lower high. In an uptrend it runs the other way, with price dropping below the most recent higher low.
The idea comes from Smart Money Concepts (https://www.asiaforexmentor.com/ict-order-block/), where traders read that break as a sign the structure may be turning. One side of the market has stopped making progress, and the other side has taken the last level that mattered.
The break is a clue rather than a confirmation. It tells you the pattern has been violated, and nothing more. Most traders enter right there, hoping to catch a reversal from the start.
How Do Most Traders Trade The CHoCH Strategy?
They wait for the swing point to break, then enter on that candle or on the pullback that follows.
Three terms you need first.
A swing point is a turning point on the chart. A swing high is a peak with lower bars on both sides, and a swing low is a trough with higher bars on both sides.
R is what you risk on one trade, measured from entry to stop. On a $10,000 account risking 1 percent, 1R is $100, so a 2R target aims for $200.
Average True Range, which is how far a pair usually moves in a day. A stop set in ATR sizes itself to each pair rather than using the same pip distance everywhere.
Here are the rules exactly as we tested them.
| Rule | Setting |
|---|---|
| Chart | Daily |
| Trend | At least two swing points in one direction |
| Trigger | Price closes beyond the most recent opposing swing point |
| Entry | The close of the break candle, or the pullback retest |
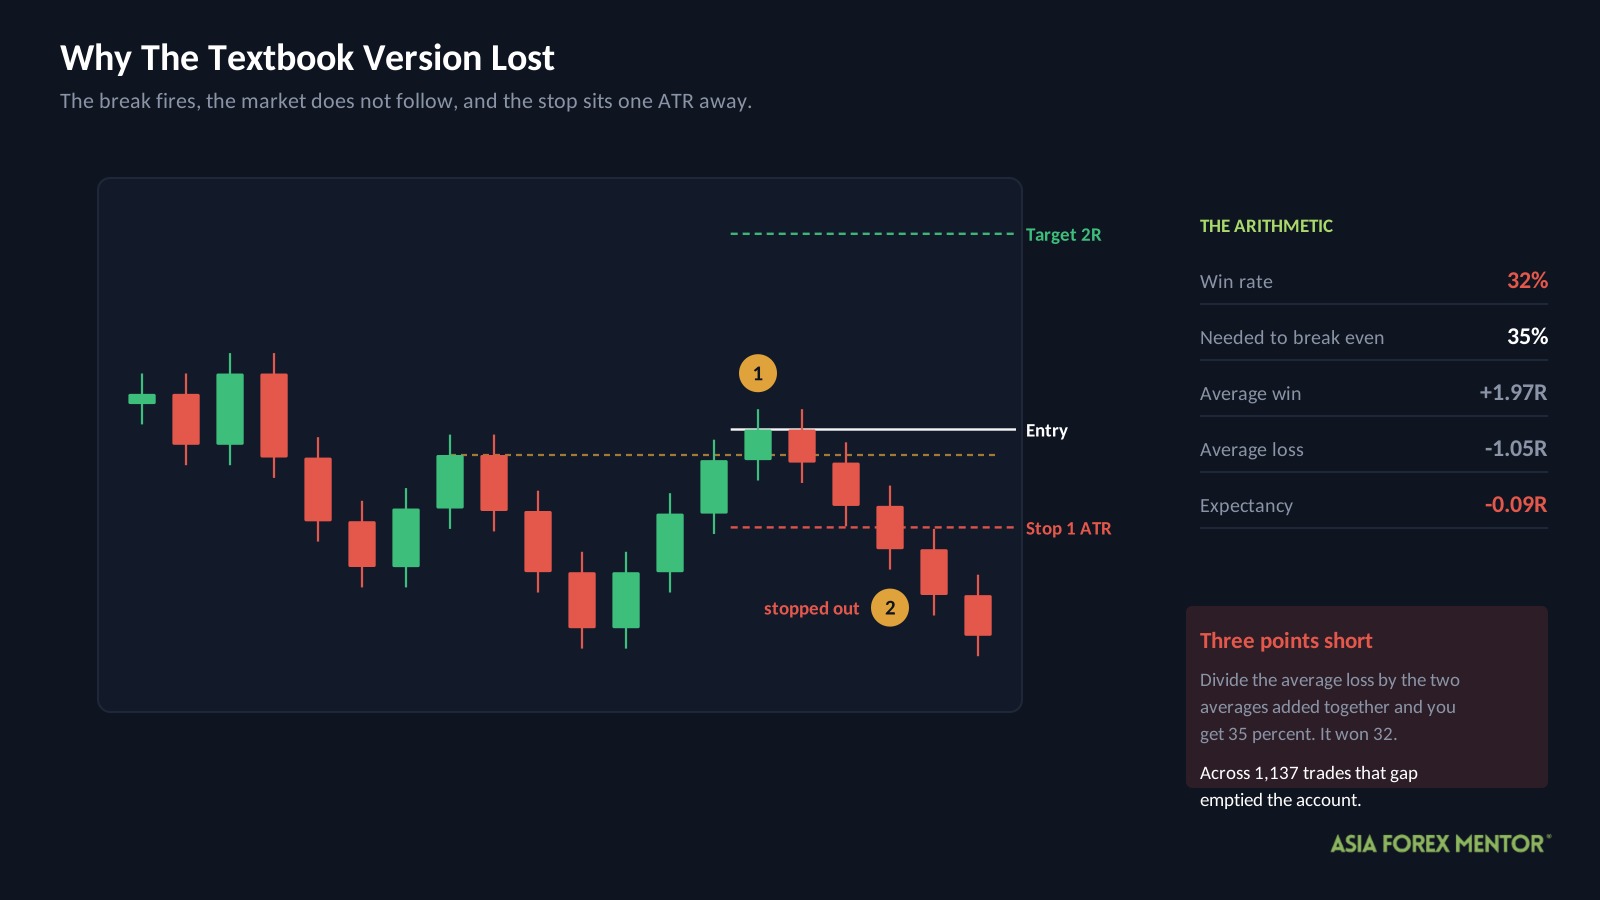
| Stop loss | 1 ATR from entry |
| Target | 2R |
| Volatility filter | None |
| Direction filter | None |
Note the last two rows. The textbook version takes every break, with nothing checking the conditions it happens in.
Why Did The Textbook Version Lose?
| Metric | Textbook |
|---|---|
| Trades | 1,137 |
| Win rate | 32% |
| Average win | +1.97R |
| Average loss | -1.05R |
| Expectancy | -0.09R |
| Profit factor | 0.87 |
| Yearly growth rate | -13.5% |
| Max drawdown | 73.0% |
| Ending balance from $10,000 | $3,027 |
Three of those need defining.
Expectancy is what the average trade earns or loses, in R. At minus 0.09R, every trade cost about a eleventh of what it risked, and 1,137 of those is how an account reaches $3,027.
Profit factor is total winnings divided by total losses. Below 1 means the strategy lost money, so 0.87 says it paid out $1 for every 87 cents it took in.
Yearly growth rate, often written as CAGR, is the average rate the account changed each year. At minus 13.5 percent a year, compounding over eight years, $10,000 becomes $3,027.
Now the arithmetic. The average win was 1.97R and the average loss 1.05R, so this setup needed to win about 35 percent of the time just to break even.
It won 32 percent.
Three points does not sound like much. However, the real damage here is the 73.0 percent drawdown, which is more than double what most traders treat as survivable.
That is the textbook version’s actual problem. The edge is slightly negative, and the path is brutal.
What Did We Change?
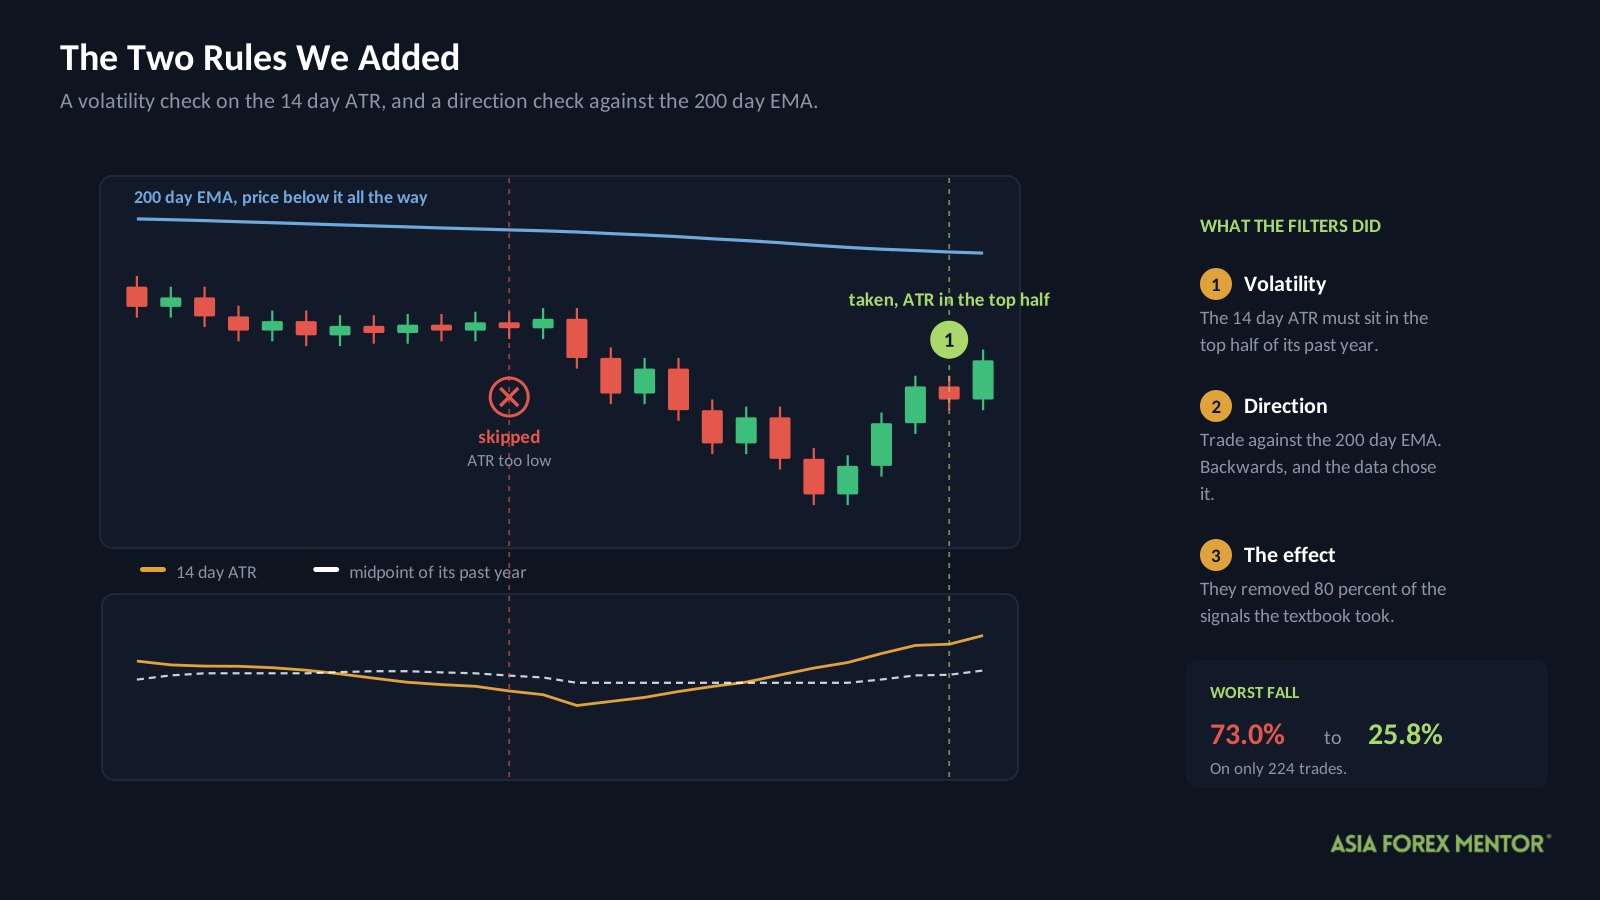
The entry, stop and target were left alone. The AFM Research Lab added two conditions that decide whether a CHoCH gets traded at all.
| Filter | Condition | The idea behind it |
|---|---|---|
| Volatility | 14 day ATR in the top half of its past year | A break in a quiet market rarely carries |
| Direction | Trade against the 200 day EMA, short above it and long below it | In this data, counter-trend breaks followed through more often |
An EMA is an exponential moving average, a line that smooths price and weights recent days most heavily.
Read that second rule again, because it is backwards from what almost every course teaches. It says take short signals while price sits above the 200 day line, and long signals while price sits below it.
We kept it because the data chose it. We do not recommend it, and the next two sections explain why.
Did The Filters Work?
Every figure improved, and the sample behind them is too small to rely on.
| Metric | Textbook | Filtered |
|---|---|---|
| Trades | 1,137 | 224 |
| Win rate | 32% | 33% |
| Result per 100 trades | -9.5R | -6.7R |
| Profit factor | 0.87 | 0.90 |
| Max drawdown | 73.0% | 25.8% |
| Ending balance from $10,000 | $3,027 | $8,415 |
The loss per trade fell by 29 percent, and the worst fall dropped 47.2 percentage points, from 73.0 to 25.8. That clears the 30 percent bar for the first time in this series.
A direct dollar comparison would mislead, because the textbook version took much bigger swings. Scaled to the same worst fall, the textbook account ends at $7,633 and the filtered account at $8,415. Equal pain, better outcome.
However, the filters left 224 trades across eight years. That works out to about 27 trades a year across all 28 pairs combined.
These settings were also chosen by searching the test history, which has a name, in sample optimization. So treat every figure above as the optimistic case rather than a proven one.
Did It Hold In Every Period?
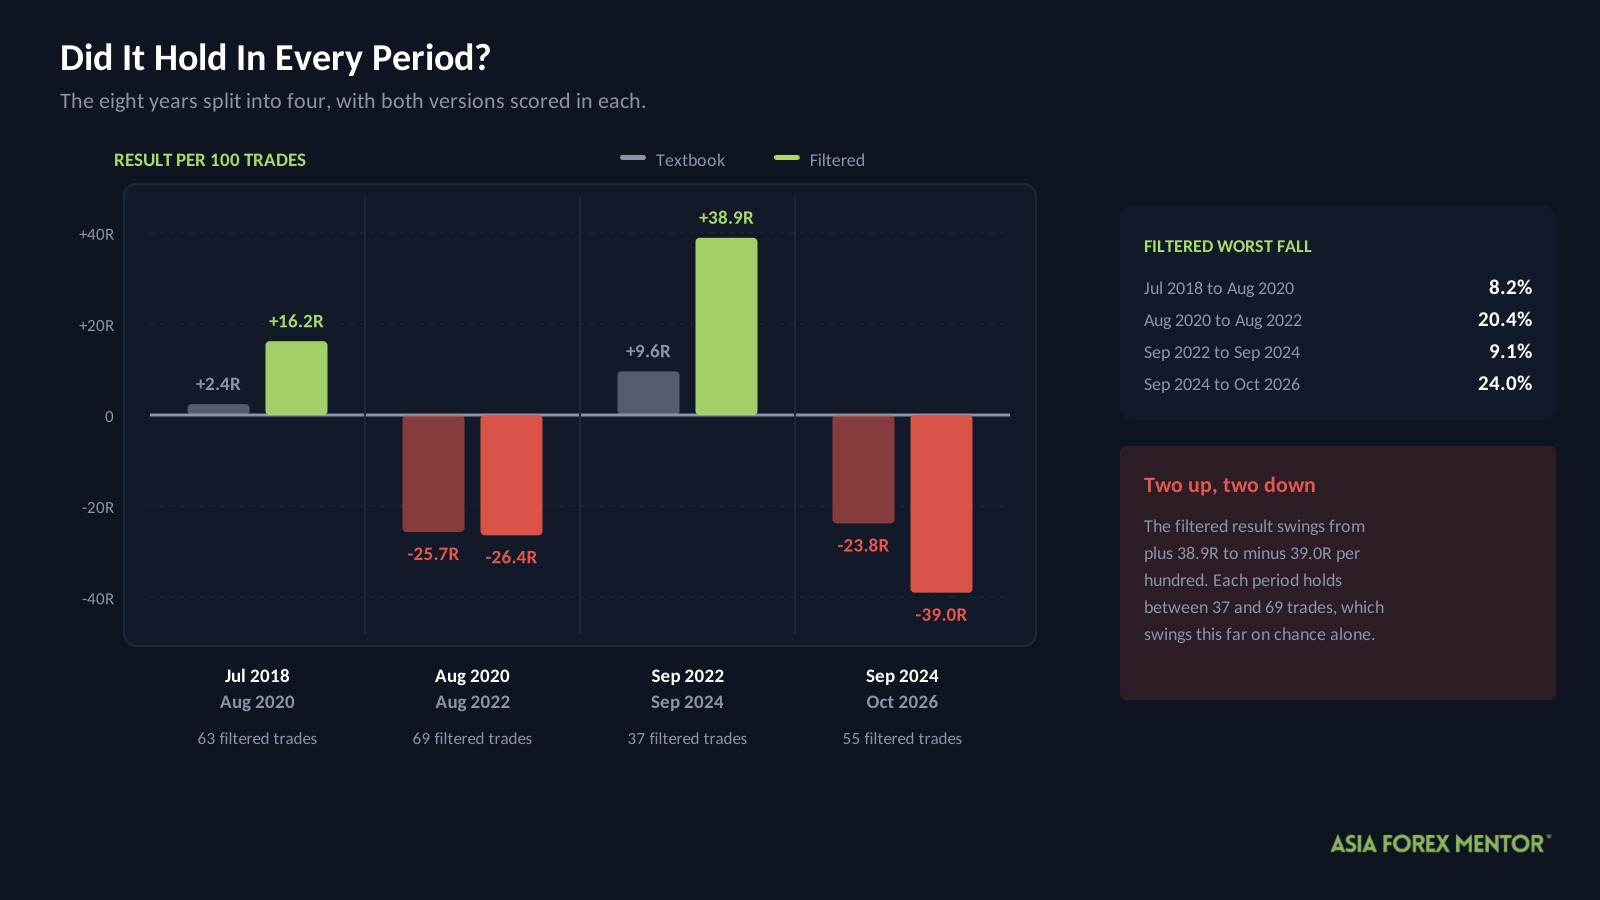
The eight years were split into four periods and both versions scored in each. This is called walk forward testing, and it checks whether a result is steady or driven by one stretch.
| Period | Textbook per 100 | Filtered per 100 | Filtered drawdown | Trades |
|---|---|---|---|---|
| Jul 2018 to Aug 2020 | +2.4R | +16.2R | 8.2% | 63 |
| Aug 2020 to Aug 2022 | -25.7R | -26.4R | 20.4% | 69 |
| Sep 2022 to Sep 2024 | +9.6R | +38.9R | 9.1% | 37 |
| Sep 2024 to Oct 2026 | -23.8R | -39.0R | 24.0% | 55 |
The filtered version beat the textbook in two periods and lost badly to it in the other two. Its result swung from plus 38.9R to minus 39.0R per hundred, which is as wide a spread as this series has produced.
One thing did hold. The filtered version carried the smaller fall in all four periods, and in the first one it gave up only 8.2 percent.
Each period holds between 37 and 69 trades. A sample that size produces swings of exactly this size through chance alone, so none of these four results can be separated from luck.
That also settles the backwards direction rule. A counter-trend filter beating a with-trend one across 224 trades is what noise looks like, not what an edge looks like.
What About The Pairs?
USDHKD, GBPJPY and EURJPY produced the highest expectancy in the filtered version, at 0.48R, 0.47R and 0.37R per trade.
USDHKD needs its usual warning. It is a pegged pair, held inside a narrow band by policy, so it behaves nothing like the pairs most people trade.
More importantly, no pair held up across both halves of the data. With 224 trades spread over 28 pairs, most pairs contributed fewer than eight trades each, which is not enough to rank anything.
At the other end, the worst trades in the sample all came from USDZAR. Each one stopped out within a bar of entry for minus 1.05R, or about $105 on a $10,000 account.
What Did A Winning Trade Look Like?
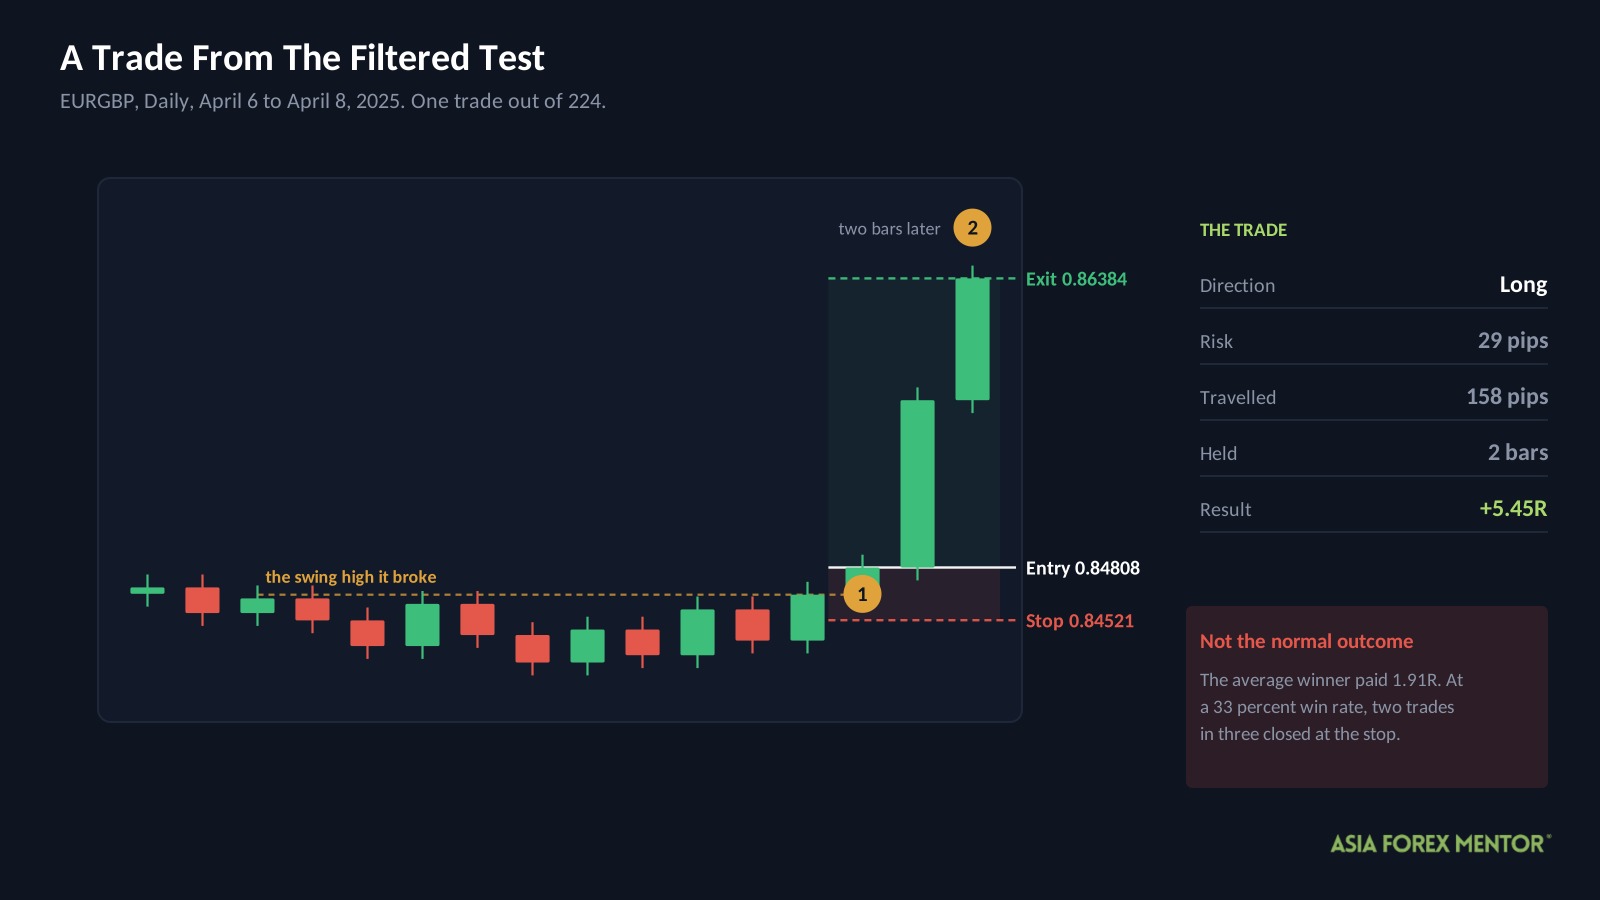
This is a real trade from the filtered sample, and it is well above average.
| Detail | Value |
|---|---|
| Pair and chart | EURGBP, Daily |
| Direction | Long |
| Entry | April 6, 2025 at 0.84808 |
| Stop | 0.84521 |
| Exit | April 8, 2025 at 0.86384 |
| Result | +5.45R in 2 bars |
Price had broken above the most recent swing high, ATR sat in the top half of its past year, and price was below the 200 day EMA. Both filters passed.
The risk was 29 pips and price travelled 158 pips in two days. Set that against the filtered version’s average win of 1.91R, and this trade paid almost three times what the usual winner did.
Most trades did not get there. At a 33 percent win rate, two trades in three closed at the stop.
What Should You Take From This?
Not a trading plan. Two things worth keeping, and the second applies well beyond this setup.
Work out the break-even win rate before you trade anything. Divide the average loss by the sum of the average win and the average loss.
Be most suspicious of the rule you did not expect. A backwards filter that beats the sensible one is usually the sample talking, not the market.
The second point is what this test exists to demonstrate. The best drawdown figure in the whole series came from rules fitted to the same years that scored them, and one of those rules is the opposite of what the evidence elsewhere supports.
When a backtest finally produces a number you like, check the trade count and check what the rules were allowed to see.
Before testing any of this with real money, read about risk management and size accordingly.
Is The CHoCH Strategy Worth Your Time?
Not as it is taught, and 1,137 trades is enough to say that part plainly.
The textbook rules lost money across 1,137 trades, ending at $3,027 with a 73.0 percent drawdown.
Two filters improved every metric and cut the worst fall to 25.8 percent, the first time in this series.
Those filters left 224 trades, with period results swinging from plus 38.9R to minus 39.0R per hundred.
The idea behind CHoCH is not wrong. Structure does break before trends turn, and reading that break is a real skill worth building.
What fails is the textbook packaging. A break taken immediately, a 1 ATR stop, and nothing checking whether the market is active enough for the break to carry.
If you want to trade CHoCH anyway, the volatility filter is the part worth keeping. Skip the direction rule until a larger sample says otherwise.
Also Read: Forex Market Structure
Frequently Asked Questions
Does The CHoCH Strategy Work In Forex?
Not as it is commonly taught. The AFM Research Lab ran it across 1,137 trades and eight years of Daily data, and $10,000 finished at $3,027 with a 73.0 percent drawdown.
What Is A CHoCH In Trading?
It stands for Change of Character, and it marks the point where price breaks the most recent swing point against the trend. In a downtrend that means breaking above the last lower high.
What Win Rate Does The CHoCH Strategy Need?
About 35 percent, given an average win of 1.97R against an average loss of 1.05R. The textbook version won 32 percent, which is why it lost money steadily.
Do Filters Make The CHoCH Strategy Profitable?
Not on this data. Two filters improved every metric and cut the worst fall to 25.8 percent, but they left only 224 trades, with period results ranging from plus 38.9R to minus 39.0R per hundred.
How Often Does The Filtered CHoCH Strategy Trade?
About 27 times a year across all 28 pairs, which is roughly one trade per pair every 13 months. The filters removed 80 percent of the signals the textbook version took.
Is CHoCH The Same As A Break Of Structure?
They describe different events. A break of structure continues the existing trend by taking the last swing point in its direction, while a CHoCH breaks a swing point against the trend.