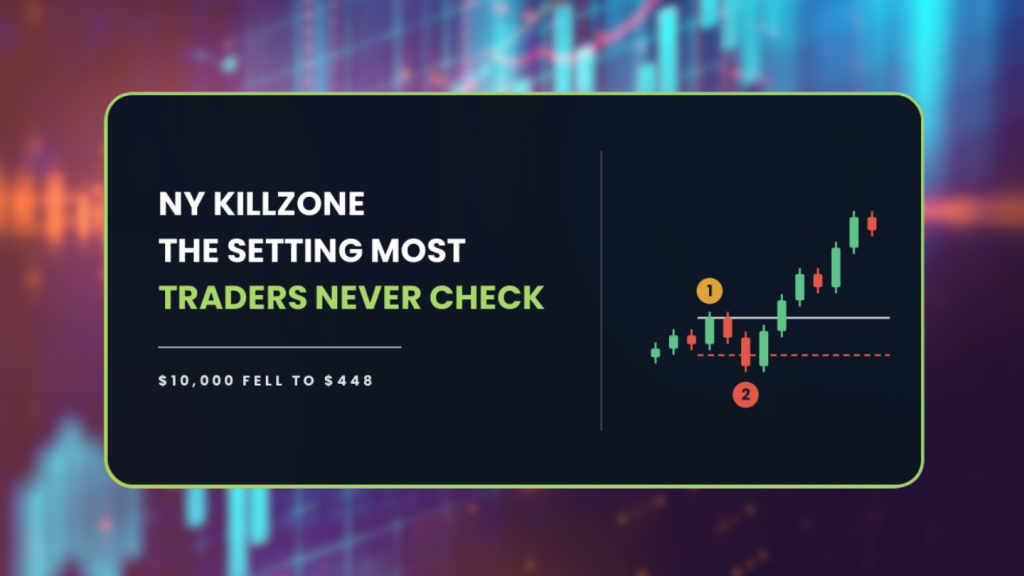
The NY Killzone strategy waits for the session, the gap, and the confirmation candle before it will risk a cent. Across 2,590 trades that discipline took $10,000 down to $448. One setting caused most of the damage, and it is none of the three.
| About This Guide |
|---|
| This guide covers the NY Killzone strategy exactly as the AFM Research Lab tested it, meaning a New York session window, a fair value gap and an engulfing confirmation, run across 28 forex pairs and ten years of 1-hour data. You will finish knowing why three confirmations still could not lift the win rate to break even, and why a stop set this tight leaves a trend filter almost nothing to do. |
| Quick Answer |
|---|
| The NY Killzone strategy waits for the New York session, then enters a fair value gap once an engulfing candle confirms direction. In the AFM Research Lab the textbook version lost money across 2,590 trades on 28 forex pairs, ending at $448 from $10,000. A daily trend filter reduced the loss by 4 percent and left the drawdown above 90 percent. |
What Happened When We Tested The NY Killzone Strategy
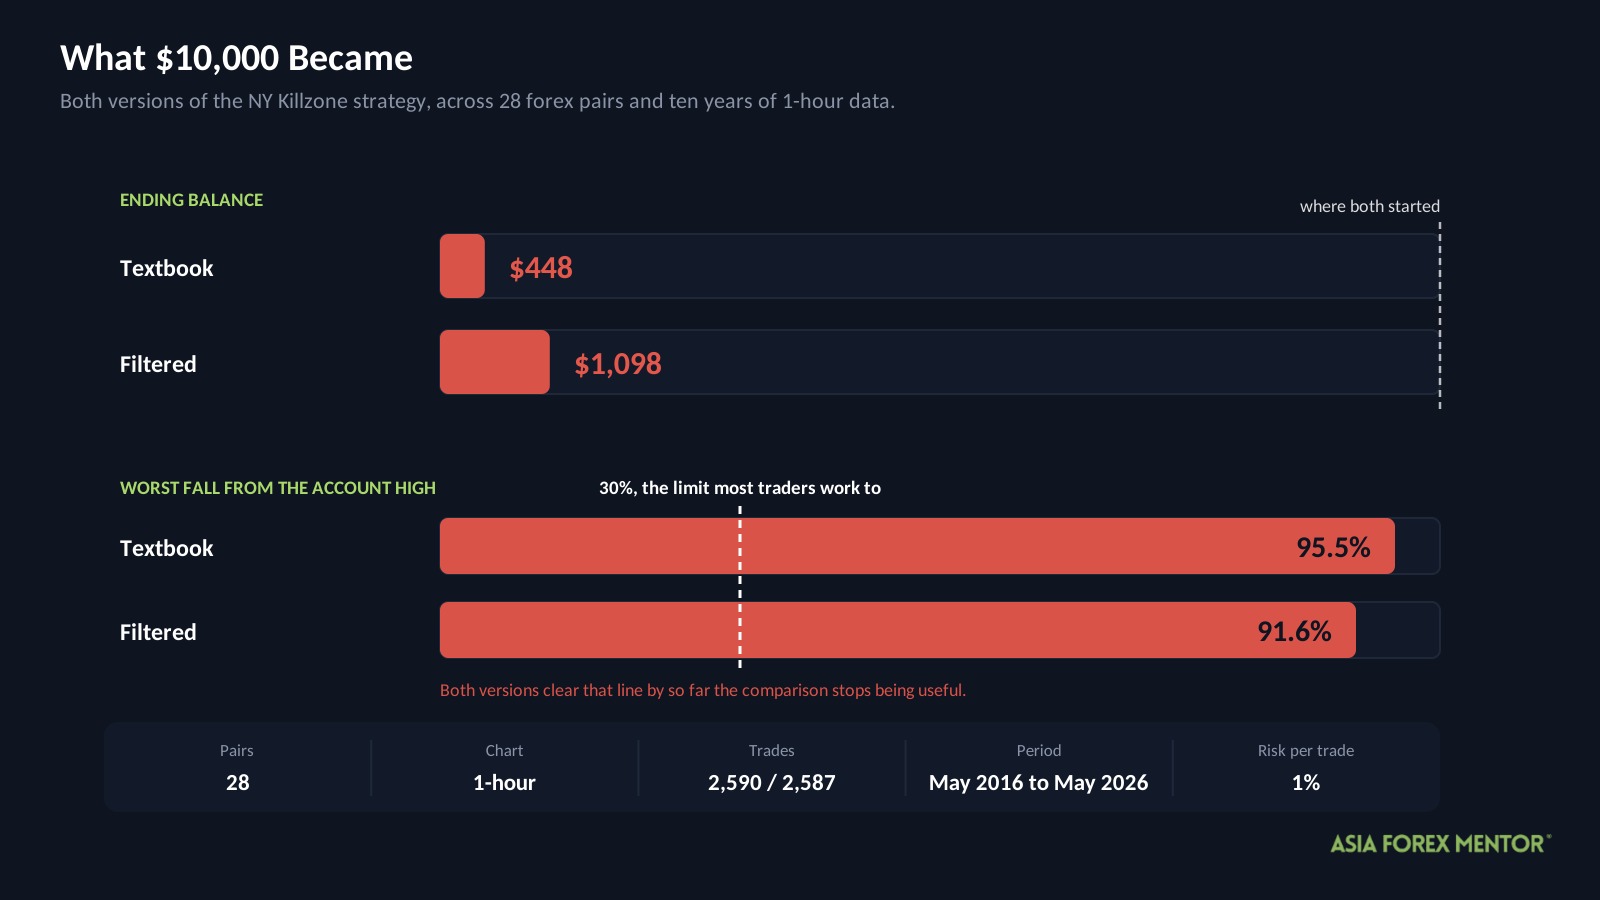
Ten years, 28 currency pairs, 2,590 trades on the 1-hour chart. Here is where a $10,000 account finished.
| Version | Start | End | Max drawdown | Trades |
|---|---|---|---|---|
| Textbook | $10,000 | $448 | 95.5% | 2,590 |
| Filtered, in-sample | $10,000 | $1,098 | 91.6% | 2,587 |
Max drawdown measures the deepest hole the account sat in, peak to trough, at any point along the way. The textbook run barely had peaks to fall from. It slid from $10,000 almost without interruption, which is why its drawdown and its final loss are nearly the same number.
We treat anything past 30 percent as untradable. Both versions clear that line by so far that the usual comparison stops being useful.
Costs came out of every trade at 0.05 percent of the entry price, round trip, and each position risked 1 percent of the account. The window runs from May 20, 2016 to May 13, 2026.
Everything below comes from a backtest. Historical prices replayed against fixed rules behave more politely than a live market, and none of it forecasts the next ten years.
Key Takeaways
- The textbook rules lost money across 2,590 trades, ending at $448 from a $10,000 start.
- Three separate confirmations produced a 32 percent win rate, four points under the 36 percent this payoff needs.
- The stop sits a quarter of an average bar away from entry, around 17 pips on the sample trade, tight enough that ordinary noise closes positions.
- Adding a daily 200 EMA direction filter moved the worst fall from 94.6 percent to 90.8 percent, the weakest result that filter has produced across this series.
- GBPUSD and GBPAUD were the only pairs to stay positive across both halves of the data, on 89 and 81 trades.
What Is The NY Killzone Strategy?
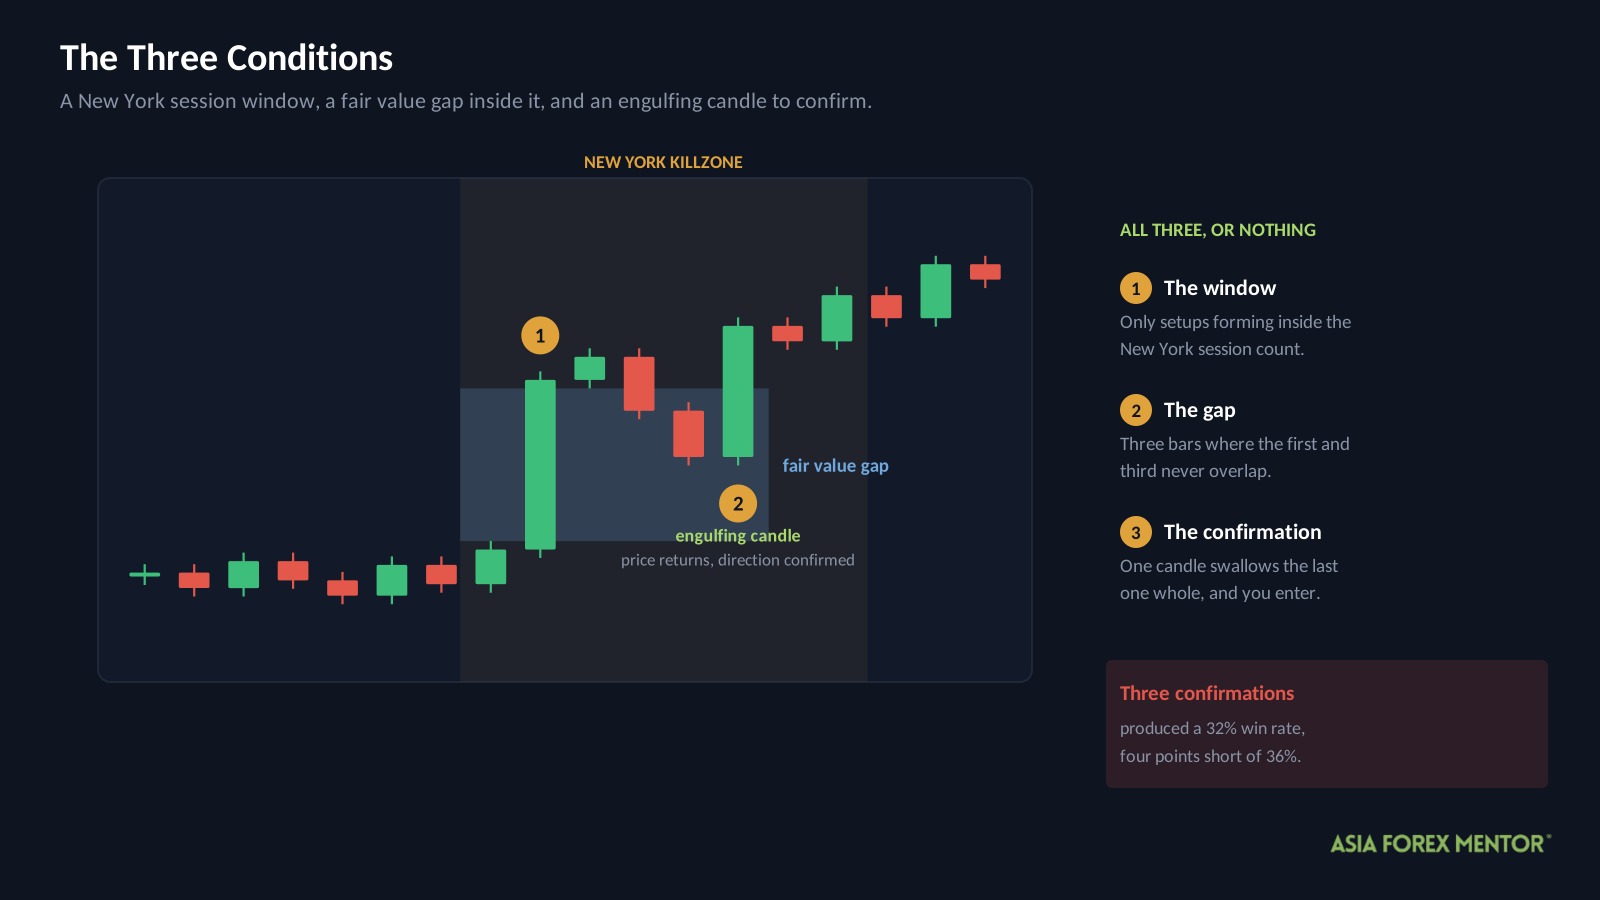
A killzone is a block of hours when one session’s order flow dominates. The New York killzone covers the opening stretch of the US session, when volume arrives and ranges widen.
The strategy only looks for setups inside that window. Outside it, nothing counts, however good the chart looks.
Inside the window it hunts for a fair value gap, a three-candle sequence where the middle bar runs so hard that the first and third bars never overlap. That untouched slice of price is the gap, and the theory is that price comes back to fill it.
An engulfing candle then has to form at or near the gap before entry. One candle swallowing the previous one whole is read as the moment one side took control. The idea behind these ICT concepts is that three independent confirmations should produce cleaner trades than any one of them alone.
How Do Most Traders Trade It?
They wait for the session window, find the gap, and let the engulfing candle tell them when to click.
| Rule | Setting |
|---|---|
| Chart | 1-hour |
| Session | New York killzone window only |
| Setup | Fair value gap on the 1-hour chart |
| Confirmation | Engulfing candle at or near the gap |
| Direction | Price on the correct side of the 50 period EMA |
| Entry | Close of the engulfing candle |
| Stop loss | 0.25 ATR from entry |
| Target | 2R |
Two things to know before the numbers mean anything.
Results are written in R, which is simply what you put at risk on that trade. Risk 1 percent of a $10,000 account and R is $100, so plus 2R means $200 came back and minus 1R means $100 went.
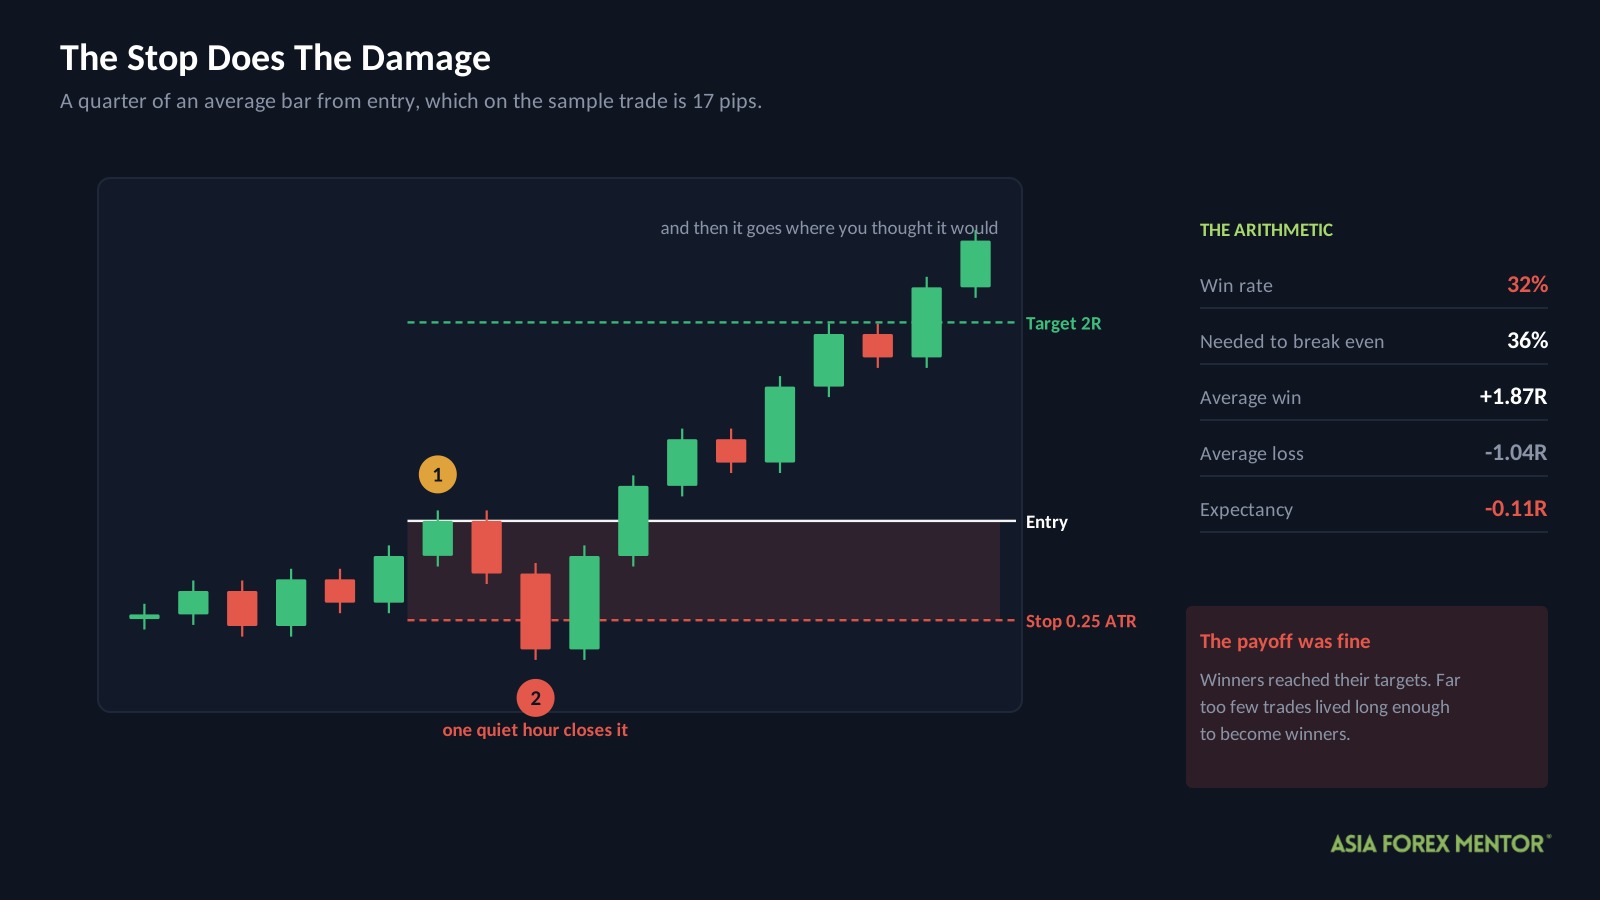
Look at that stop setting again, because 0.25 ATR is a quarter of one hourly bar. On the sample trade later in this article it works out to 17 pips. That is the single most consequential number in the whole ruleset, and almost nobody who teaches this setup says so out loud.
Why Did The Textbook Version Lose?
| Metric | Textbook |
|---|---|
| Trades | 2,590 |
| Win rate | 32% |
| Average win | +1.87R |
| Average loss | -1.04R |
| Expectancy | -0.11R |
| Profit factor | 0.84 |
| Yearly growth rate | -26.7% |
| Max drawdown | 95.5% |
| Ending balance from $10,000 | $448 |
Expectancy is what one average trade did to the account, good and bad blended together. Minus 0.11R means eleven cents of every dollar risked went away each time, and 2,590 repetitions of that is how $10,000 becomes $448.
Profit factor compares every dollar won against every dollar lost. At 0.84 the strategy collected 84 cents for each dollar it handed back.
Yearly growth rate, usually written CAGR, smooths the whole decade into one annual figure. Minus 26.7 percent a year is the rate at which this account shrank.
The payoff itself was fine. Winners averaged 1.87R against losers at 1.04R, which is close to the 2 to 1 the rules aim for. Trades that survived reached their target.
The problem is how few survived. That payoff needs a 32 trade win in every 100 to… actually it needs 36. Divide 1.04 by the two averages added together and 36 percent is what comes back. The strategy delivered 32.
Four percentage points, repeated 2,590 times, is the entire story of the account curve.
What Did We Change?
One rule, chosen on the early years and then tested on the later ones it had never seen.
| Filter | Condition | The idea behind it |
|---|---|---|
| Daily direction | Longs only above the daily 200 EMA, shorts only below it | Stop fighting the larger trend while trading inside a session window |
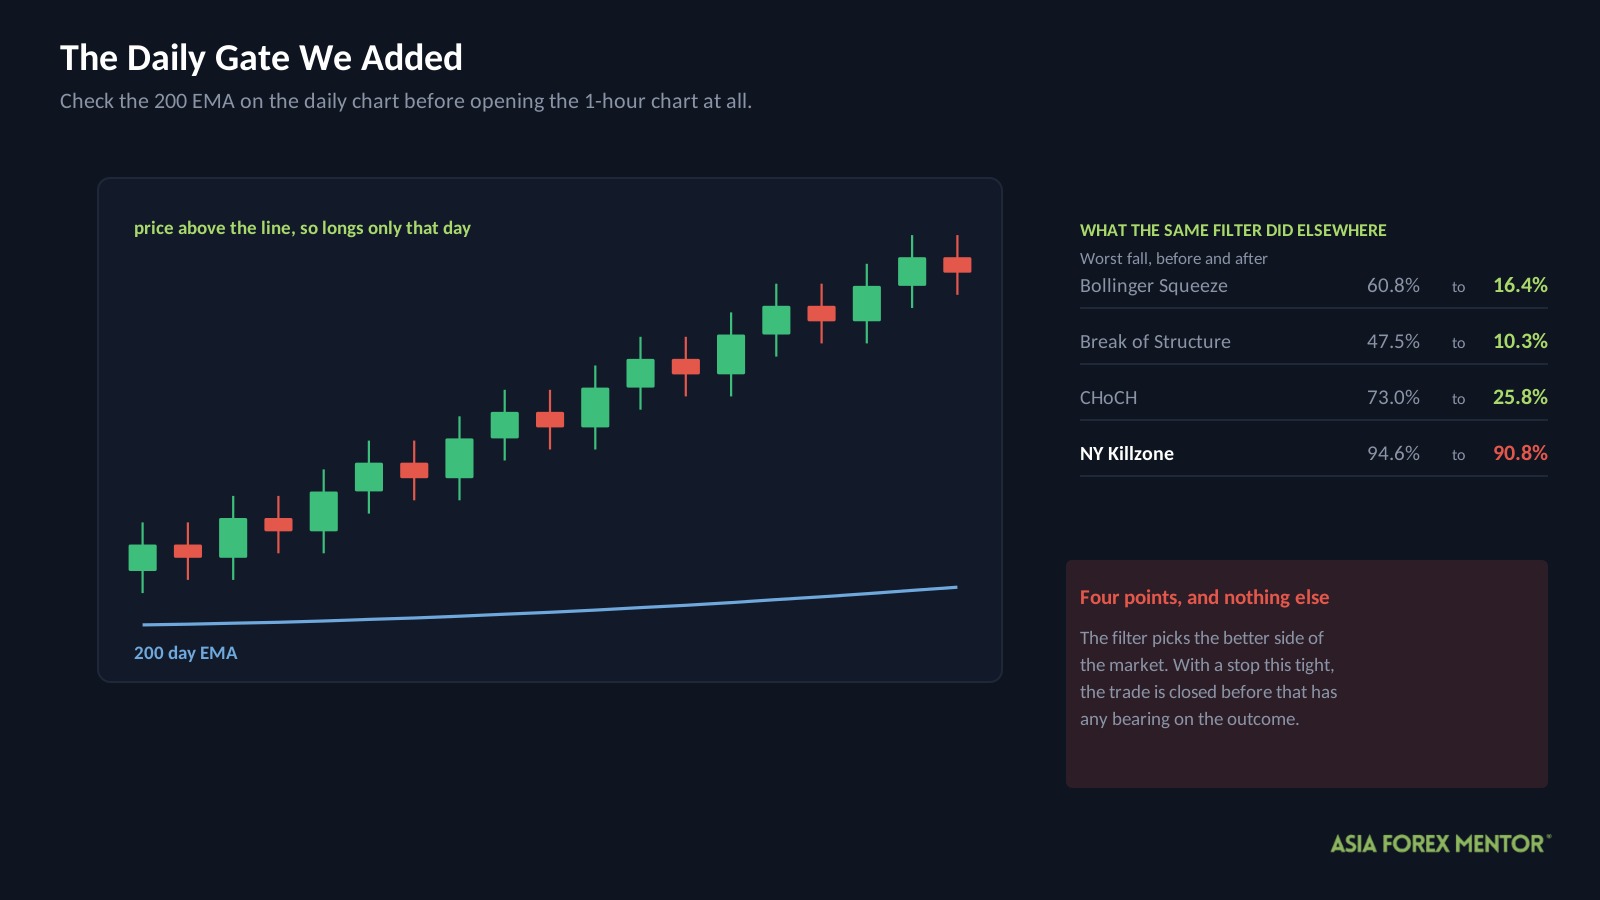
The 200 period exponential moving average on the daily chart becomes a gate you check before opening the 1-hour chart at all. Price above the line, you only look for longs that day. Below it, only shorts.
Nothing else moved. Same session window, same gap, same engulfing confirmation, same 0.25 ATR stop and 2R target. The filter can only remove trades, never change how one is managed.
Worth separating from the results table above: that filtered row came from a grid search across 12 parameter combinations run over the whole decade, which scores itself on the same data it learned from. The direction filter is a cleaner test, picked early and judged late, and every number in the next two sections comes from it.
Did The Filter Work?
Hardly at all, and that is the most useful finding in this test.
| Measure | Textbook, unseen years | Filtered, unseen years |
|---|---|---|
| Trades | 2,075 | 1,723 |
| Win rate | 31% | 31% |
| Result per 100 trades | -13.0R | -12.5R |
| Profit factor | 0.82 | 0.82 |
| Max drawdown | 94.6% | 90.8% |
Half a point of R per hundred trades. Four points off a drawdown that was already fatal. The win rate did not move at all.
Set that against what the same filter did elsewhere in this series. It took the Bollinger Squeeze from 60.8 percent down to 16.4. It took Break of Structure from 47.5 to 10.3. Here it manages 94.6 to 90.8.
The reason sits in that 0.25 ATR stop. A direction filter earns its keep by keeping you on the side of the market that is more likely to travel. That only pays if your trade survives long enough for the travelling to happen. With a stop a quarter of a bar away, a position is usually closed by the random jitter inside the next hour, before direction has any bearing on the outcome.
Put plainly: you cannot filter your way out of a stop that is too tight. The filter picks better trades and the stop kills them anyway.
Did It Hold In Every Period?
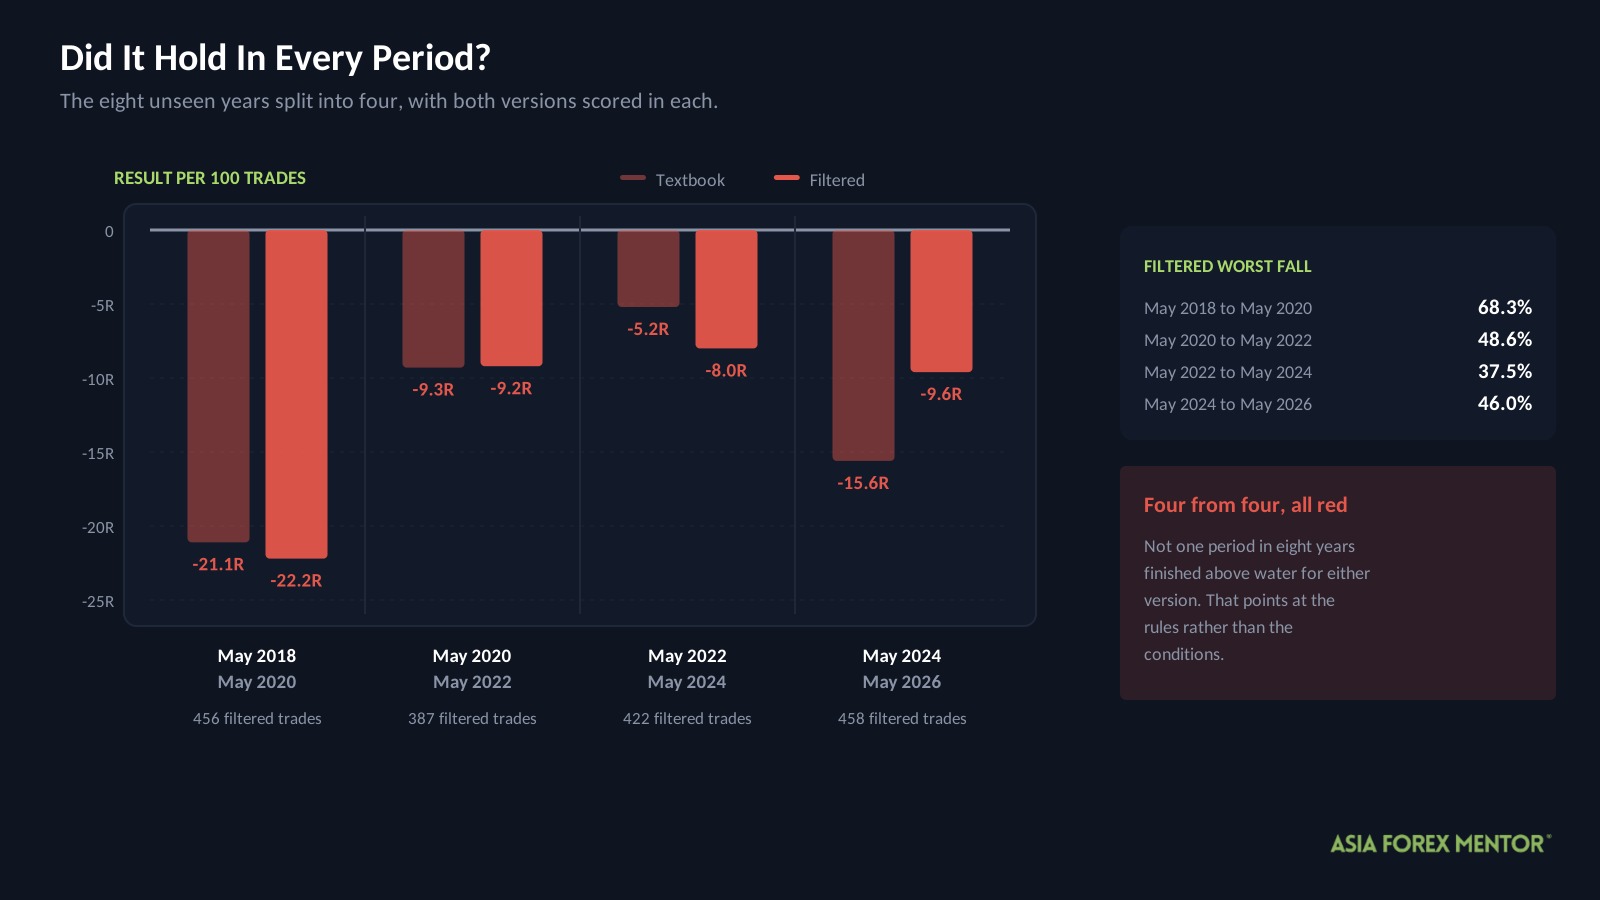
The eight unseen years split into four stretches, with both versions scored in each.
| Period | Textbook per 100 | Filtered per 100 | Filtered drawdown | Trades |
|---|---|---|---|---|
| May 2018 to May 2020 | -21.1R | -22.2R | 68.3% | 456 |
| May 2020 to May 2022 | -9.3R | -9.2R | 48.6% | 387 |
| May 2022 to May 2024 | -5.2R | -8.0R | 37.5% | 422 |
| May 2024 to May 2026 | -15.6R | -9.6R | 46.0% | 458 |
Every stretch lost money. Not one period in eight years finished above water for either version, which is rarer than it sounds and tells you this is a structural problem rather than a run of bad conditions.
The filtered drawdown came in lower every time. That consistency is real, and with roughly 420 trades in each period there is enough here to believe the direction rule genuinely softens the worst stretches.
It just softens them from catastrophic to slightly less catastrophic.
What About The Pairs?
GBPUSD returned 15.0R per hundred trades across 89 trades, and GBPAUD returned 13.1R across 81. Those two were the only pairs to stay positive in both halves of the data.
Both are sterling crosses, which is the kind of detail worth a second look rather than a conclusion. Sterling pairs move furthest during the London to New York overlap, and this setup only trades inside the New York window.
That said, two pairs out of 28, on fewer than 90 trades each, is a thin result. Treat it as somewhere to start looking rather than somewhere to start trading.
What Did A Winning Trade Look Like?
| Detail | Value |
|---|---|
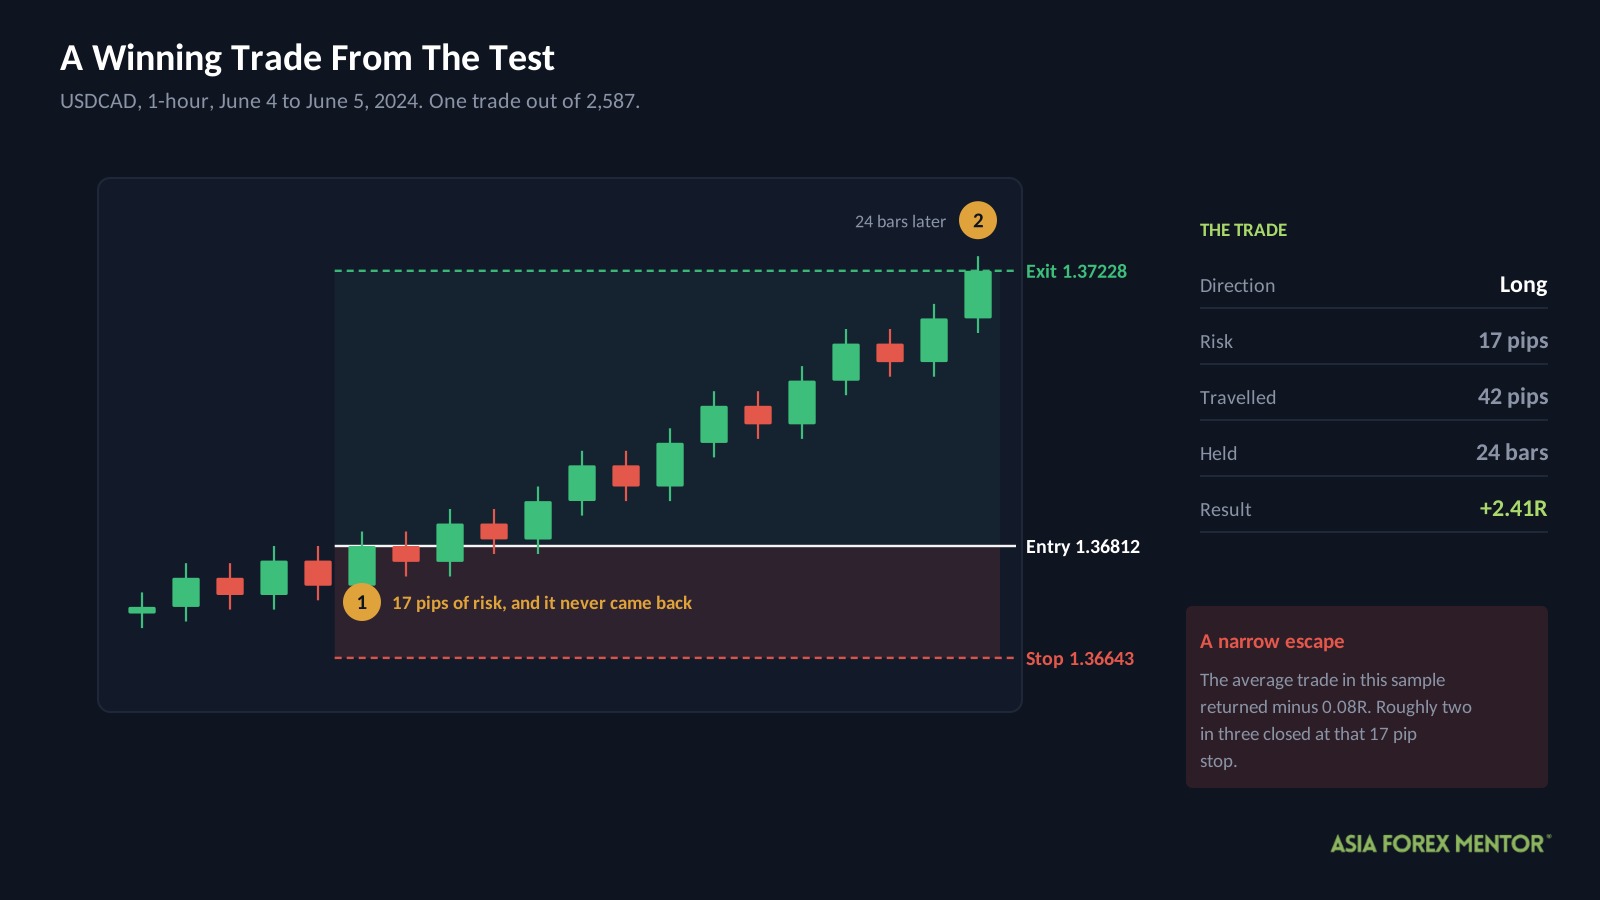
| Pair and chart | USDCAD, 1-hour |
| Direction | Long |
| Entry | June 4, 2024 at 1.36812 |
| Stop | 1.36643 |
| Exit | June 5, 2024 at 1.37228 |
| Result | +2.41R in 24 bars |
Look at the distance between entry and stop: 17 pips. That is the whole risk on the trade, and on a 1-hour USDCAD chart a quiet hour can cover it.
Price travelled 42 pips in the right direction over a single trading day and never came back far enough to touch the stop. That is what a winner looks like here, and it is a narrow escape rather than a comfortable ride.
The average trade in the filtered sample returned minus 0.08R. Roughly two in three closed at that 17 pip stop.
What Should You Take From This?
The lesson here is not about killzones, gaps or engulfing candles. It is about what a stop does to everything else you bolt on.
Stop width sets a ceiling on how much any filter can help you. Work out your stop as a fraction of a typical bar on your chart. Anything under half a bar and you are mostly measuring noise, no matter how good your entry logic is. Widen the stop and the same filters start to matter.
Confirmations do not add up the way they look like they should. Three conditions here produced a 32 percent win rate. Each one sounds like it should raise your odds, and stacking them mostly just made the setup rarer while leaving the win rate where it was.
Check your payoff against your win rate before anything else. The arithmetic takes ten seconds and it tells you whether a system can work at all, independent of how convincing the chart looks.
If you want one thing to carry into your own trading, measure your stop in ATR this week and see what fraction of a bar it is. Most traders have never checked.
Is The NY Killzone Strategy Worth Your Time?
Three confirmations and a 2,590 trade sample give a clear answer, and the answer is no.
- The textbook rules lost money across 2,590 trades, ending at $448 with a 95.5 percent drawdown.
- The payoff is sound at 1.87R against 1.04R, but a 32 percent win rate sits four points under what that payoff needs.
- The daily direction filter cut the drawdown by less than four points, its weakest showing anywhere in this series.
Killzone timing is not the problem. Session windows do concentrate volume, and the overlap hours genuinely behave differently from the rest of the day.
The problem is a stop set at a quarter of an hourly bar, which closes positions before any of the other three conditions get a chance to be right.
If this setup interests you, the experiment worth running is not another filter. Widen the stop to one full ATR, accept the smaller position size that forces, and see whether the win rate moves. That is the variable this test suggests actually matters.
Also Read: Fair Value Gap Strategy Tested
Frequently Asked Questions
Does The NY Killzone Strategy Work In Forex?
It did not here. The AFM Research Lab ran it across 2,590 trades and ten years of 1-hour data, and $10,000 finished at $448 with a 95.5 percent drawdown.
What Is The New York Killzone?
It is the block of hours around the New York session open, when US order flow arrives and ranges typically widen. Strategies built on it ignore every setup that forms outside that window.
What Win Rate Does This Setup Need?
Thirty-six percent, given winners averaging 1.87R against losers at 1.04R. The tested version managed 32 percent, and that four point gap is what drained the account.
Why Did The Daily Trend Filter Barely Help?
Because the stop sits a quarter of an average bar from entry. Trades get closed by ordinary price noise within the hour, before the larger trend has any influence on where price finishes.
Which Pairs Suited The NY Killzone Strategy Best?
GBPUSD and GBPAUD, at 15.0R and 13.1R per hundred trades, were the only two positive across both halves of the data. Both are sterling crosses, which move most during the London to New York overlap.
How Often Does This Setup Trade?
Around 259 times a year across all 28 pairs, or roughly nine trades per pair annually. The daily direction filter removes about 17 percent of those.