Learn To Trade Forex • Best Forex Trading Course • AsiaForexMentor

In the world of trading and investment, understanding chart patterns is indispensable for making informed decisions. One such significant pattern is the stick sandwich pattern, which appears in candlestick charts. This pattern is highly sought after for its potential to indicate trend reversals. It is commonly used by traders in various markets, including the Forex market, to assess price movements and make trading decisions.
The stick sandwich pattern is comprised of three candlesticks, and its formation can be a strong indicator of a coming change in market direction. This pattern can manifest in two forms: bullish stick sandwich and bearish stick sandwich. Each has its own set of rules and implications that traders need to understand. This article delves deep into the anatomy, types, and practical applications of this intriguing candlestick pattern.
Introduction to Stick Sandwich Pattern
The stick sandwich candlestick pattern is a unique formation in the realm of candlestick charting, offering traders a window into potential market reversals. Recognized by its three-candle layout, this pattern is often used to predict shifts in market trends, enabling traders to make timely trading decisions. Whether you're navigating the Forex market or dealing with other investment avenues, understanding this pattern can provide valuable insights into price movements.
The importance of the stick sandwich candle pattern cannot be overstated. For traders looking to enter or exit long positions, or for those aiming to manage risk, this pattern serves as an essential tool. It helps traders to gauge the market's sentiment, providing clues about future price direction. The pattern can appear in both bullish and bearish contexts, known respectively as the bullish stick sandwich and the bearish stick sandwich. Each variant has its own implications, influencing how traders should respond.
Also Read: Top 7 Candlestick Patterns Cheat Sheet
Anatomy of Stick Sandwich Pattern
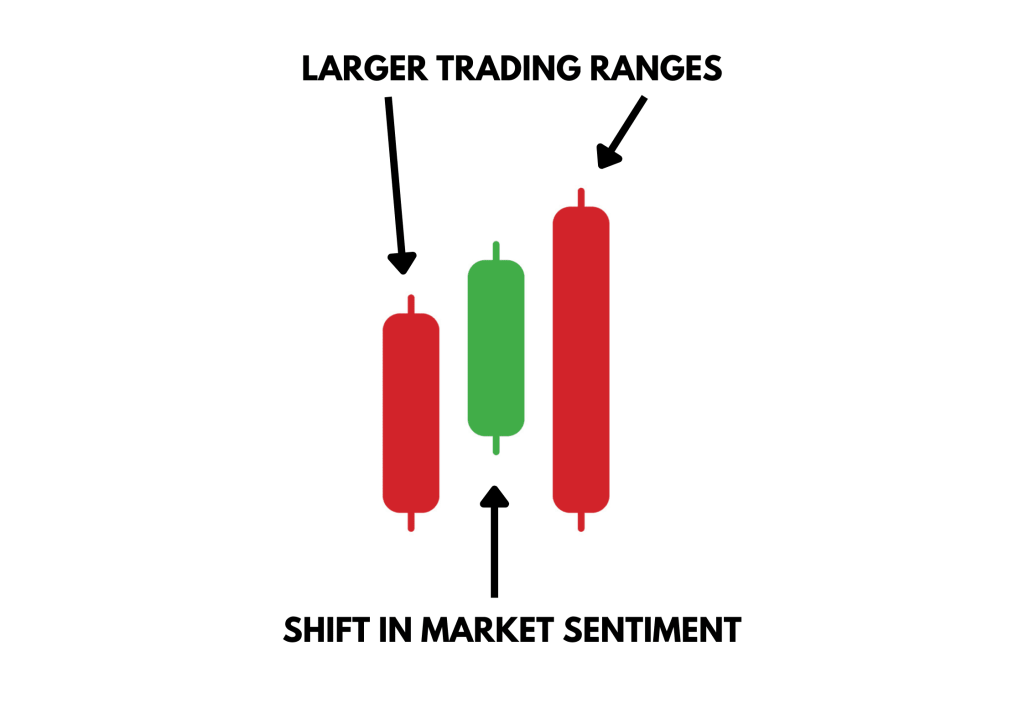
The anatomy of the stick sandwich pattern is a fascinating study in candlestick patterns. It's a formation consisting of three candles: the first candle, the middle candle, and the third candlestick. Each of these candles plays a crucial role in forming the complete pattern and provides specific information that traders use for trading decisions.
The first and third candle are of the same color, representing the same market sentiment—either bullish or bearish. These candles usually have larger trading ranges, signifying strong market conviction. The middle candle, on the other hand, is of the opposite color, reflecting a temporary shift in market sentiment. Importantly, this candle often closes at a different level, making it the candlestick sandwiched between the first and third candles. The opening and closing prices of the first and third candles should be approximately at the same level, further emphasizing the pattern's significance.
Understanding this anatomy is vital for traders who wish to effectively use stick sandwich patterns in their trading strategy. Recognizing the individual characteristics of each candle, including their opening and closing prices, can offer insights into the market's direction and help manage risk. Whether you're in a bullish or bearish market, knowing the specifics of the stick sandwich pattern can be a useful tool for finding reversals and optimizing trade setups.
Types of Stick Sandwich Patterns
The stick sandwich pattern can manifest in two primary forms, each with its own set of implications for traders. These are the bullish stick sandwich and the bearish stick sandwich. Understanding these types can help traders make informed trading decisions, whether they are looking to take long positions or planning to manage risk effectively.
Bullish Stick Sandwich
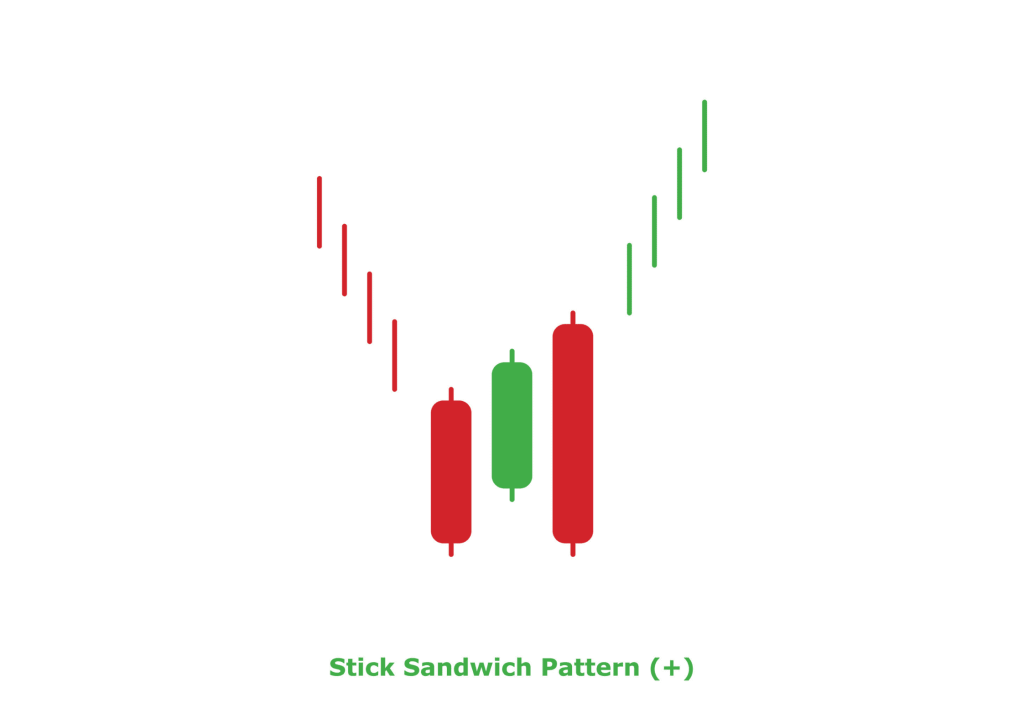
The bullish stick sandwich is a pattern that usually appears during a downtrend in the market. When traders spot this formation, it often indicates a potential bullish reversal. In this pattern, the first candle is bearish, the middle candle is bullish, and the third candle is bearish again. Despite this alternating color sequence, the closing prices of the first and third candles are almost at the same level, reinforcing the pattern's reliability.
Bearish Stick Sandwich
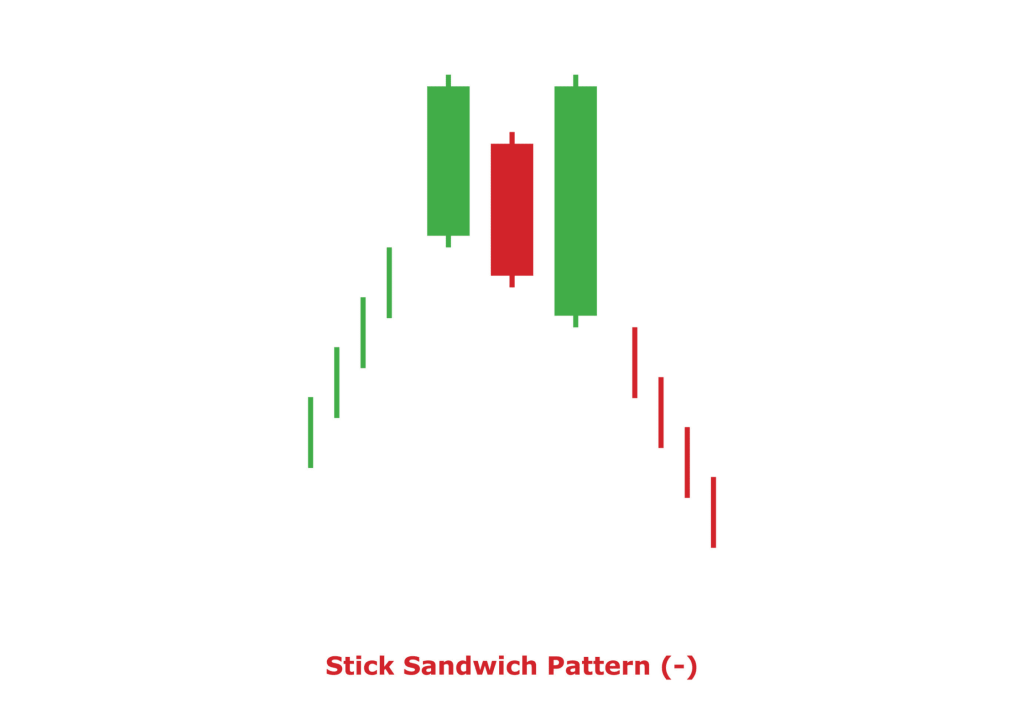
The bearish stick sandwich is the mirror opposite and often shows up during an uptrend. This formation hints at a possible bearish reversal. The first candle in this pattern is bullish, followed by a middle candle that is bearish, and ending with a third candle that is bullish again. Just like its bullish counterpart, the first and third candle should close nearly at the same level.
How to Trade Stick Sandwich Patterns
Trading with the stick sandwich pattern involves more than just pattern recognition. It requires a strategic approach that incorporates risk management, volume analysis, and understanding support levels. These elements contribute to making sound trading decisions in both bullish and bearish markets.
Risk Management
One of the first steps in trading this pattern effectively is to manage risk. A common approach is to set a stop loss to limit potential losses. Understanding the maximum loss you are willing to take, as well as the maximum drawdown, is crucial for protecting your investment. This risk management strategy should align with your overall trading objectives and market outlook.
Volume and Support Level
Another important factor to consider is volume. High trading volume during the formation of the stick sandwich pattern often increases its reliability. Alongside volume, identifying the support level is key. A strong support level that aligns with the pattern can provide additional confirmation, making your trade more secure.
Timing and Entry Points
When the stick sandwich pattern appears, traders often wait for additional confirmation before entering or exiting a trade. This can be in the form of another confirming candlestick pattern, like the morning star, or a favorable move in closing prices. Knowing the right timing can enhance the pattern's effectiveness and improve trade outcomes.
By integrating these strategies, traders can harness the full potential of stick sandwich patterns in their trading playbook. Whether looking for trend reversals or contemplating long positions, a comprehensive approach ensures you are well-equipped to navigate the intricacies of Forex trading and other investment markets.
Also Read: The RSI Forex Indicator Complete Guide
Conclusion
In conclusion, stick sandwiches serve as a robust analytical tool for finding reversals, especially in larger trading ranges. The ability to decipher whether it's a bullish stick sandwich or a bearish stick sandwich can dramatically impact your trading decisions. These patterns provide invaluable insights into market sentiment and future price directions, aiding traders in various markets, from Forex to equities.
However, it's crucial to remember that while these patterns are informative, they are not foolproof. Risk management remains a cornerstone of effective trading. Whether you're considering long positions or faced with a market that's turning against you, strategies like setting a stop loss or calculating maximum drawdown are indispensable. By combining pattern recognition with solid risk management, traders can maximize their opportunities while minimizing potential losses.
Also Read: How to Read Candlesticks Like a Pro
FAQs
Can Stick Sandwich Patterns Appear in Timeframes Other Than Daily Charts?
Yes, stick sandwich patterns can appear in multiple timeframes, not just daily charts. Whether you're looking at an hourly, 4-hour, or even a weekly candlestick chart, this pattern can emerge. However, traders often consider patterns on longer timeframes like daily or weekly charts to be more reliable, as they encapsulate more trading activity and sentiment.
How Does High Volume Impact the Reliability of a Stick Sandwich Pattern?
High volume during the formation of a stick sandwich pattern generally increases its reliability. A surge in trading volume can validate the pattern, indicating stronger market interest and conviction. While volume isn't the only factor to consider, its presence alongside a stick sandwich often makes the trading decision more compelling.
Are There Any Complementary Indicators That Enhance the Stick Sandwich Pattern's Effectiveness?
Absolutely, traders often use additional indicators like Moving Averages or the Relative Strength Index (RSI) alongside stick sandwich patterns. These complementary indicators can provide extra layers of confirmation for the pattern, making your trade more secure. For instance, a bullish stick sandwich pattern coupled with an RSI moving above 30 could indicate a strong bullish reversal, making the pattern more trustworthy.

