Hey guys! Ezekiel Chew here.
So let me hit you with this. How many times have you seen the stochastic screaming overbought and then you smash the sell button… but price keeps flying higher? Or it flashes oversold and you buy, but the market keeps diving lower?
That’s not bad luck. That’s the market punishing surface-level trading.
Most traders have no idea how to use the stochastic. They chase the signal without understanding what it's actually showing, momentum. And until you learn how to read momentum the right way, the stochastic is going to keep lying to you. But once you get this right, it flips from a noisy indicator into a precision weapon.
So in this guide, I’m breaking down the battle-tested stochastic oscillator strategies I personally use to filter the fake signals, catch the real reversals, and trade with momentum instead of fighting it.
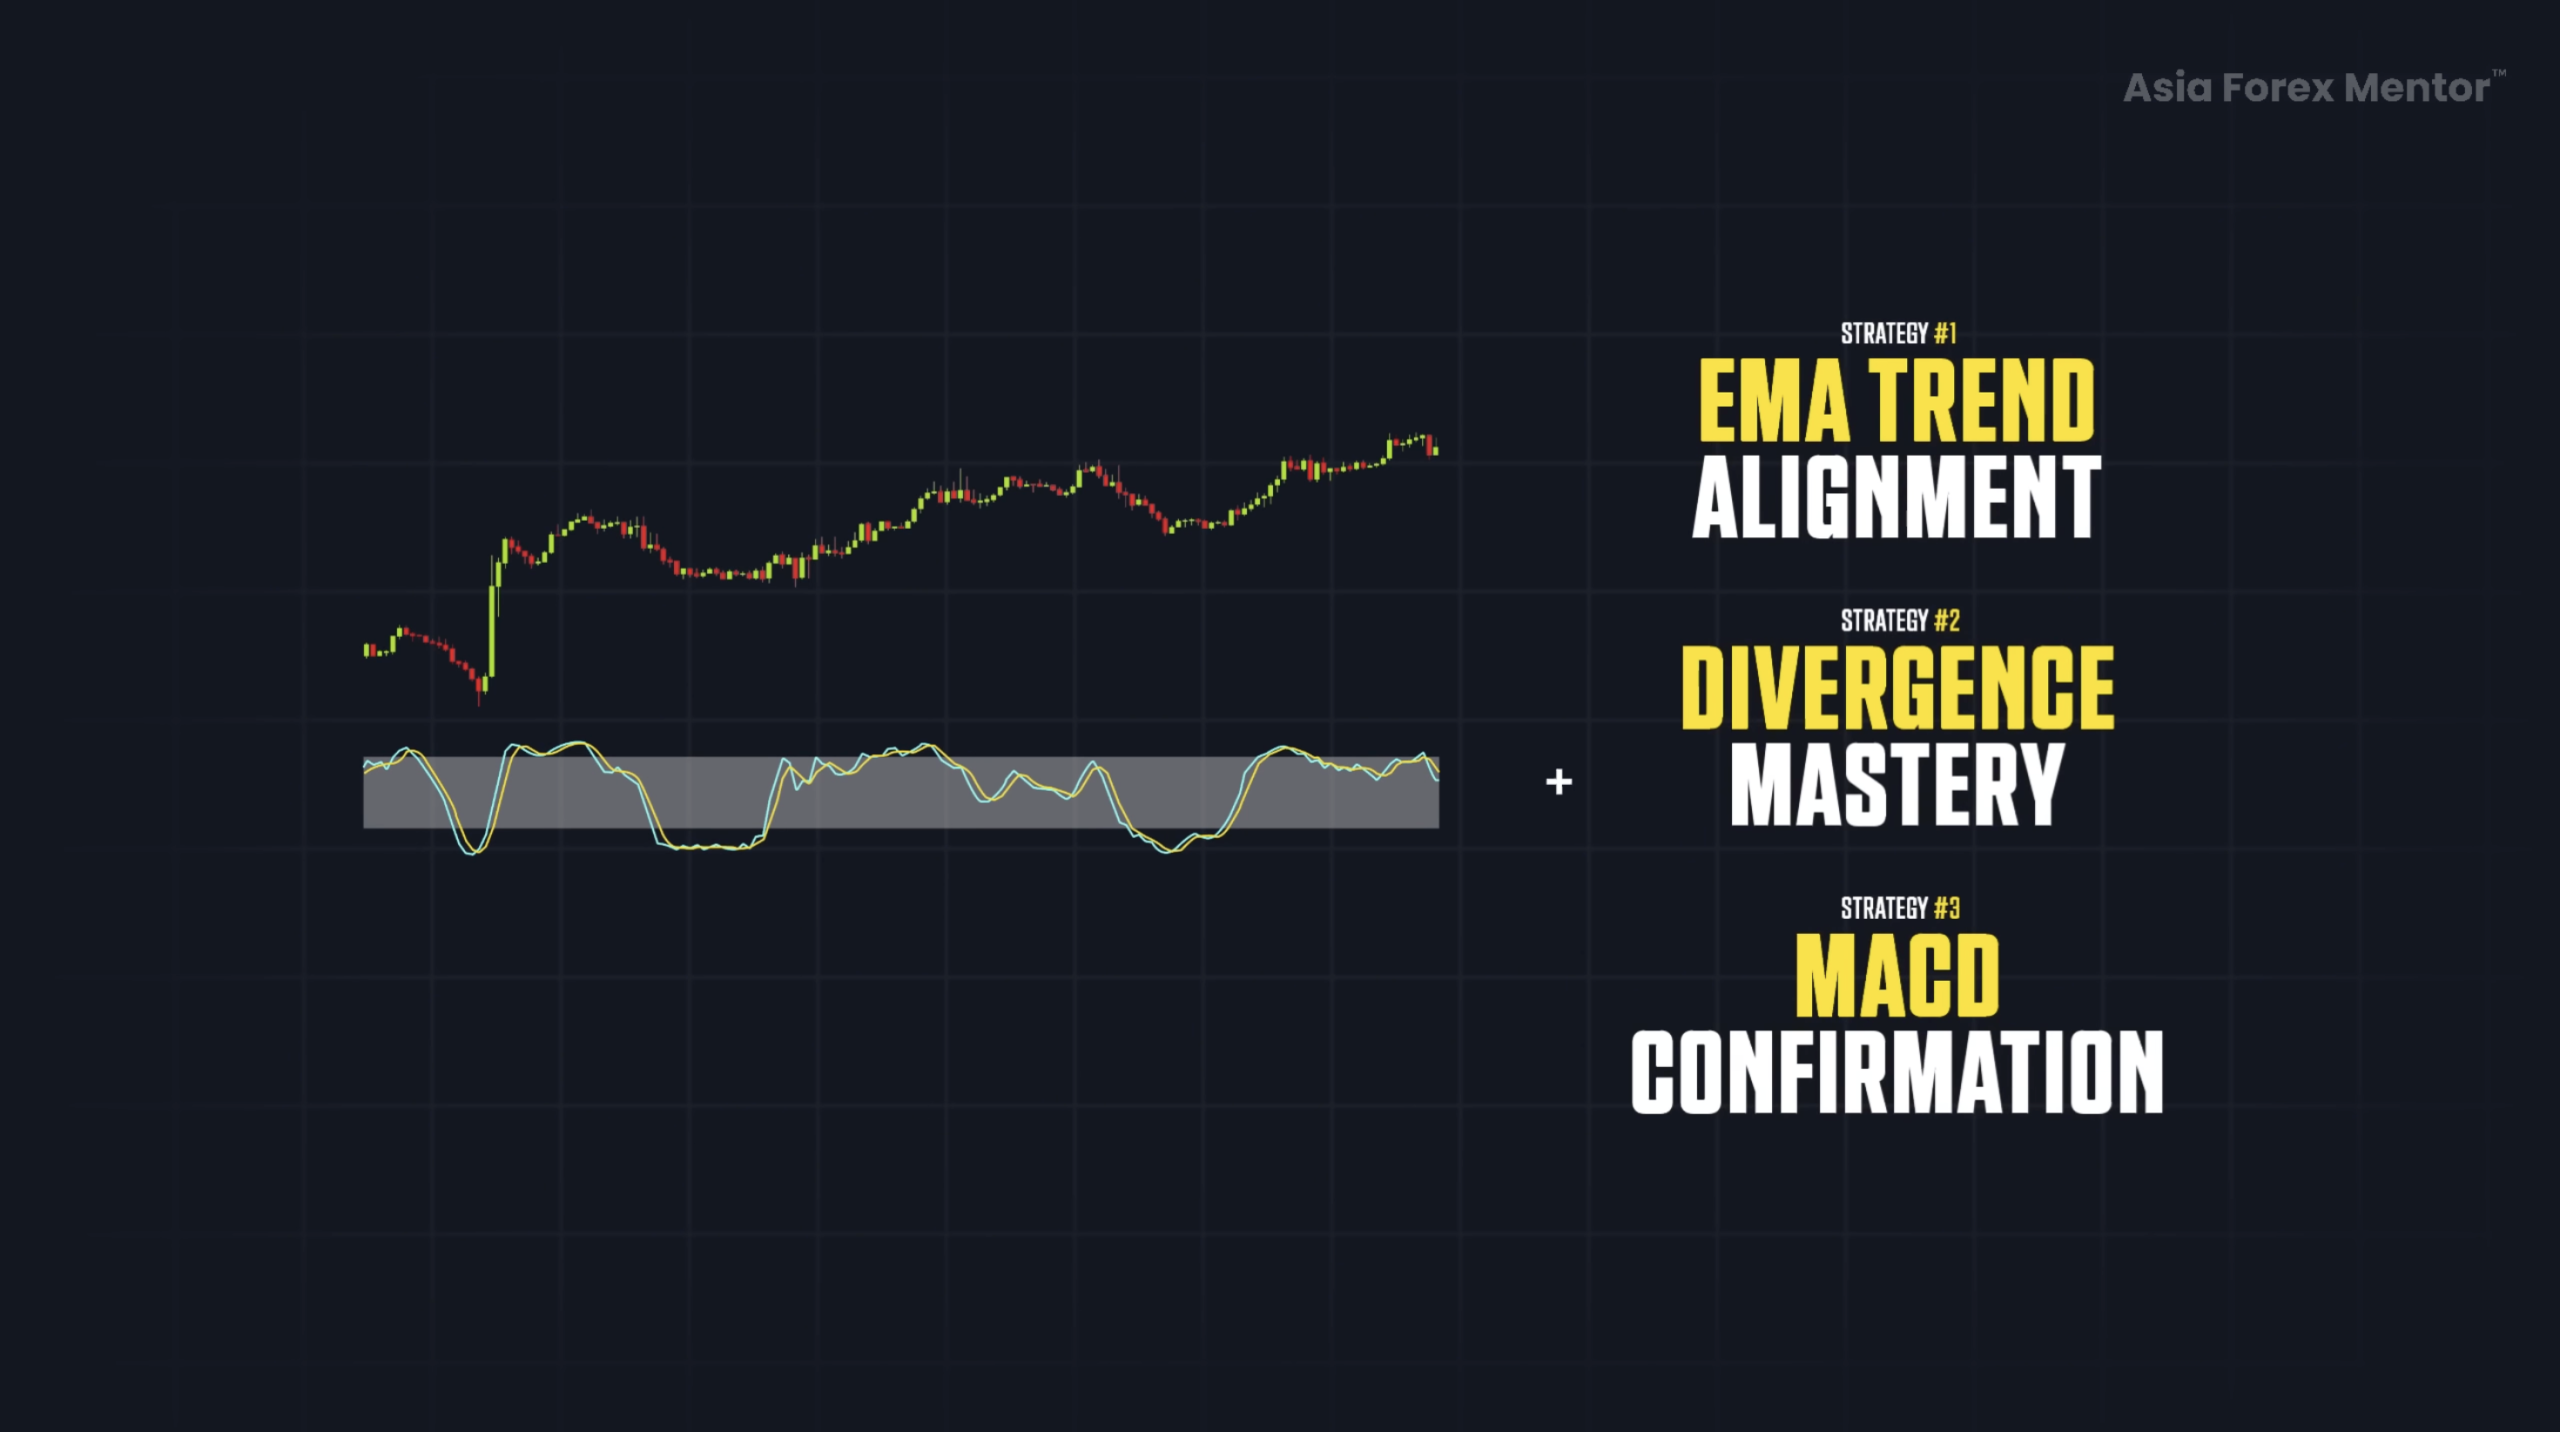
Here’s exactly what you’re going to learn in this article:
• the real core of what the stochastic oscillator reads
• how to use it together with trend alignment
• how divergence reveals the truth behind momentum
• how to add confluence tools for sniper-level entries
Once you understand this approach, you’ll never look at the stochastic the same way again.
📺 Watch the full breakdown in this video:
What Stochastric Oscillator Is
The Stochastic Oscillator looks simple, but it carries more depth than most traders realize.
It reads the story of momentum in the market. It reacts fast enough to catch early turns. And when you combine it with the confirmations I’m about to show you, it stops being just a momentum tool and becomes a complete trading setup you can use regardless of your style.
Now let’s get into it.
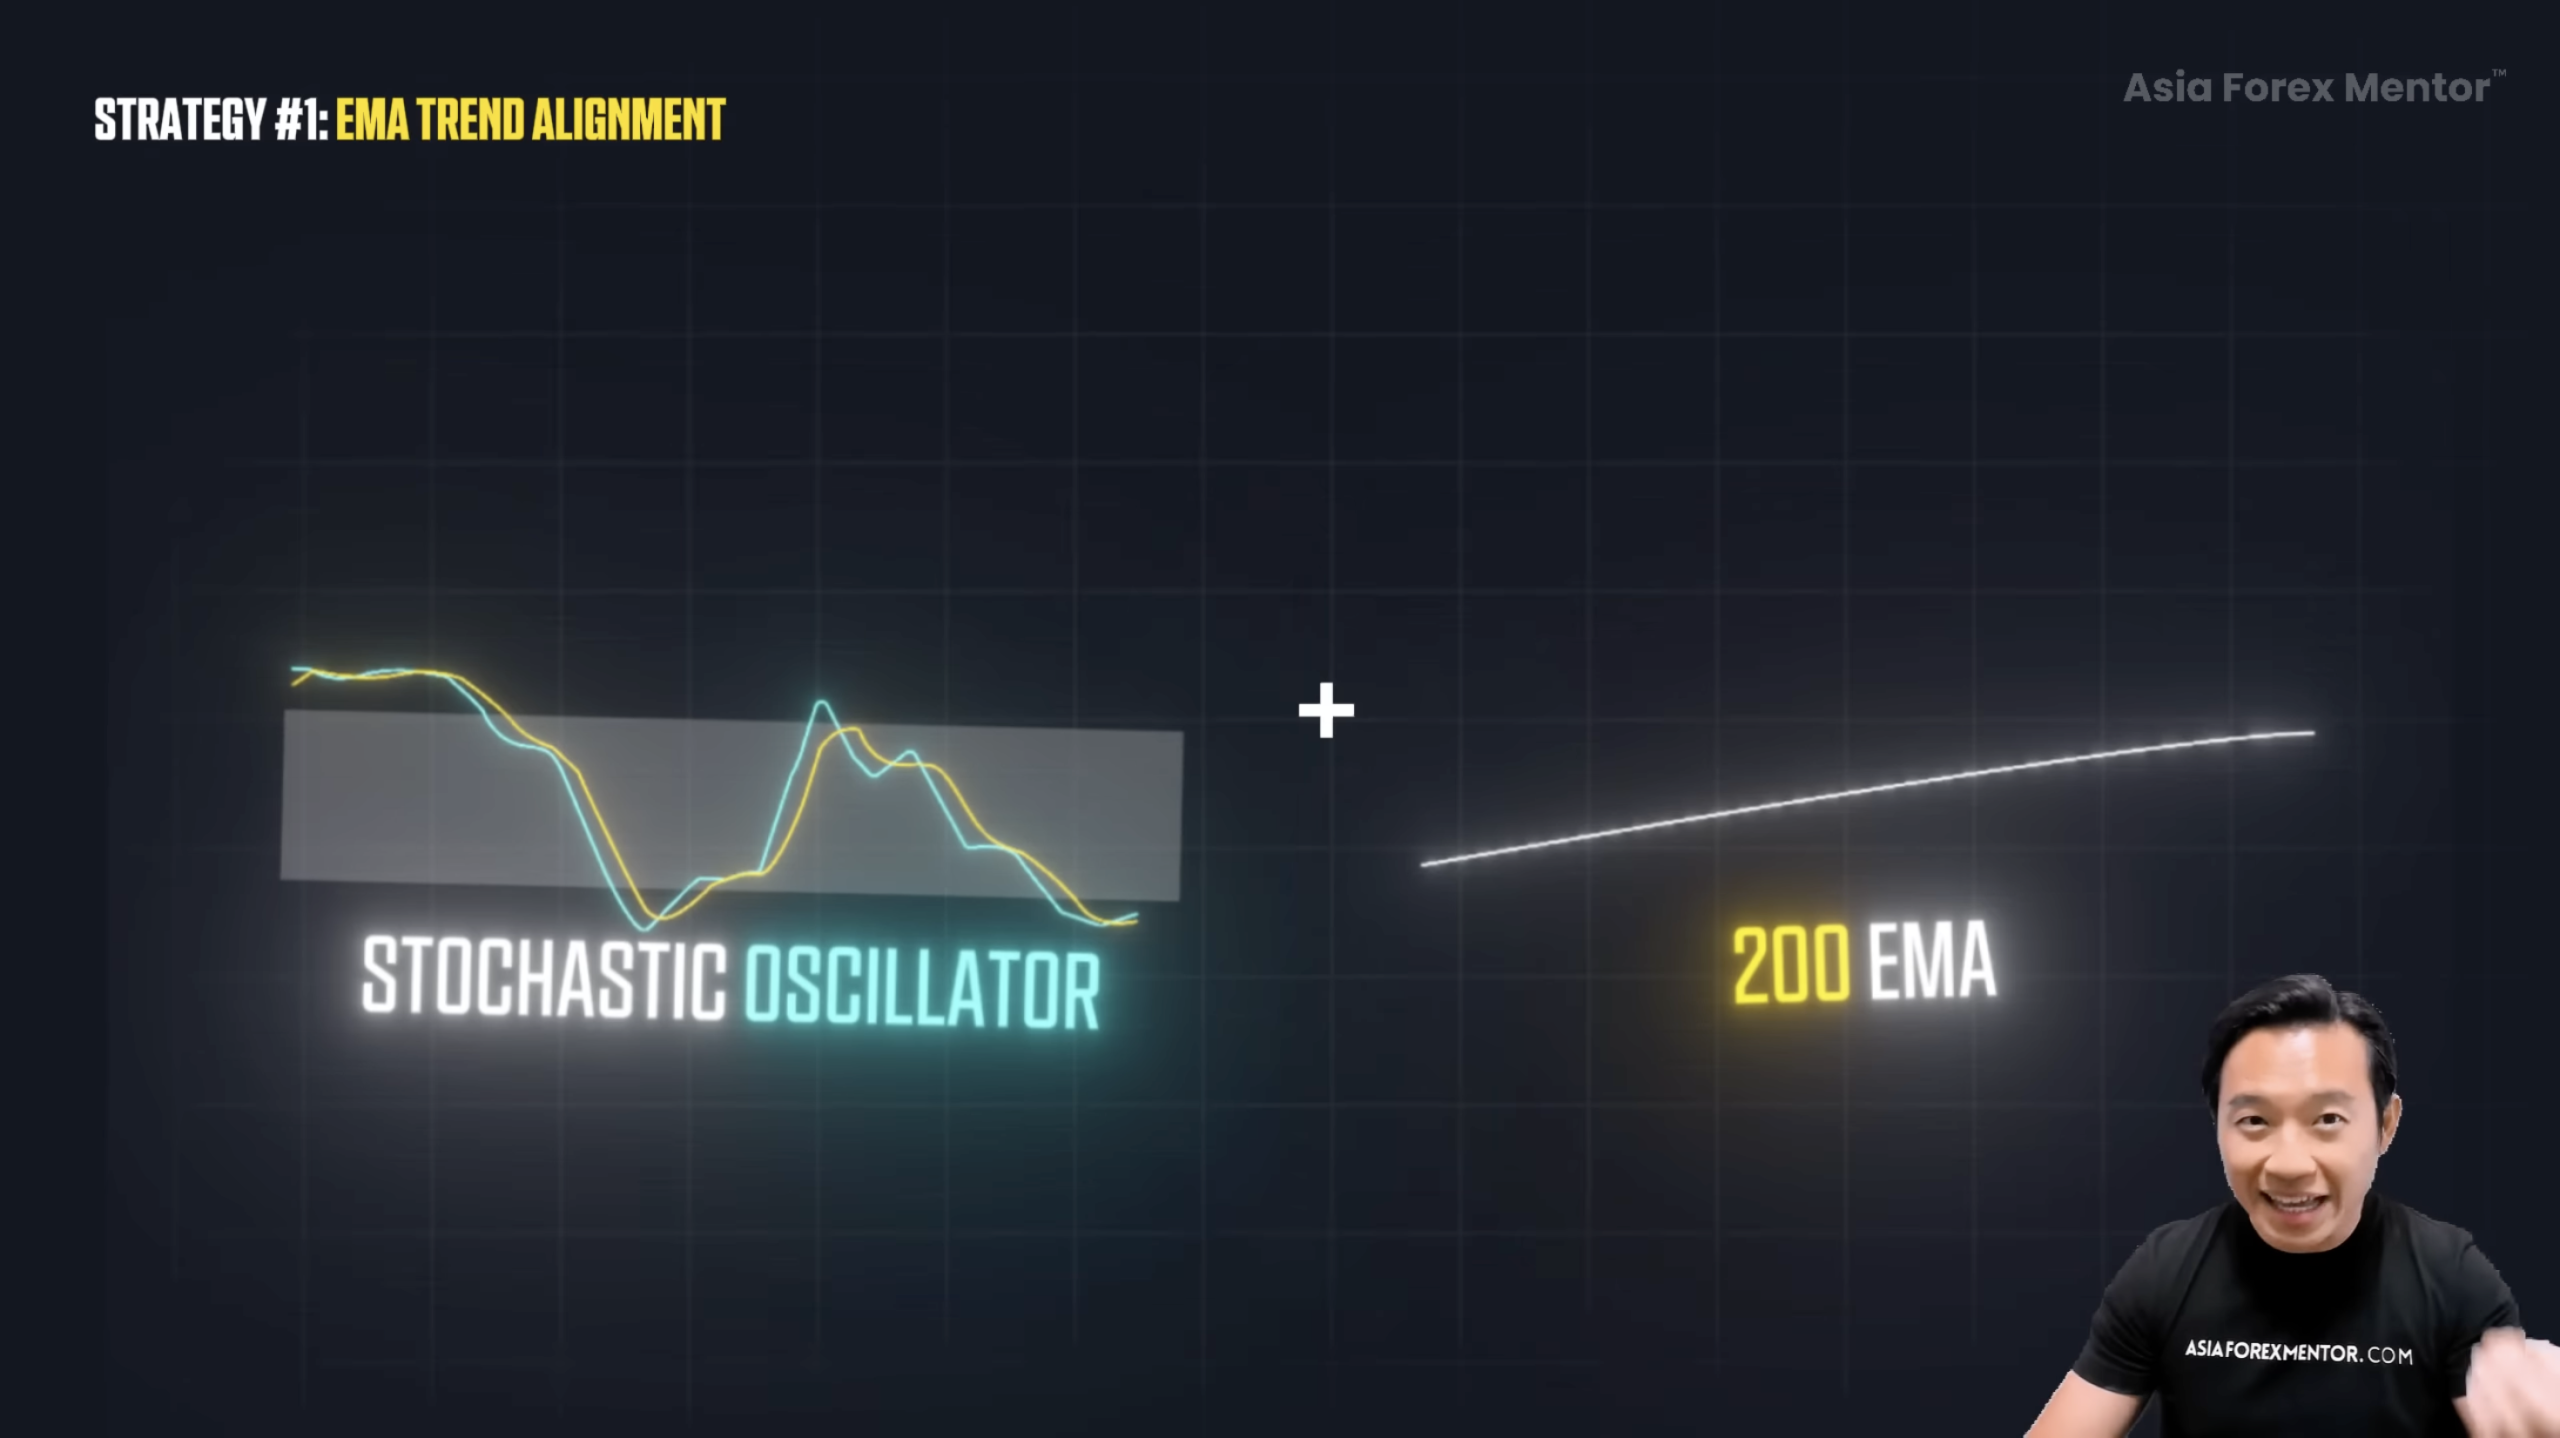
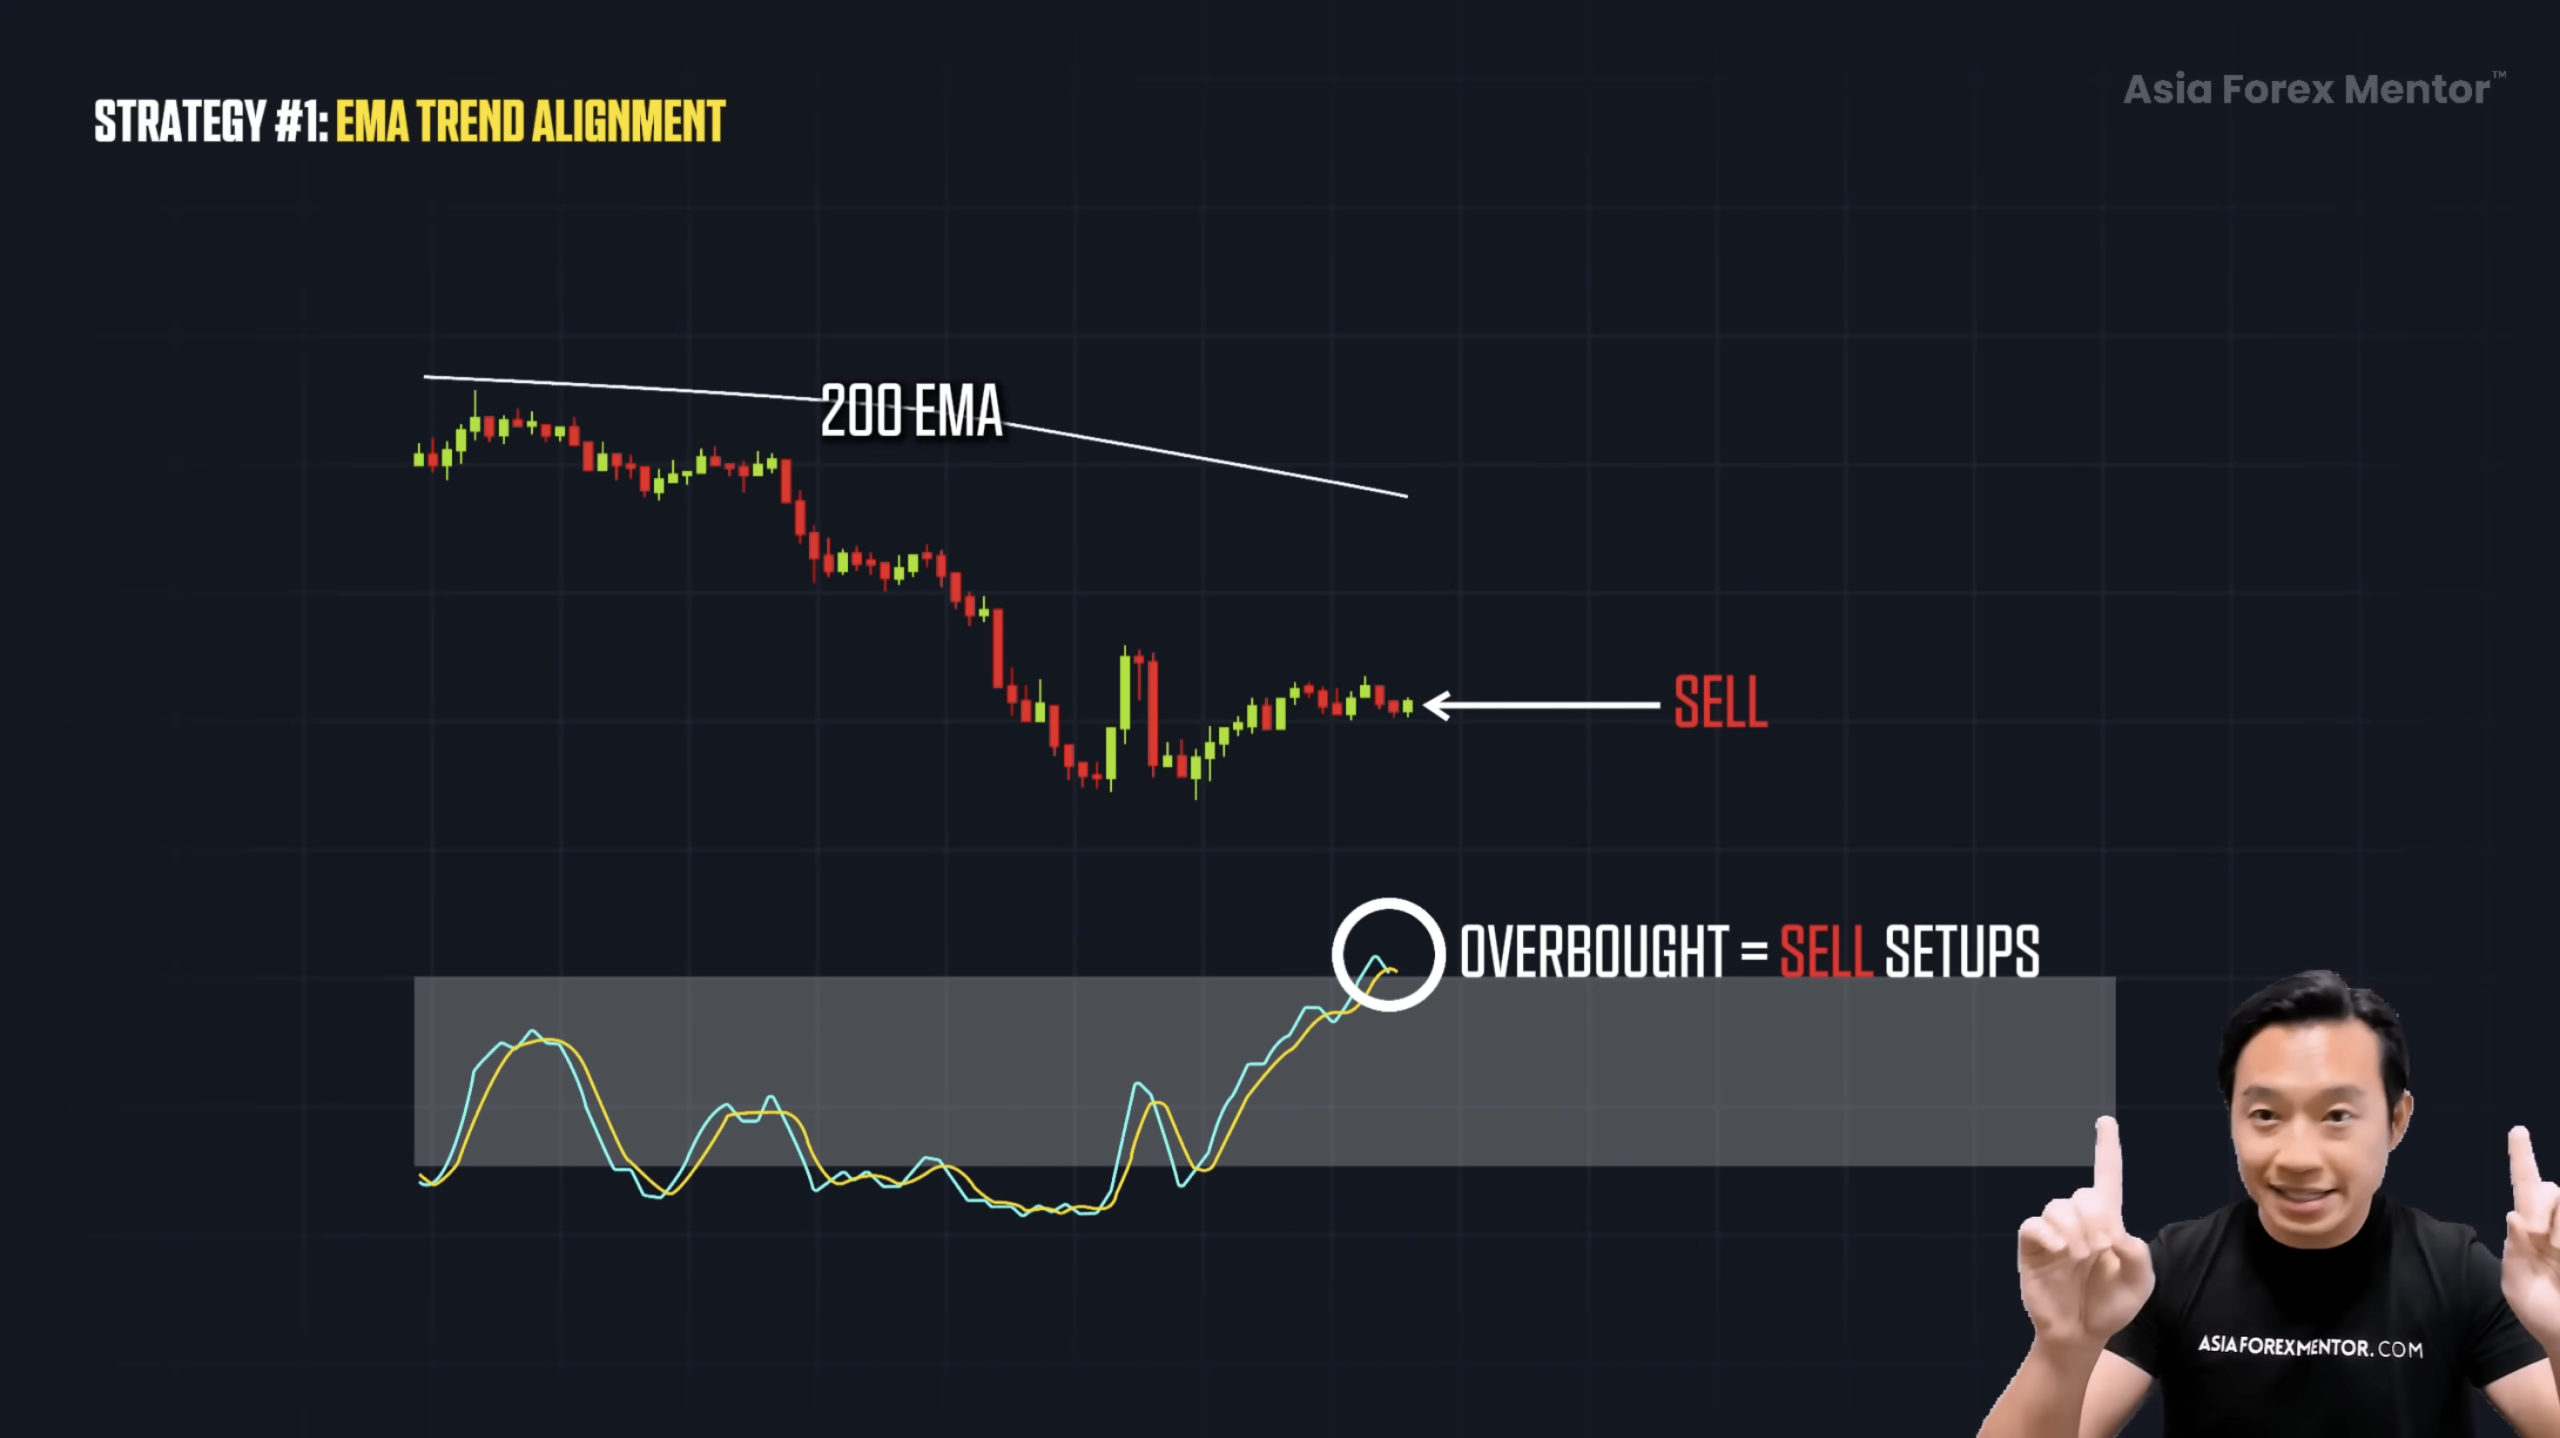
Strategy 1 – Stochastic + 200 EMA Trend Alignment
Most traders lose not because they’re getting bad signals, but because they’re picking fights with trends that are still in full charge. This strategy prevents exactly that.
I’m combining the stochastic oscillator with the 200 EMA. The stochastic shows momentum shifts. The 200 EMA confirms the overall trend direction. When you put them together, you filter out false signals and keep your trades aligned with the actual flow of the market.
How It Works
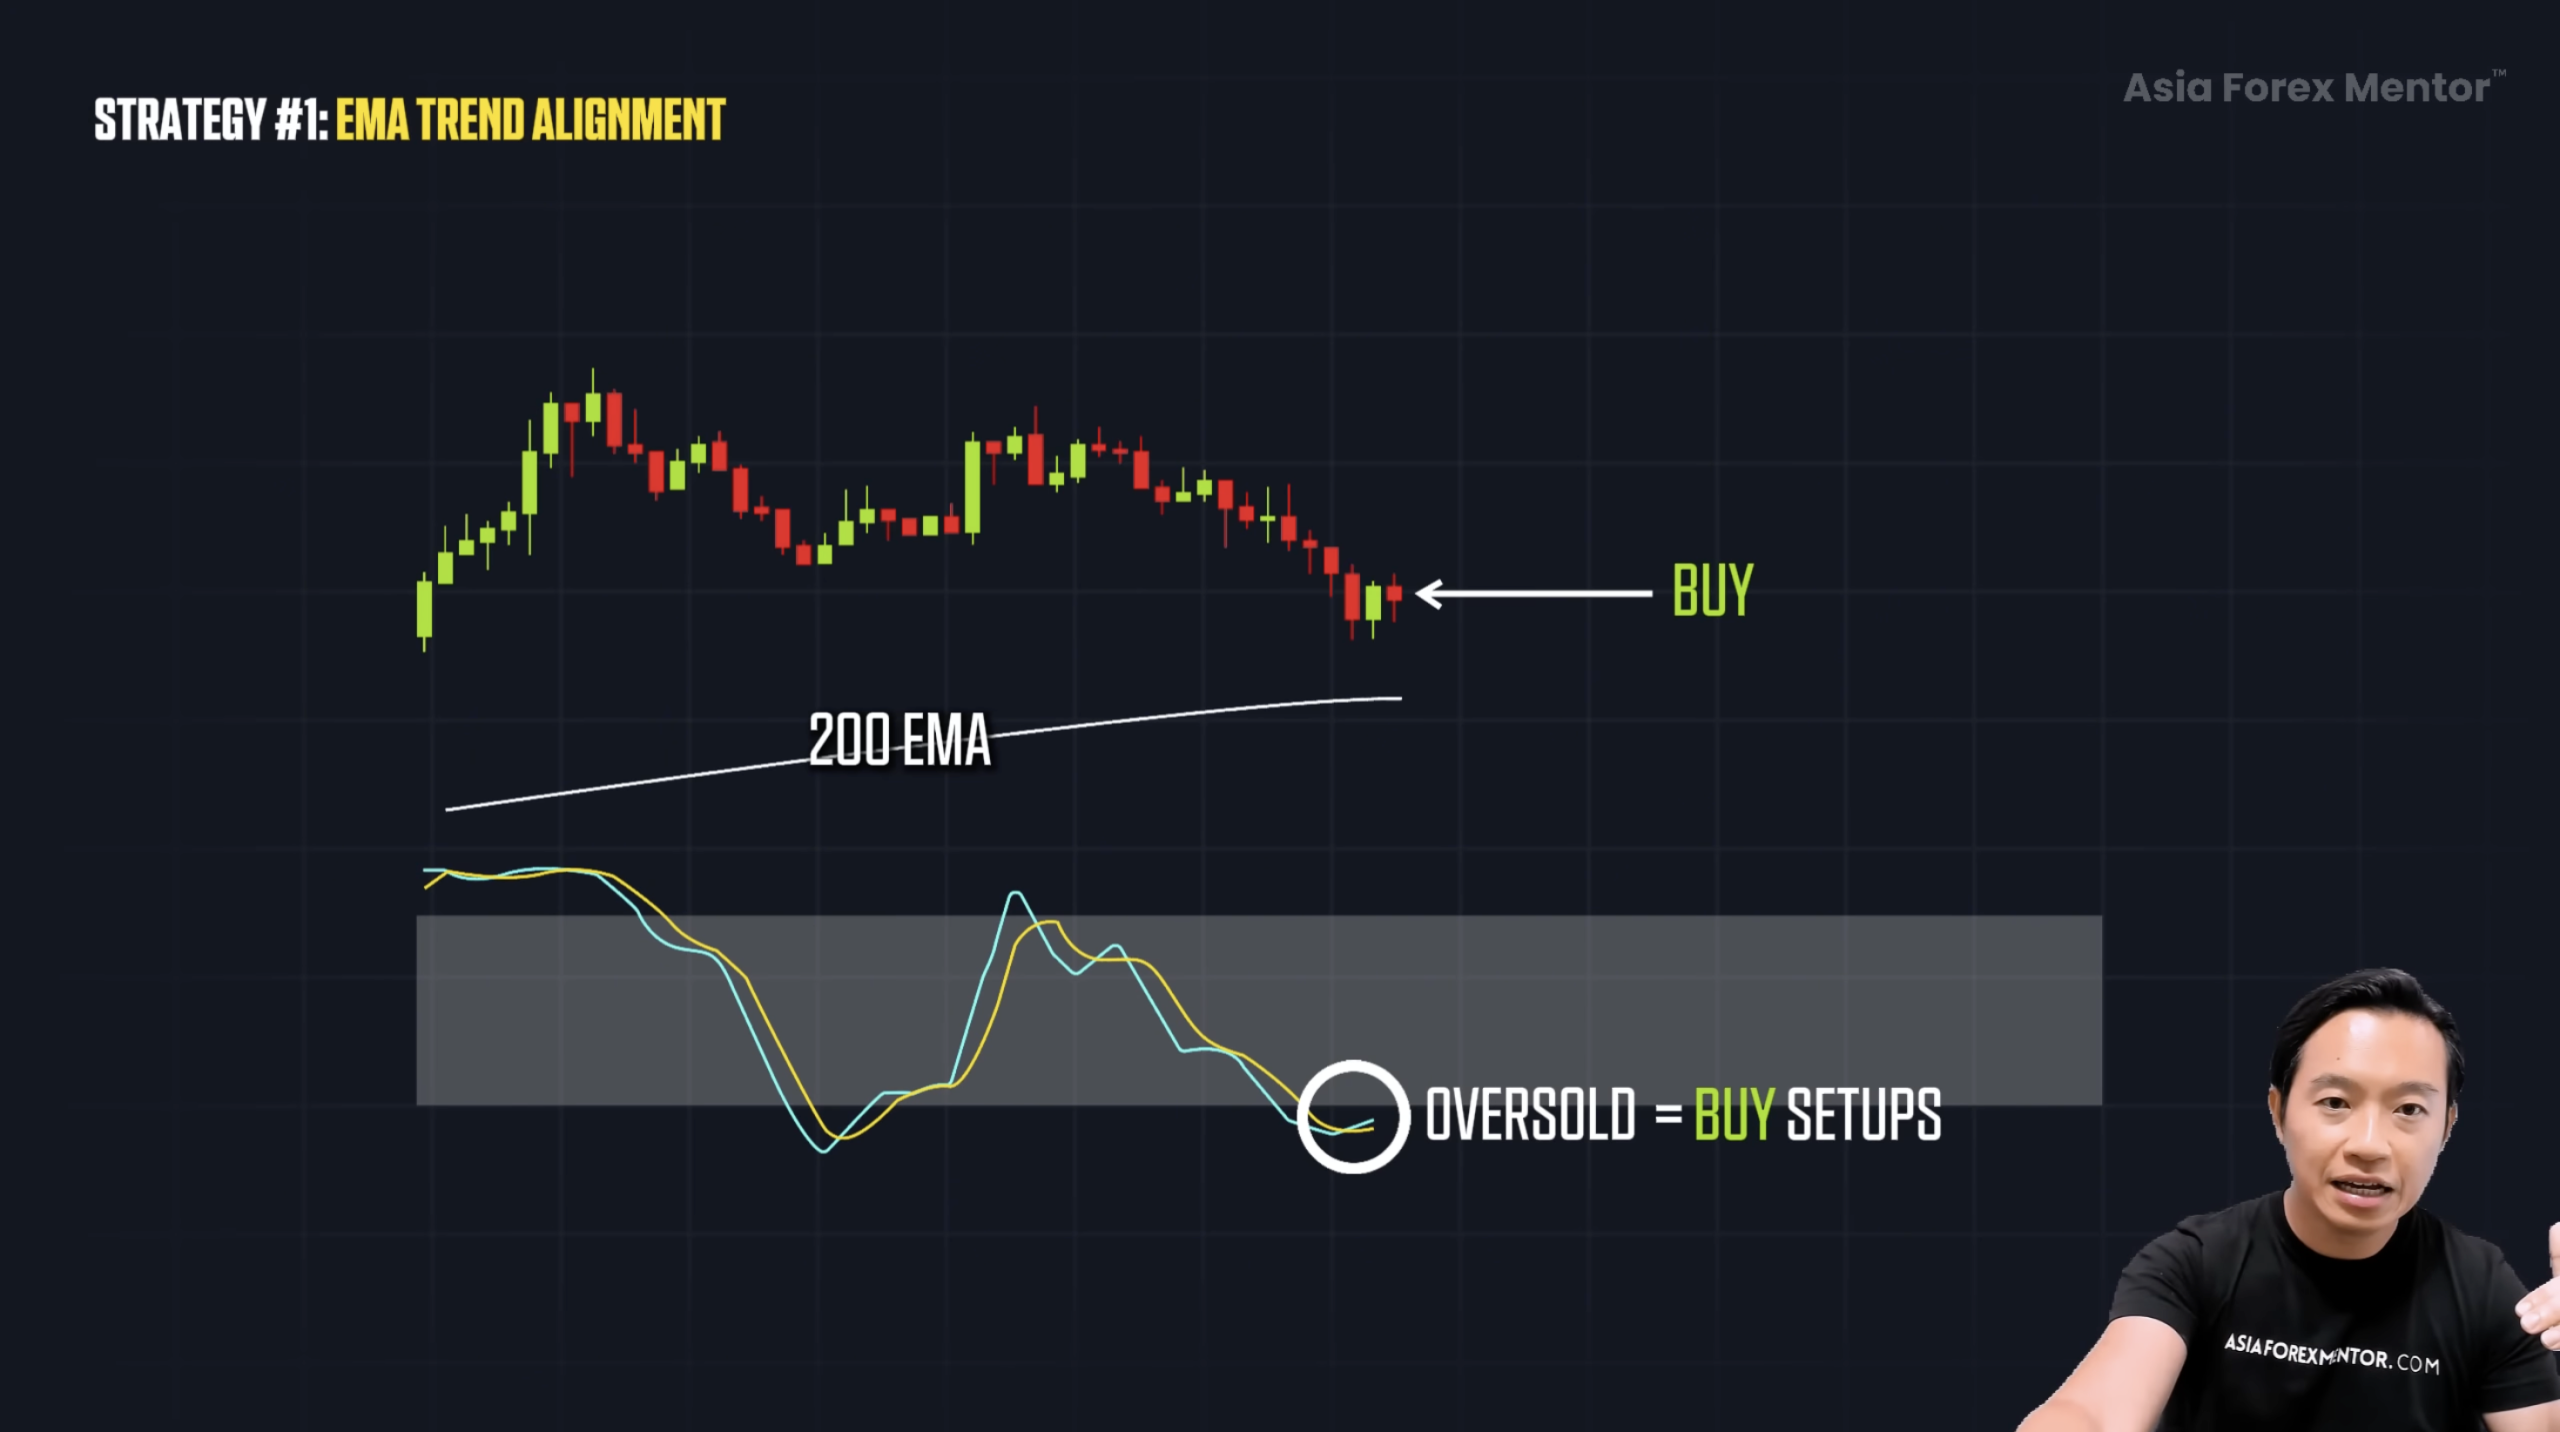
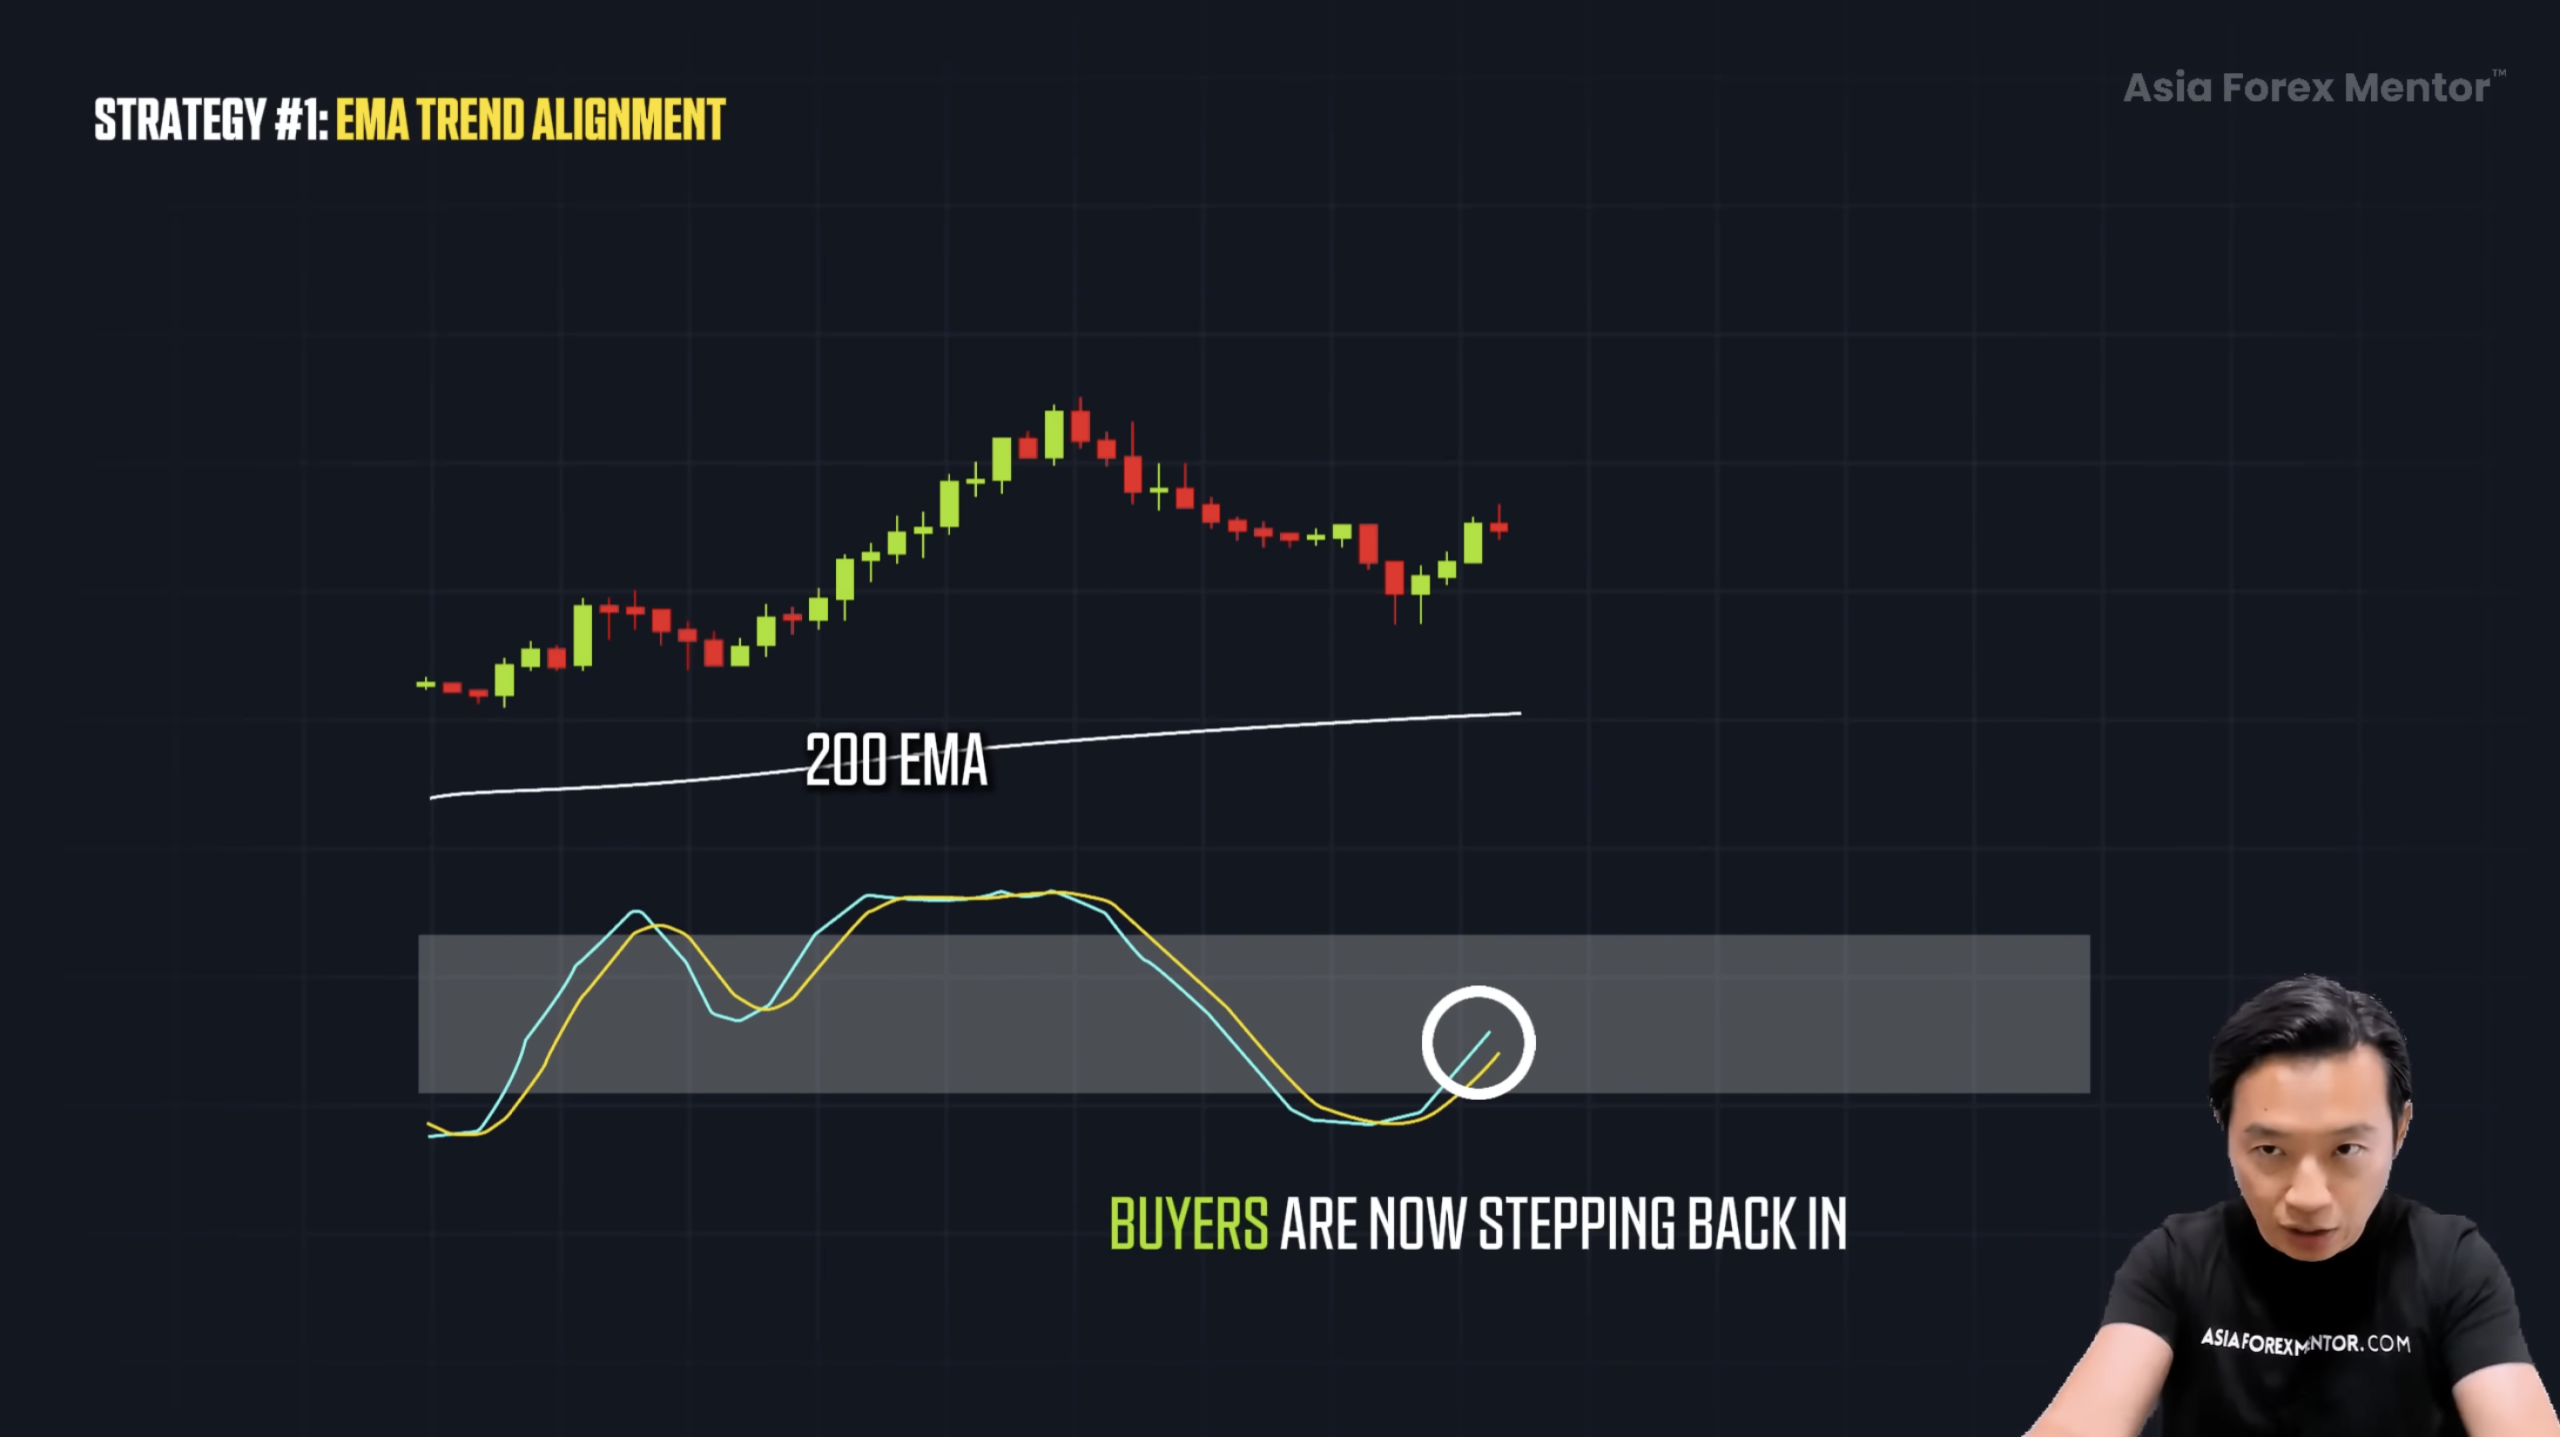
In a strong uptrend, the market can stay overbought for ages while price keeps climbing. That’s where most traders get it wrong. They see “overbought,” they panic, and they sell too early. But when the market is still trending, momentum is still fully in control.
Momentum alone is not enough. You need context. The 200 EMA gives you that.
If the price is above the 200 EMA and the stochastic is in oversold territory, that’s when I start looking for buy setups.
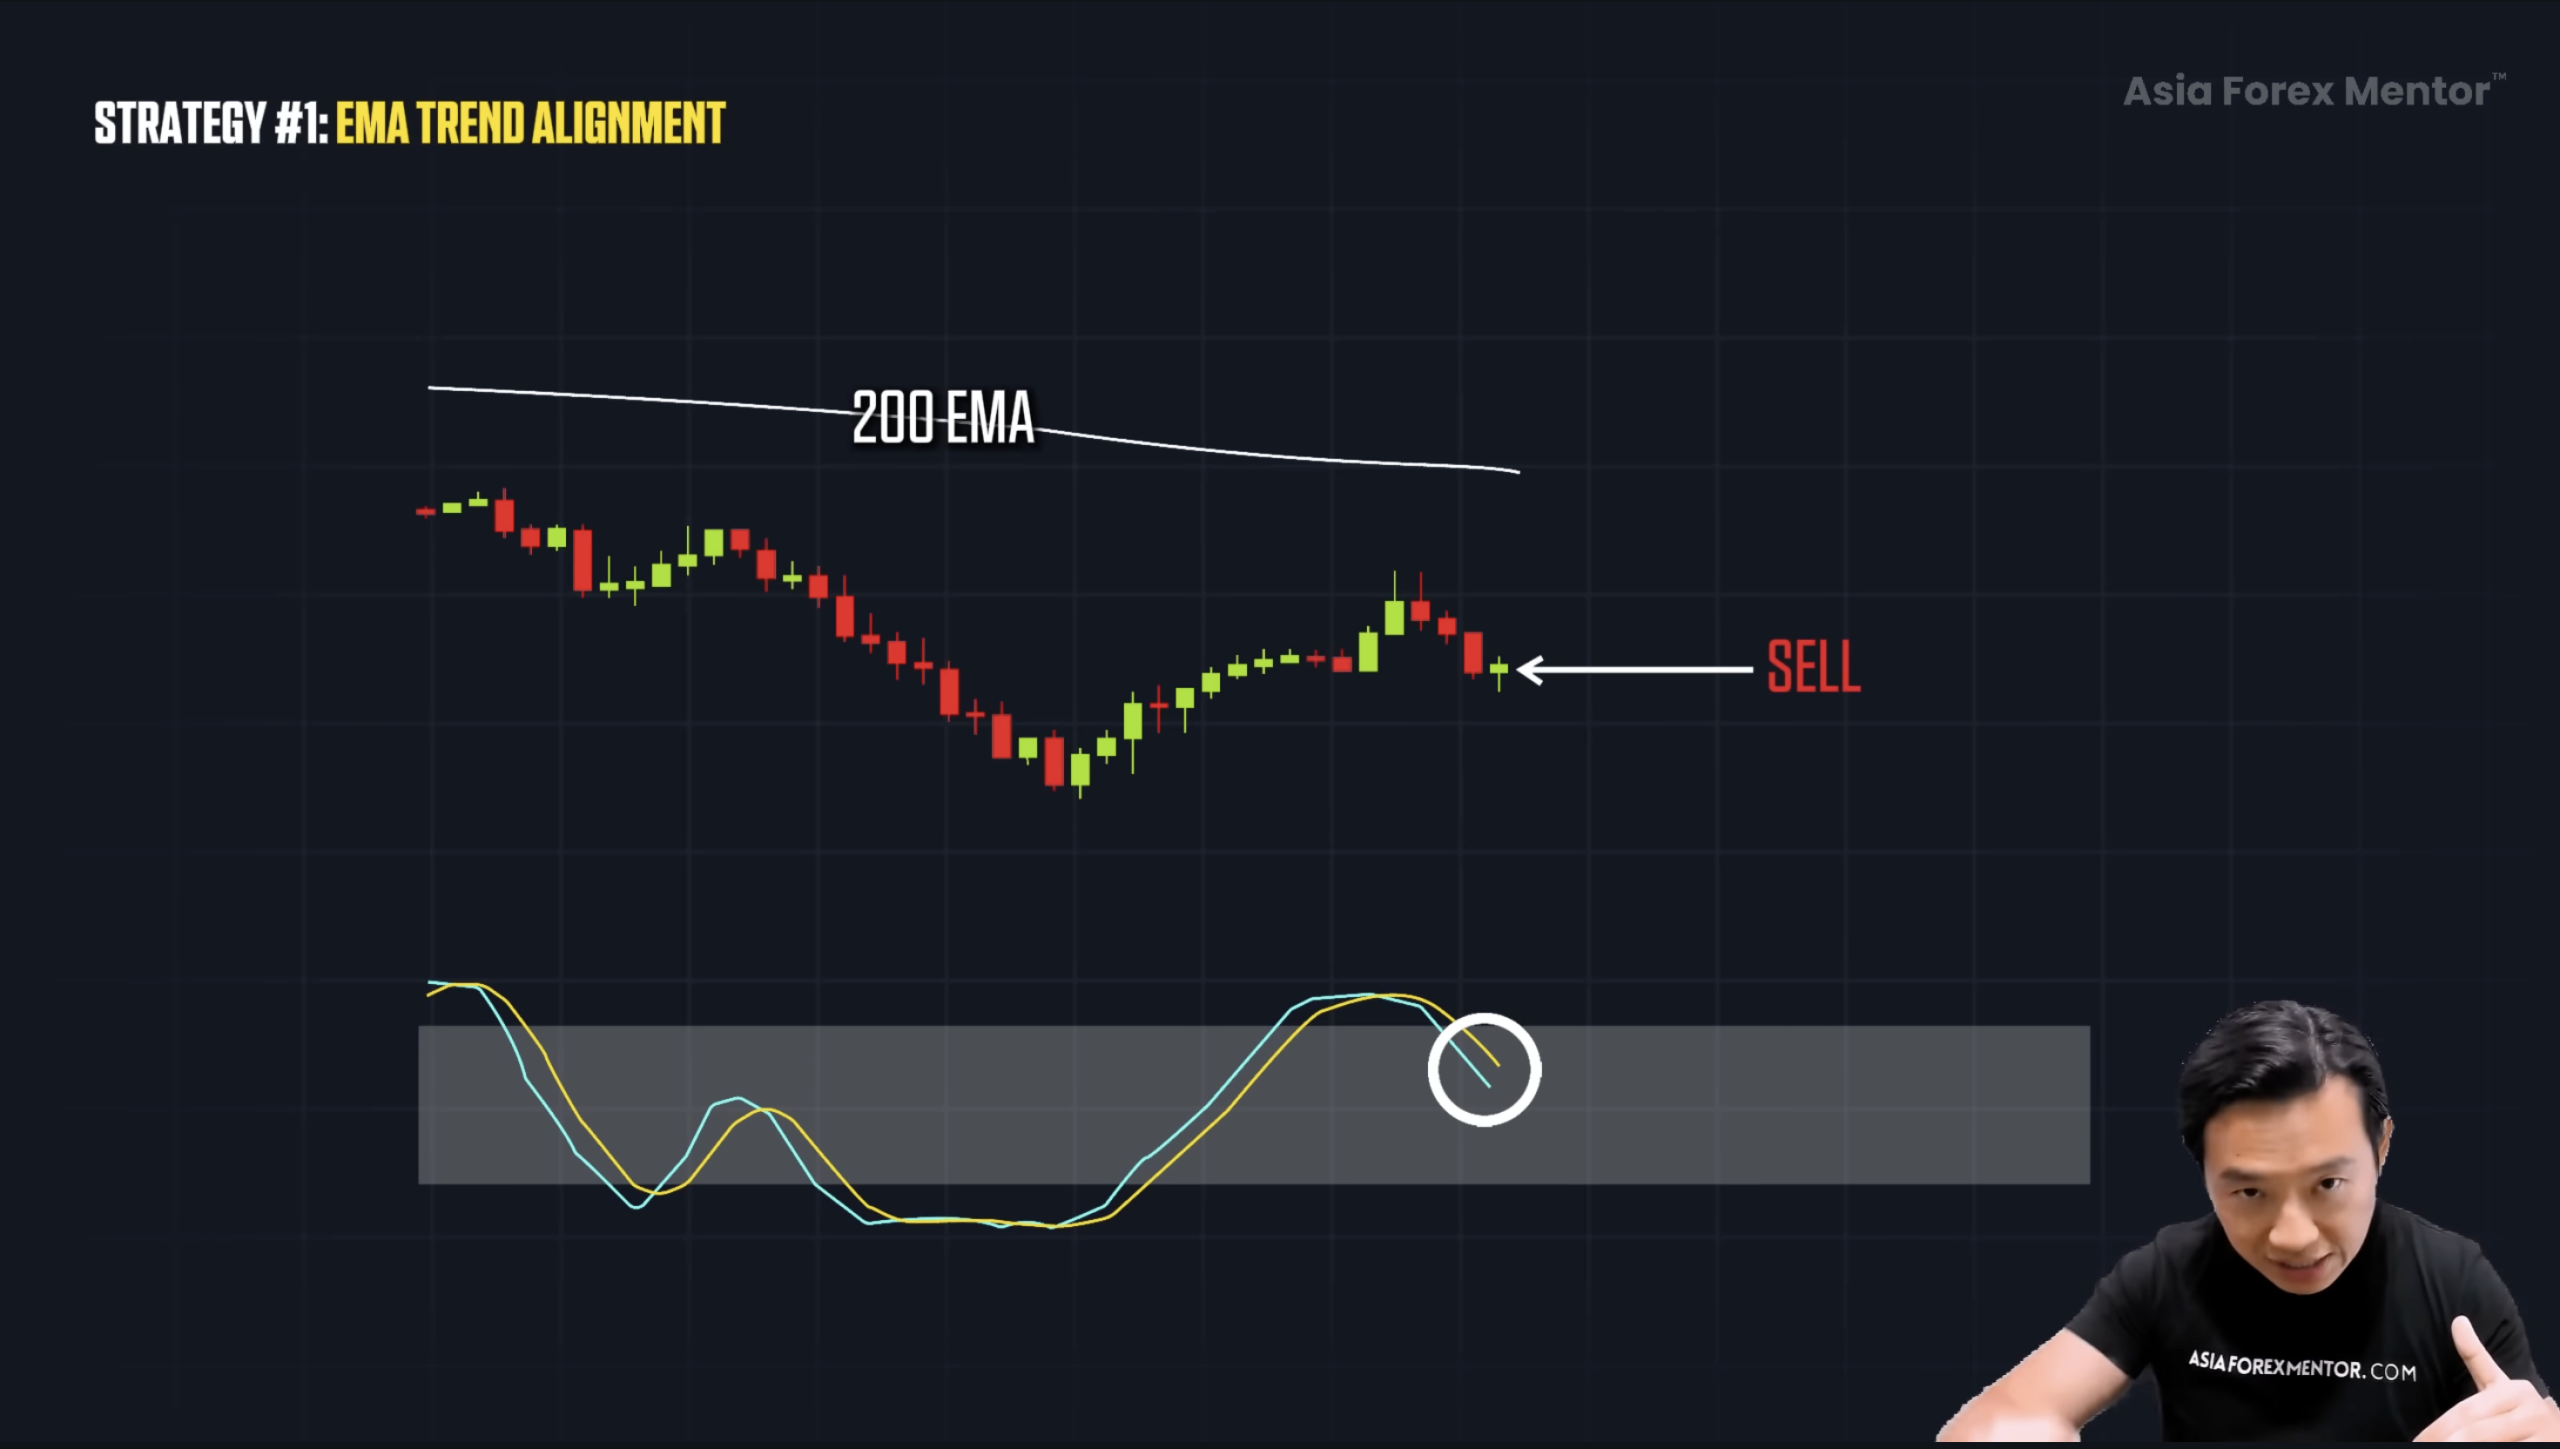
While if the price is below the 200 EMA and the stochastic is in overbought territory, that’s when I start looking for sell setups.
It’s that simple, and it instantly removes half of the bad trades.
Common Mistakes Traders Make
The big mistake is jumping in too early. When the stochastic dips into oversold during an uptrend, don't rush. Wait for the lines to cross back inside the zone. That crossing is your green light that buyers are stepping back in.
Same for a sell setup, wait for the stochastic to cool off at the overbought zone and catch the cross downward.
How To Apply It
- Identify the trend using the 200 EMA.
- Only buy above the 200 EMA when stochastic recovers from oversold.
- Only sell below the 200 EMA when stochastic turns down from overbought.
- Wait for the stochastic cross, that’s your confirmation.
Momentum and trend are two sides of the same story. Use both, and you stop taking trades that fight the market flow.
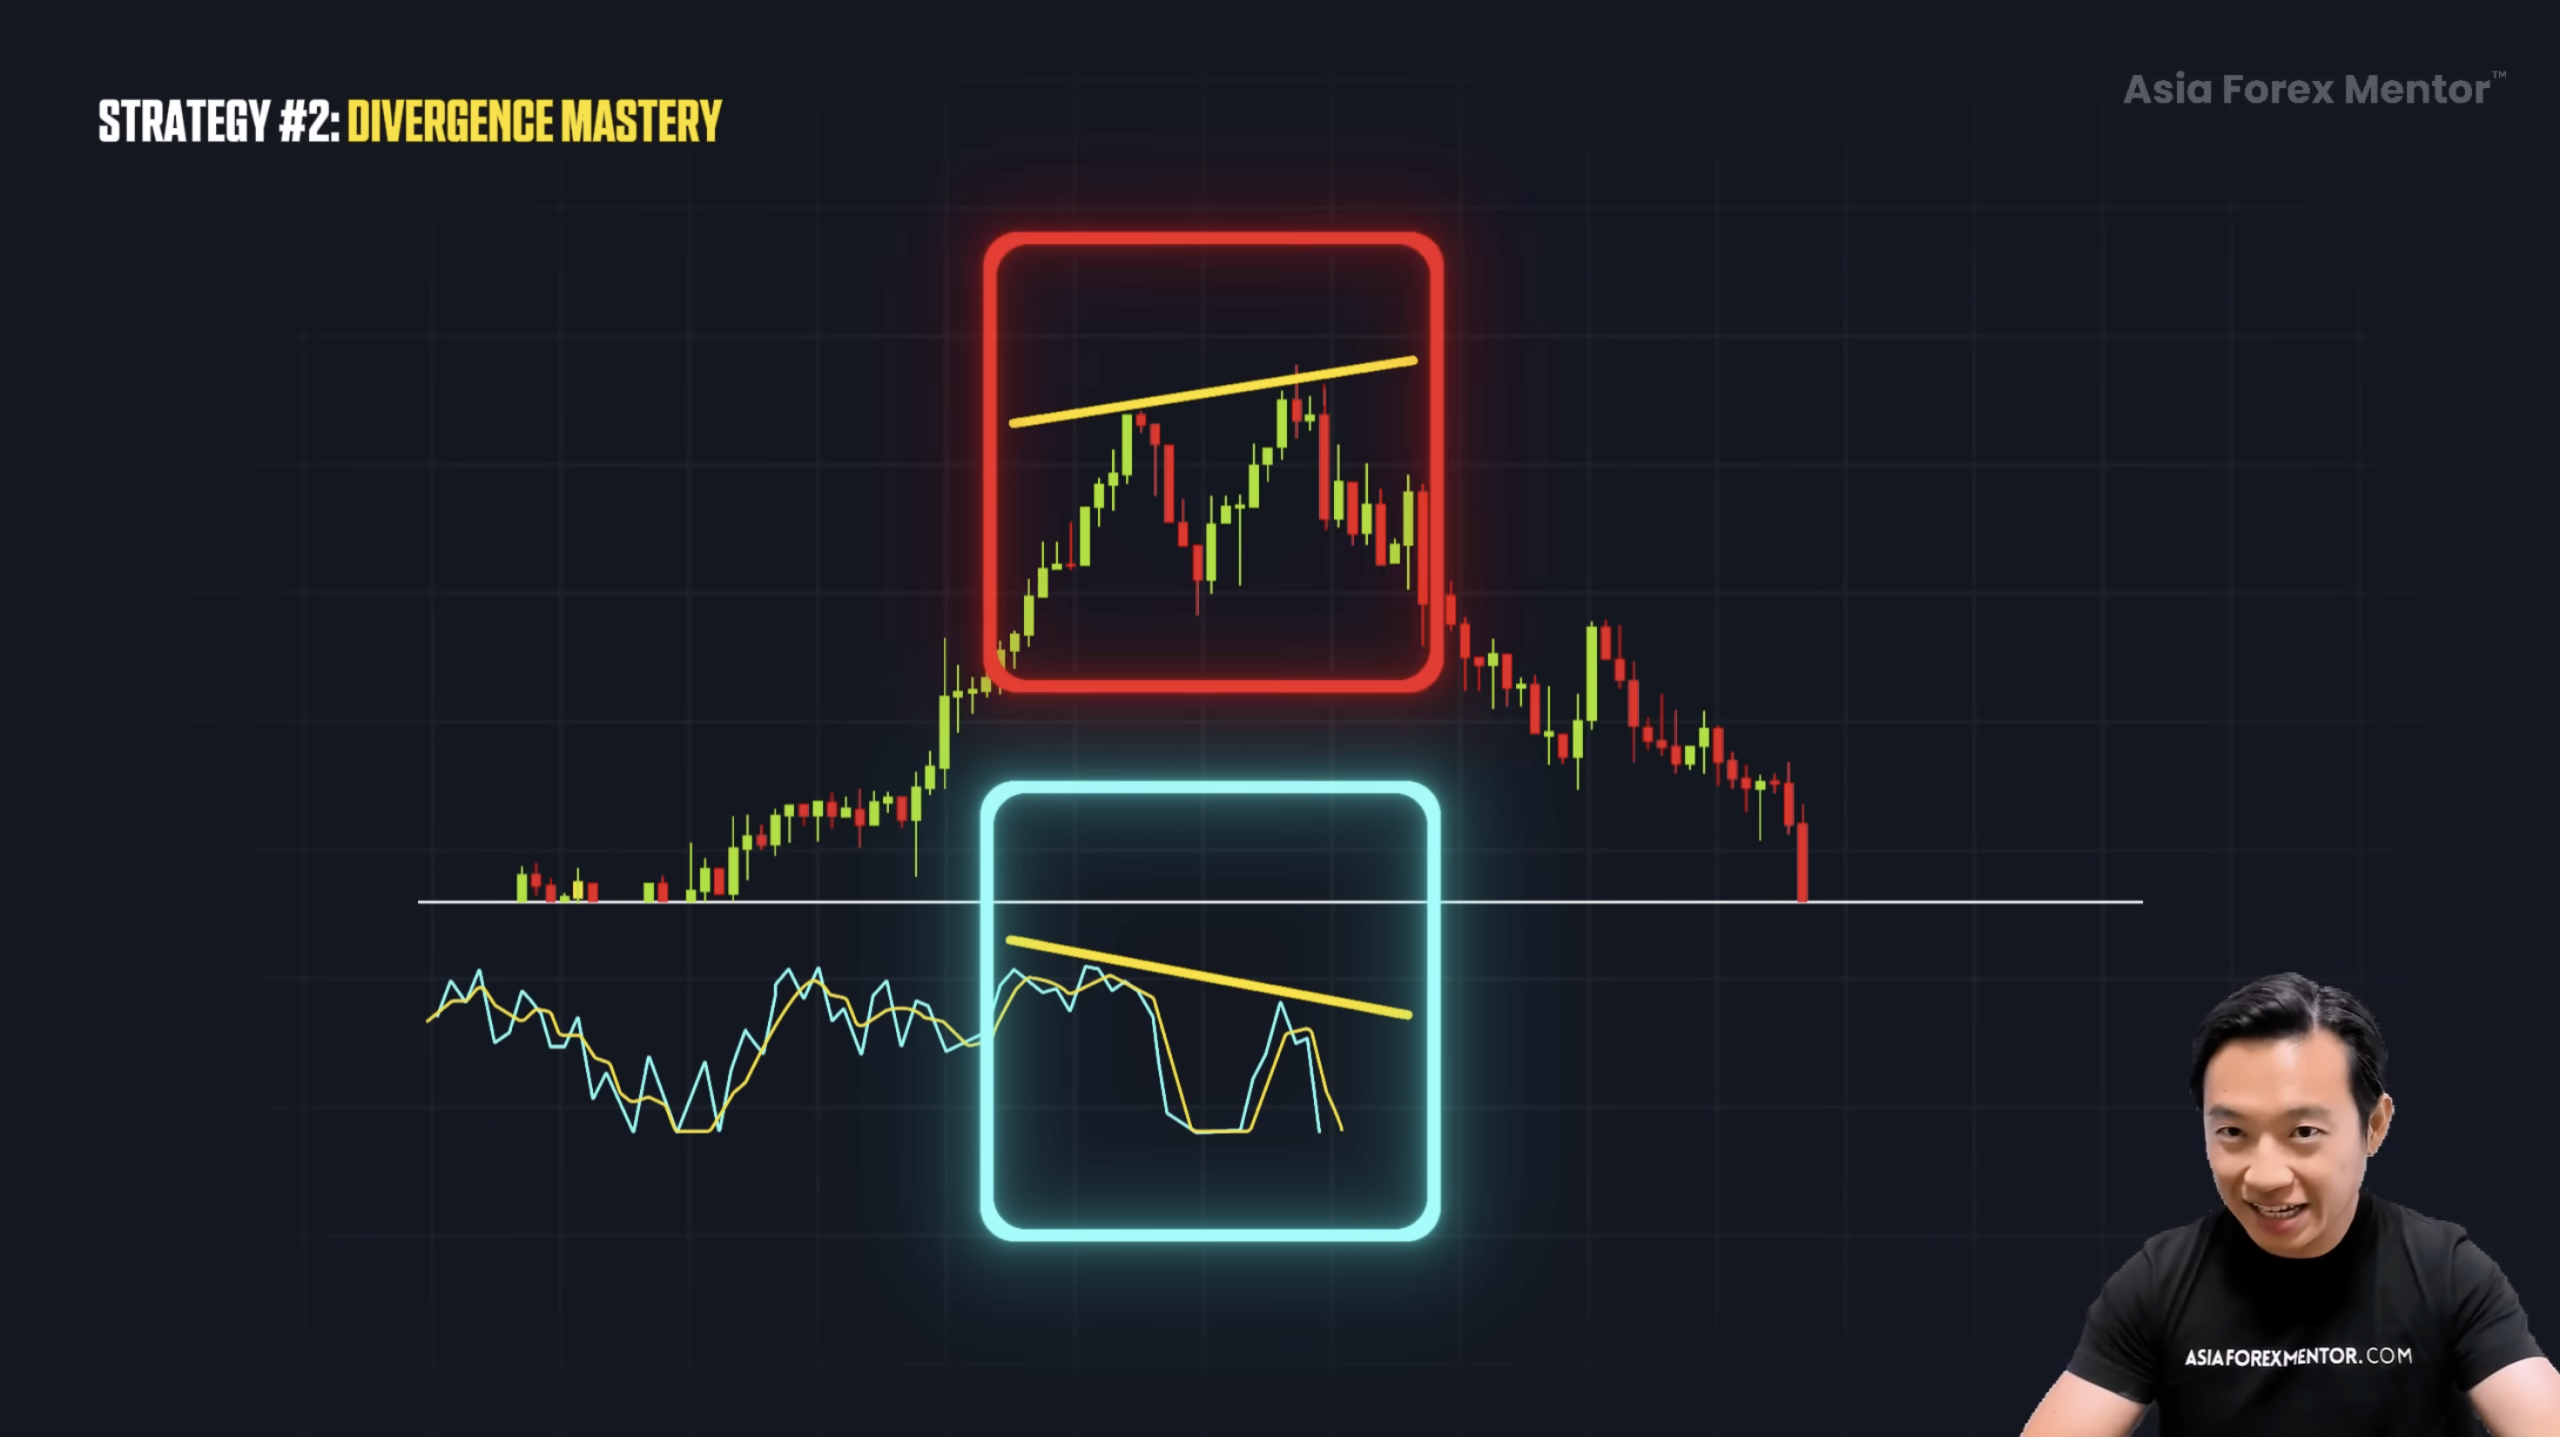
Strategy 2 – Divergence Mastery With the Stochastic Oscillator
This is where you learn how to read the argument between price and momentum. When they disagree, that disagreement is called divergence, and it can reveal early reversals or trend continuation long before the crowd sees it.
How It Works
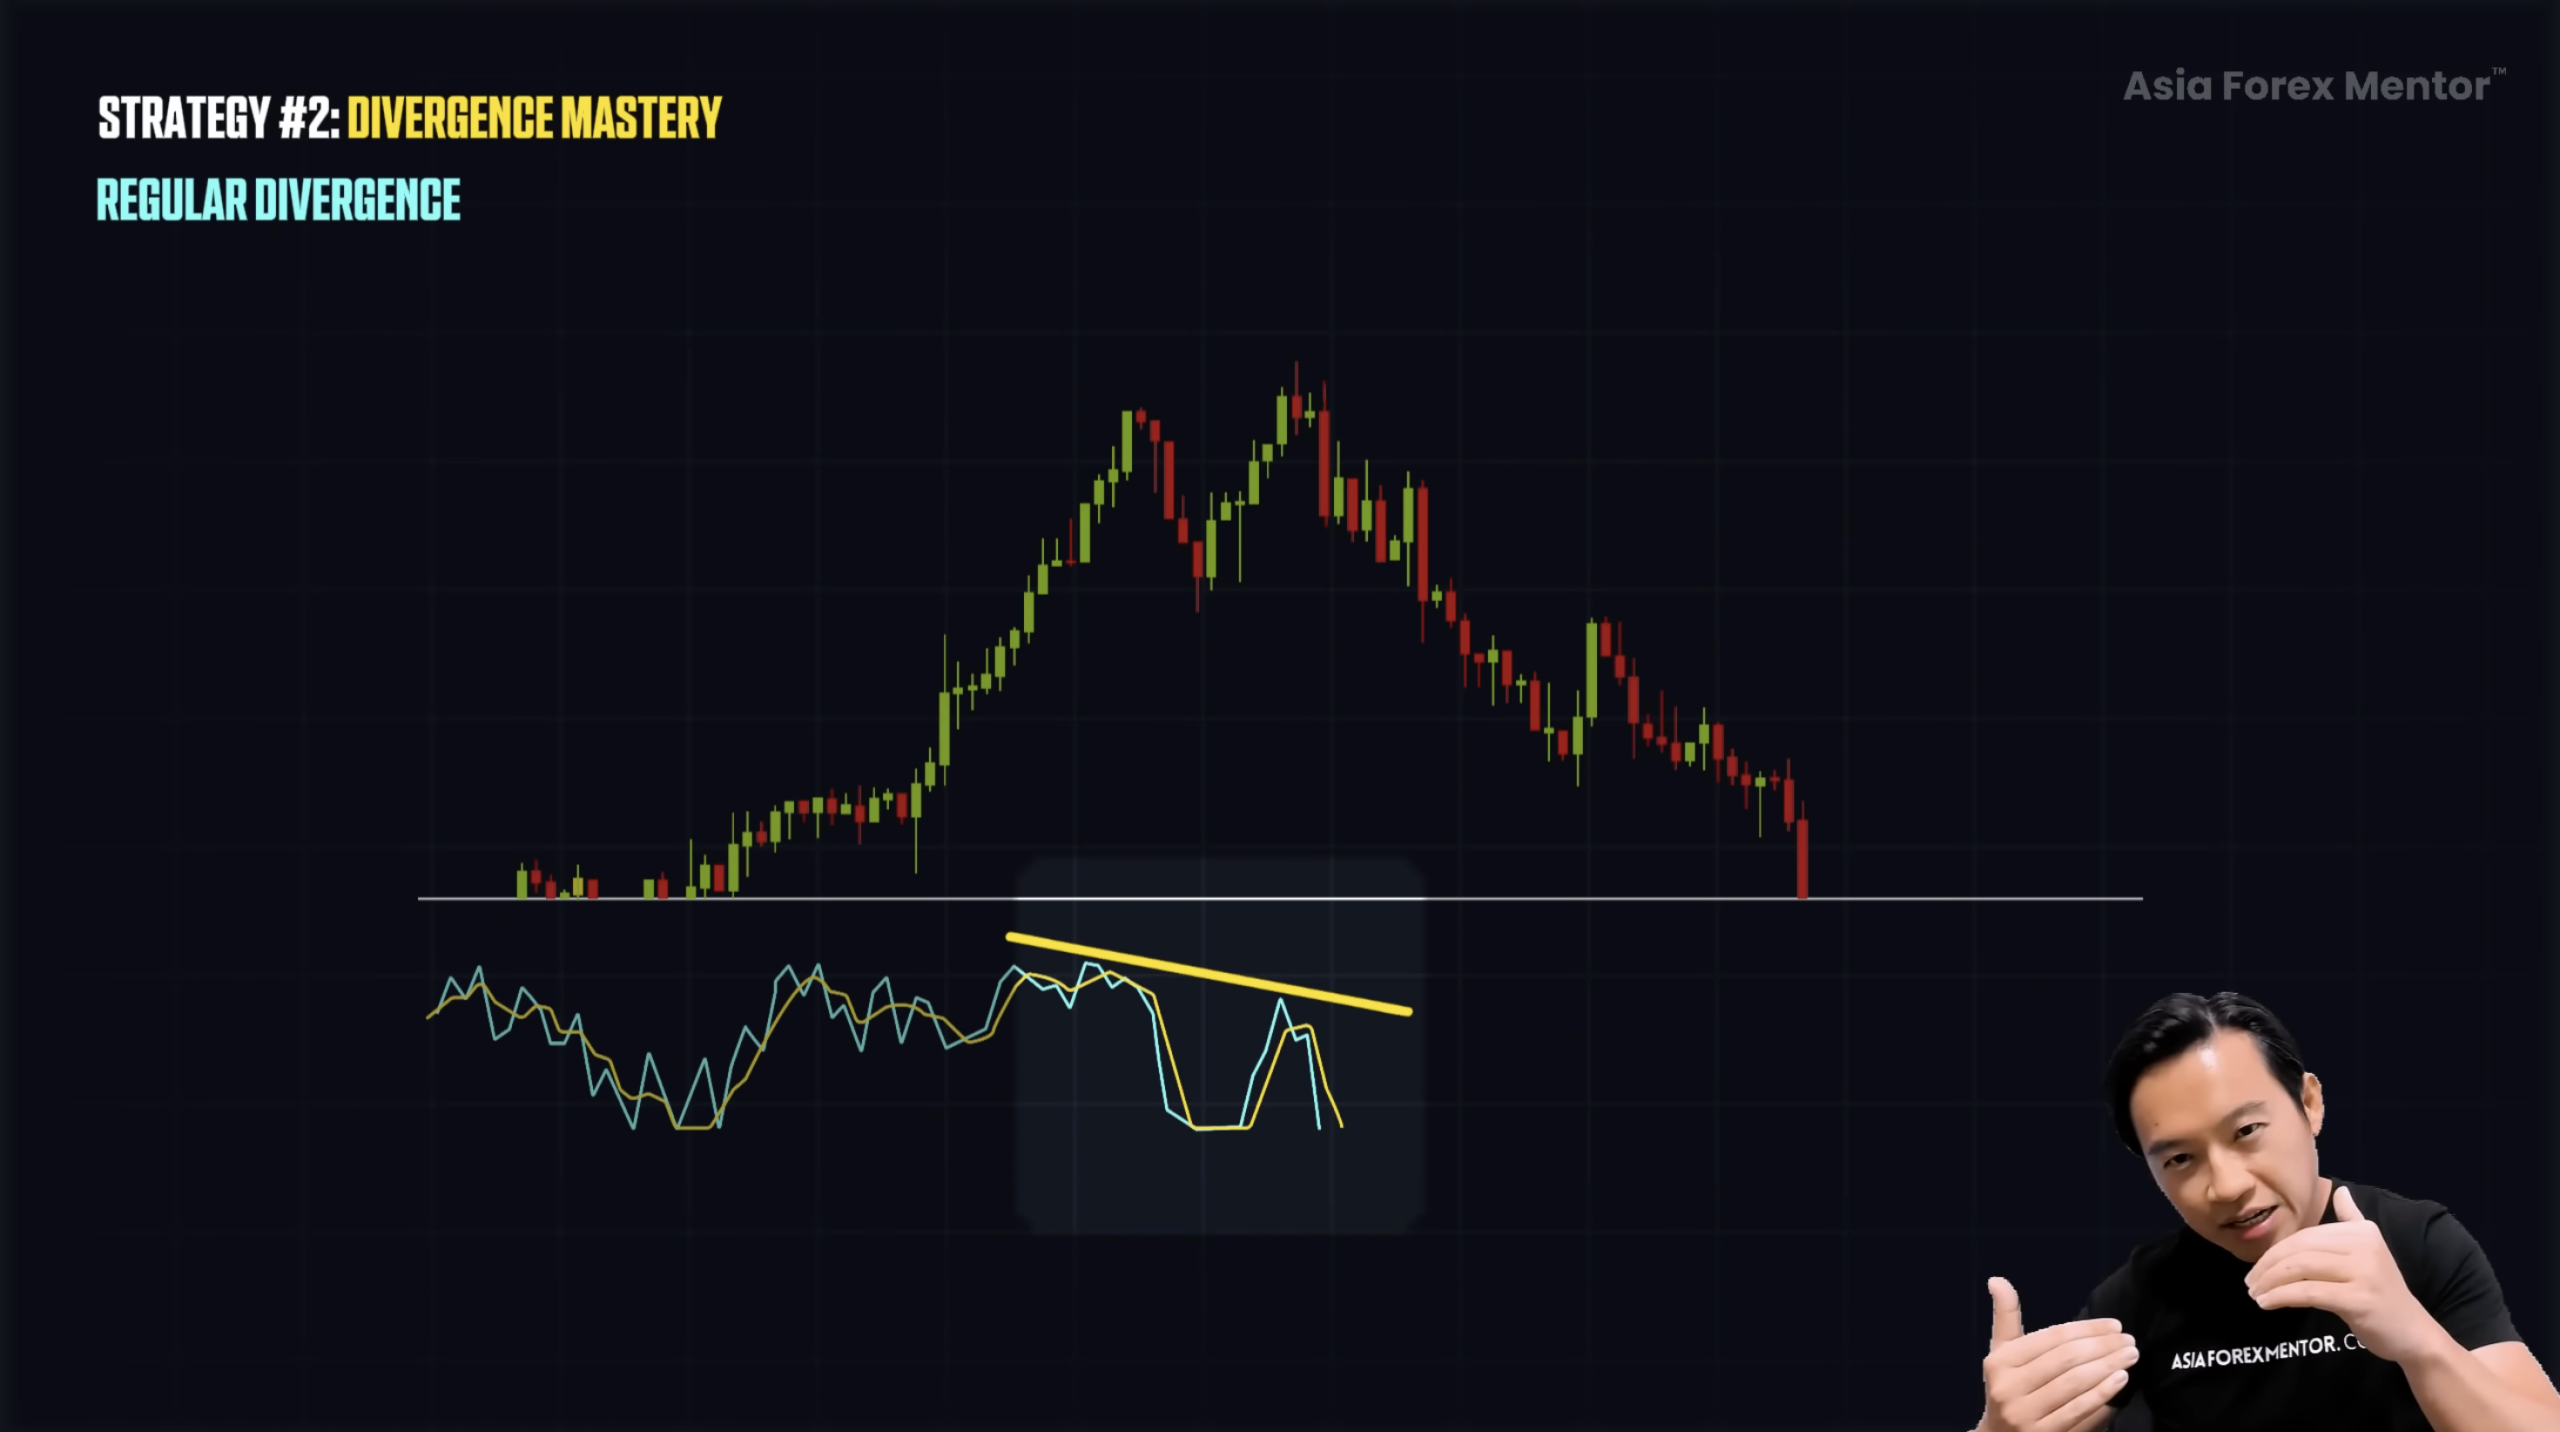
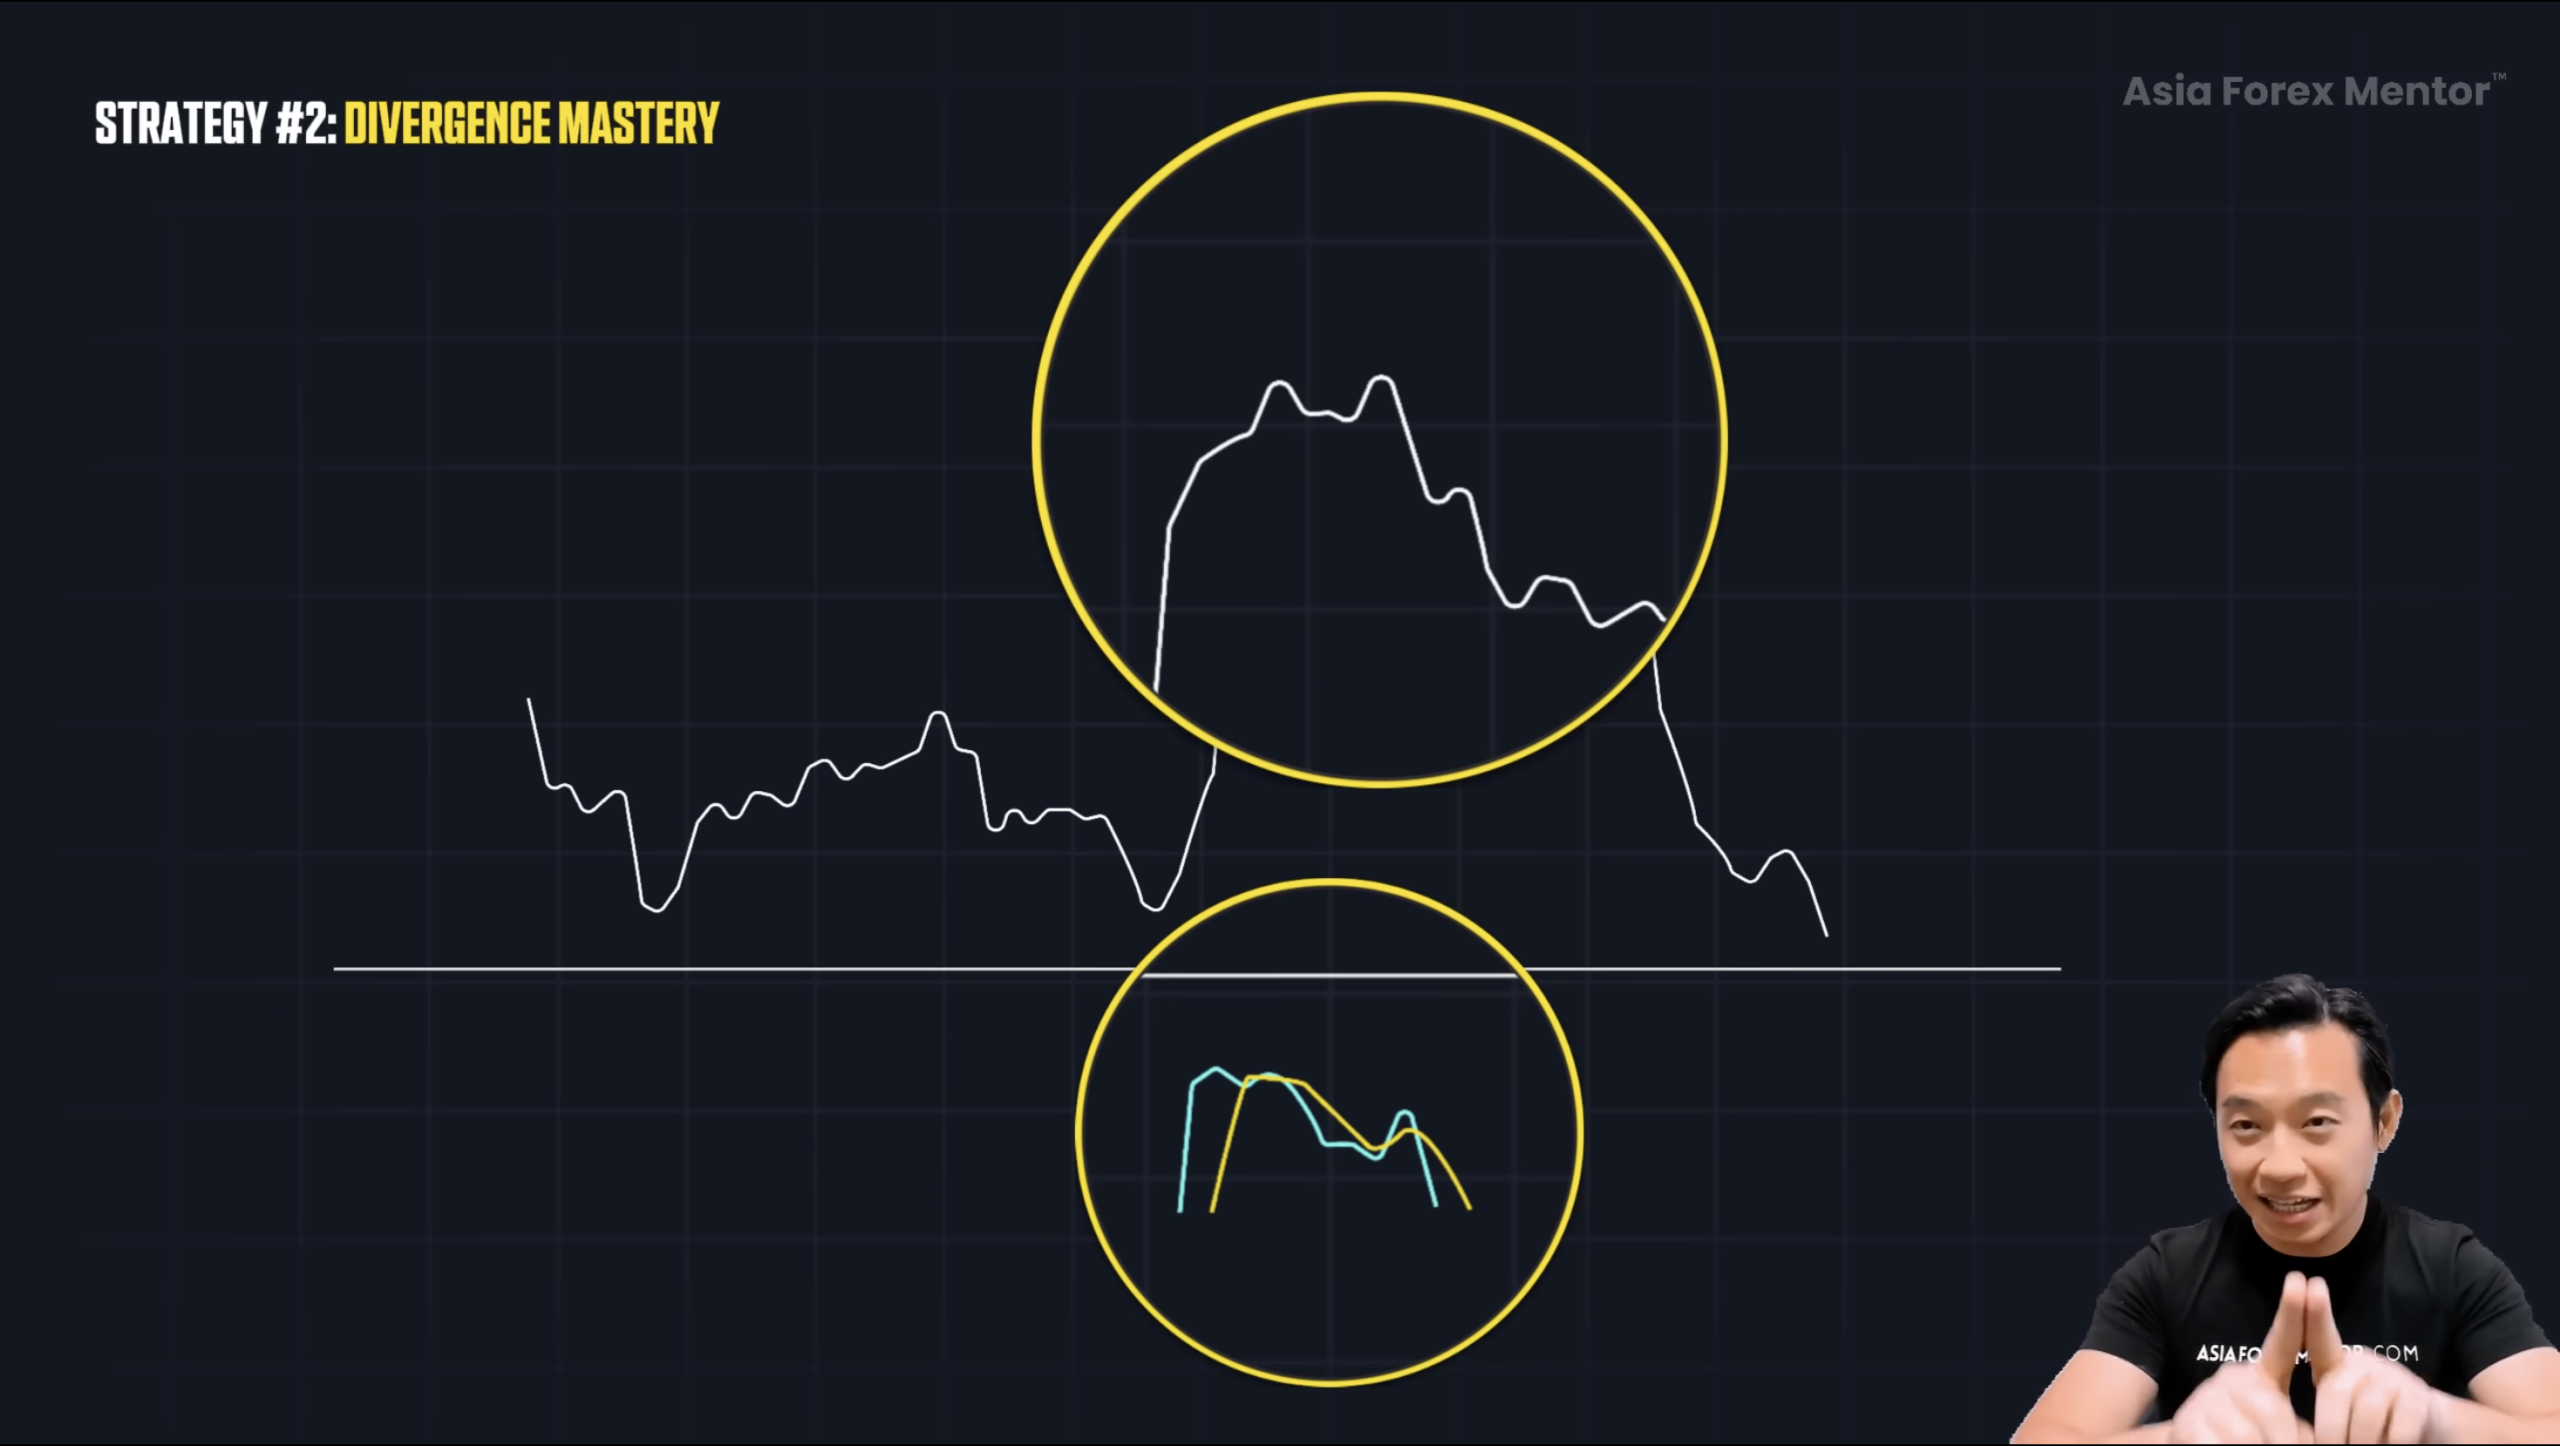
When price forms higher highs but the stochastic forms lower highs, something is off. That’s regular divergence. It usually appears at the end of an uptrend, price keeps climbing but the stochastic fails to follow and starts dipping.
That’s a clue that market energy is running out.
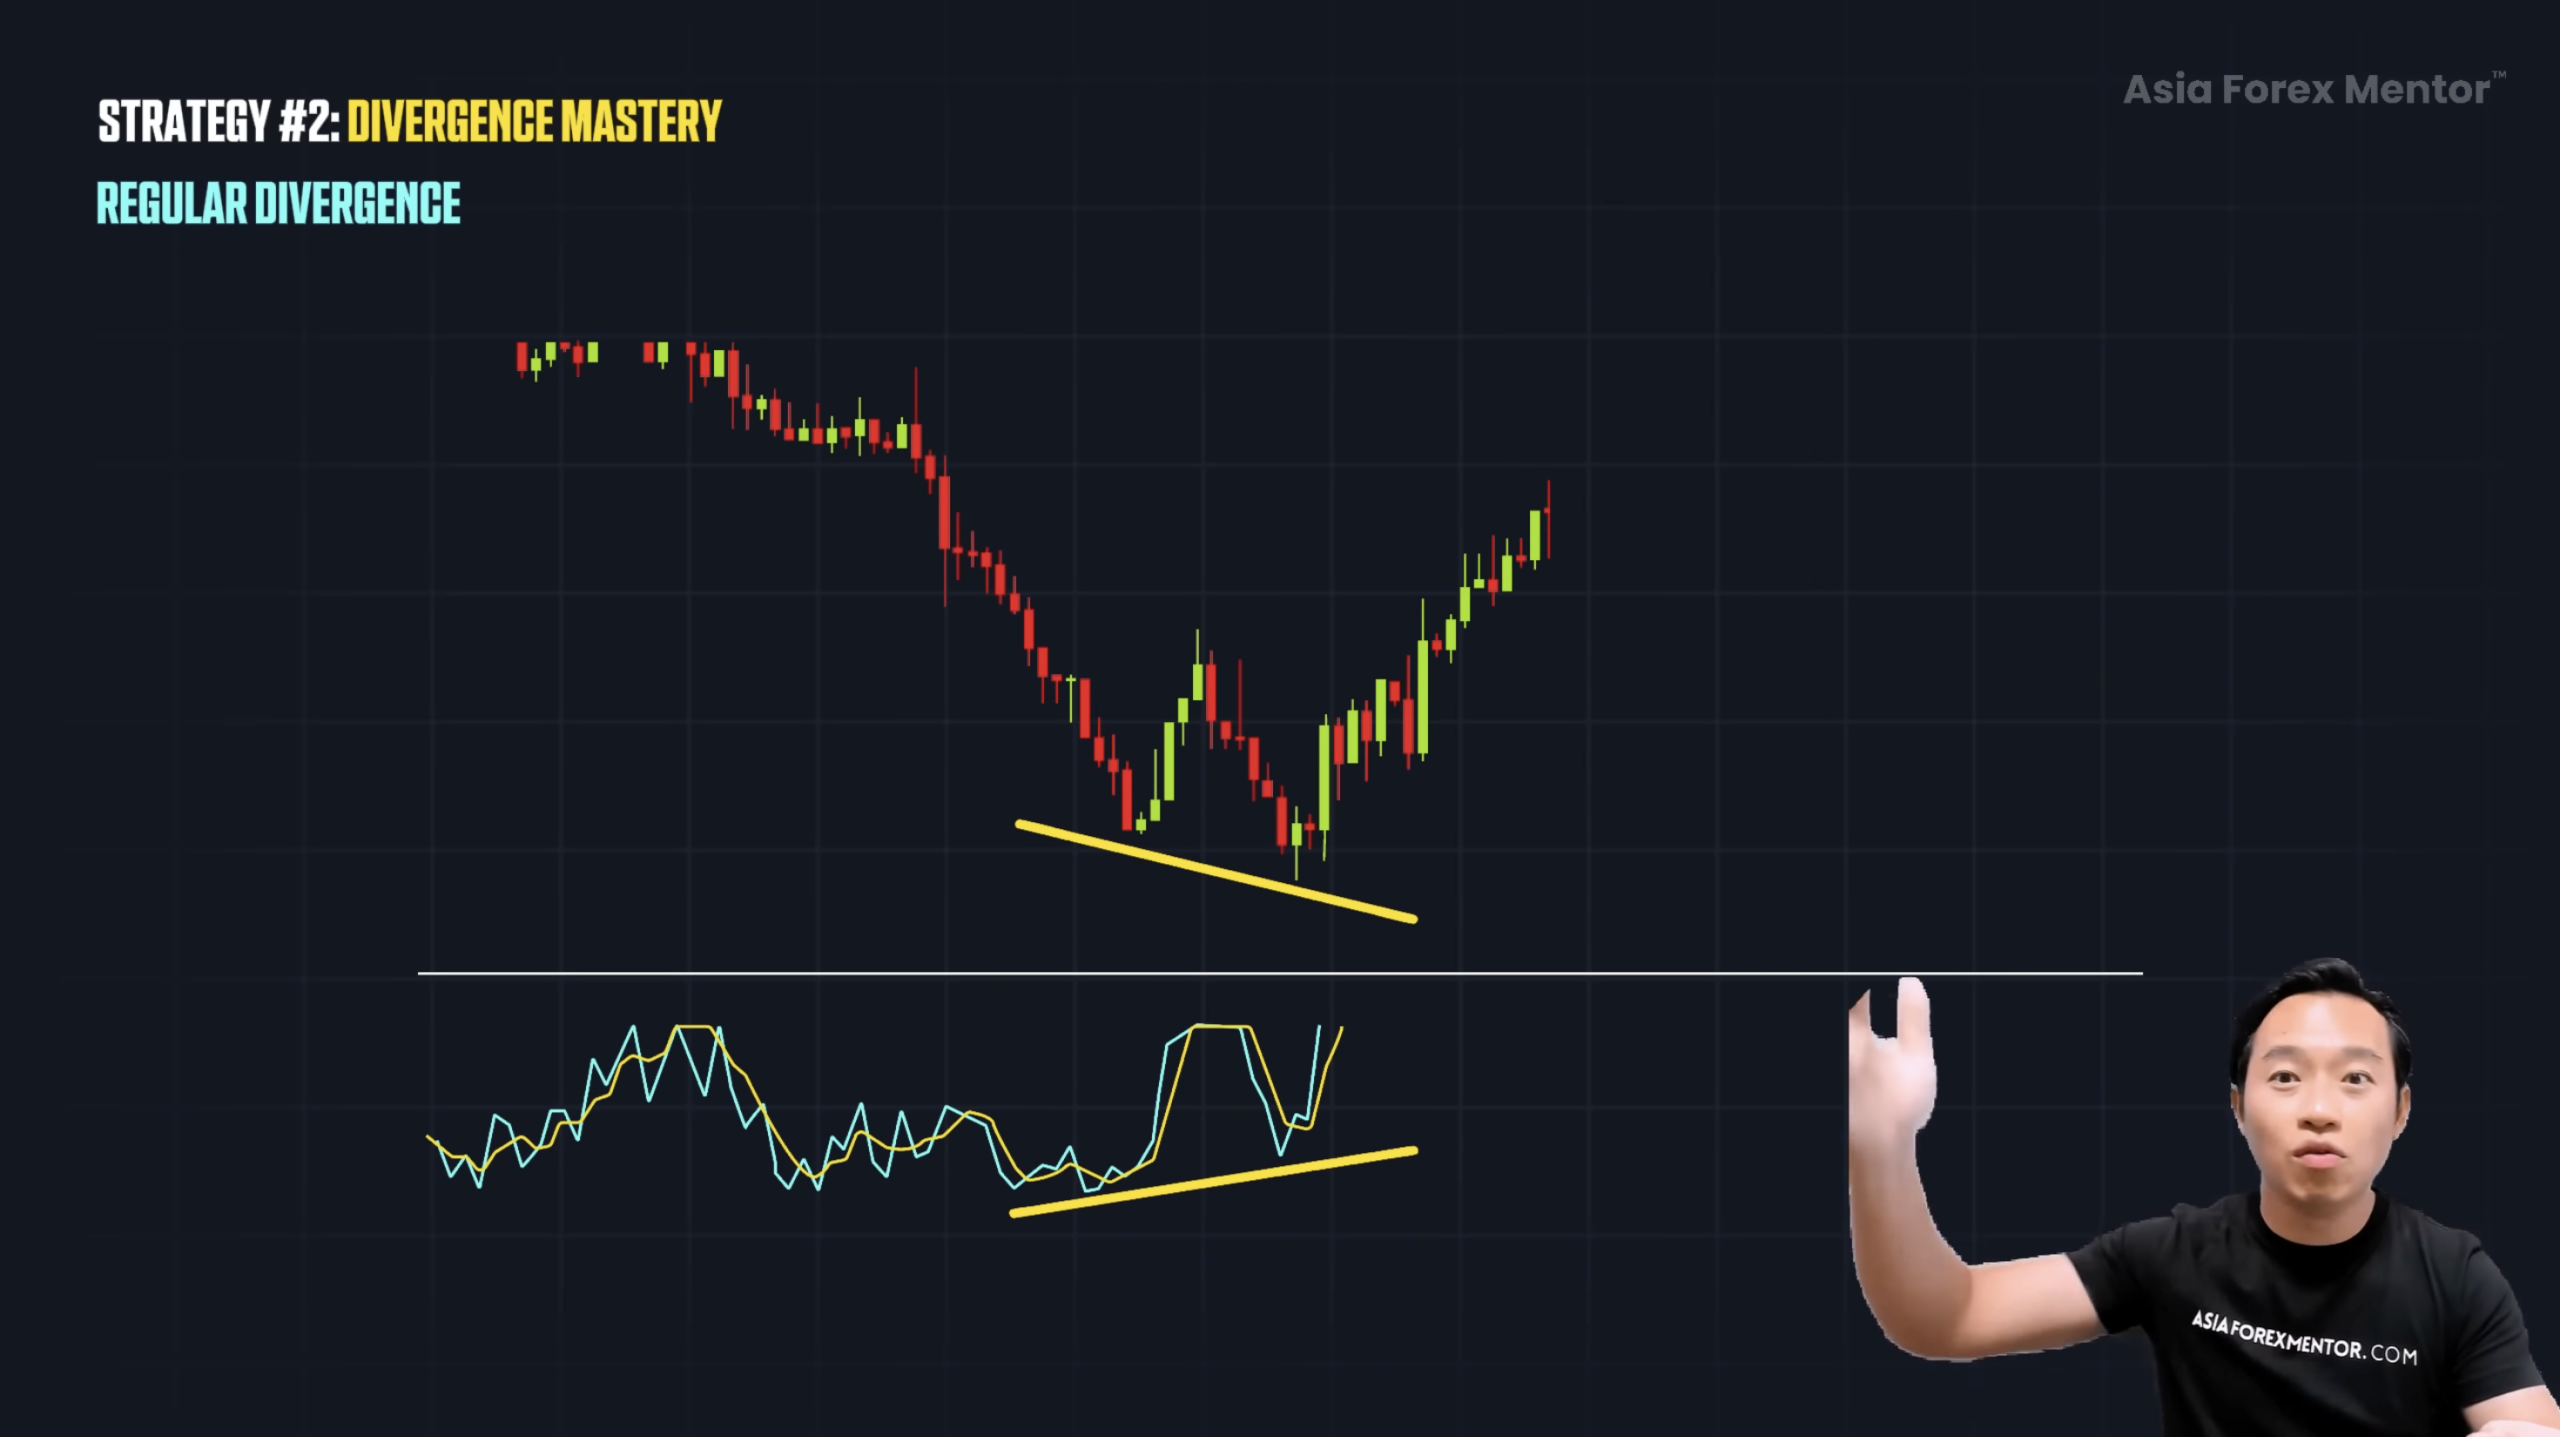
In a downtrend, if price makes lower lows but the stochastic rises, that’s also regular divergence, signaling a potential bullish reversal.
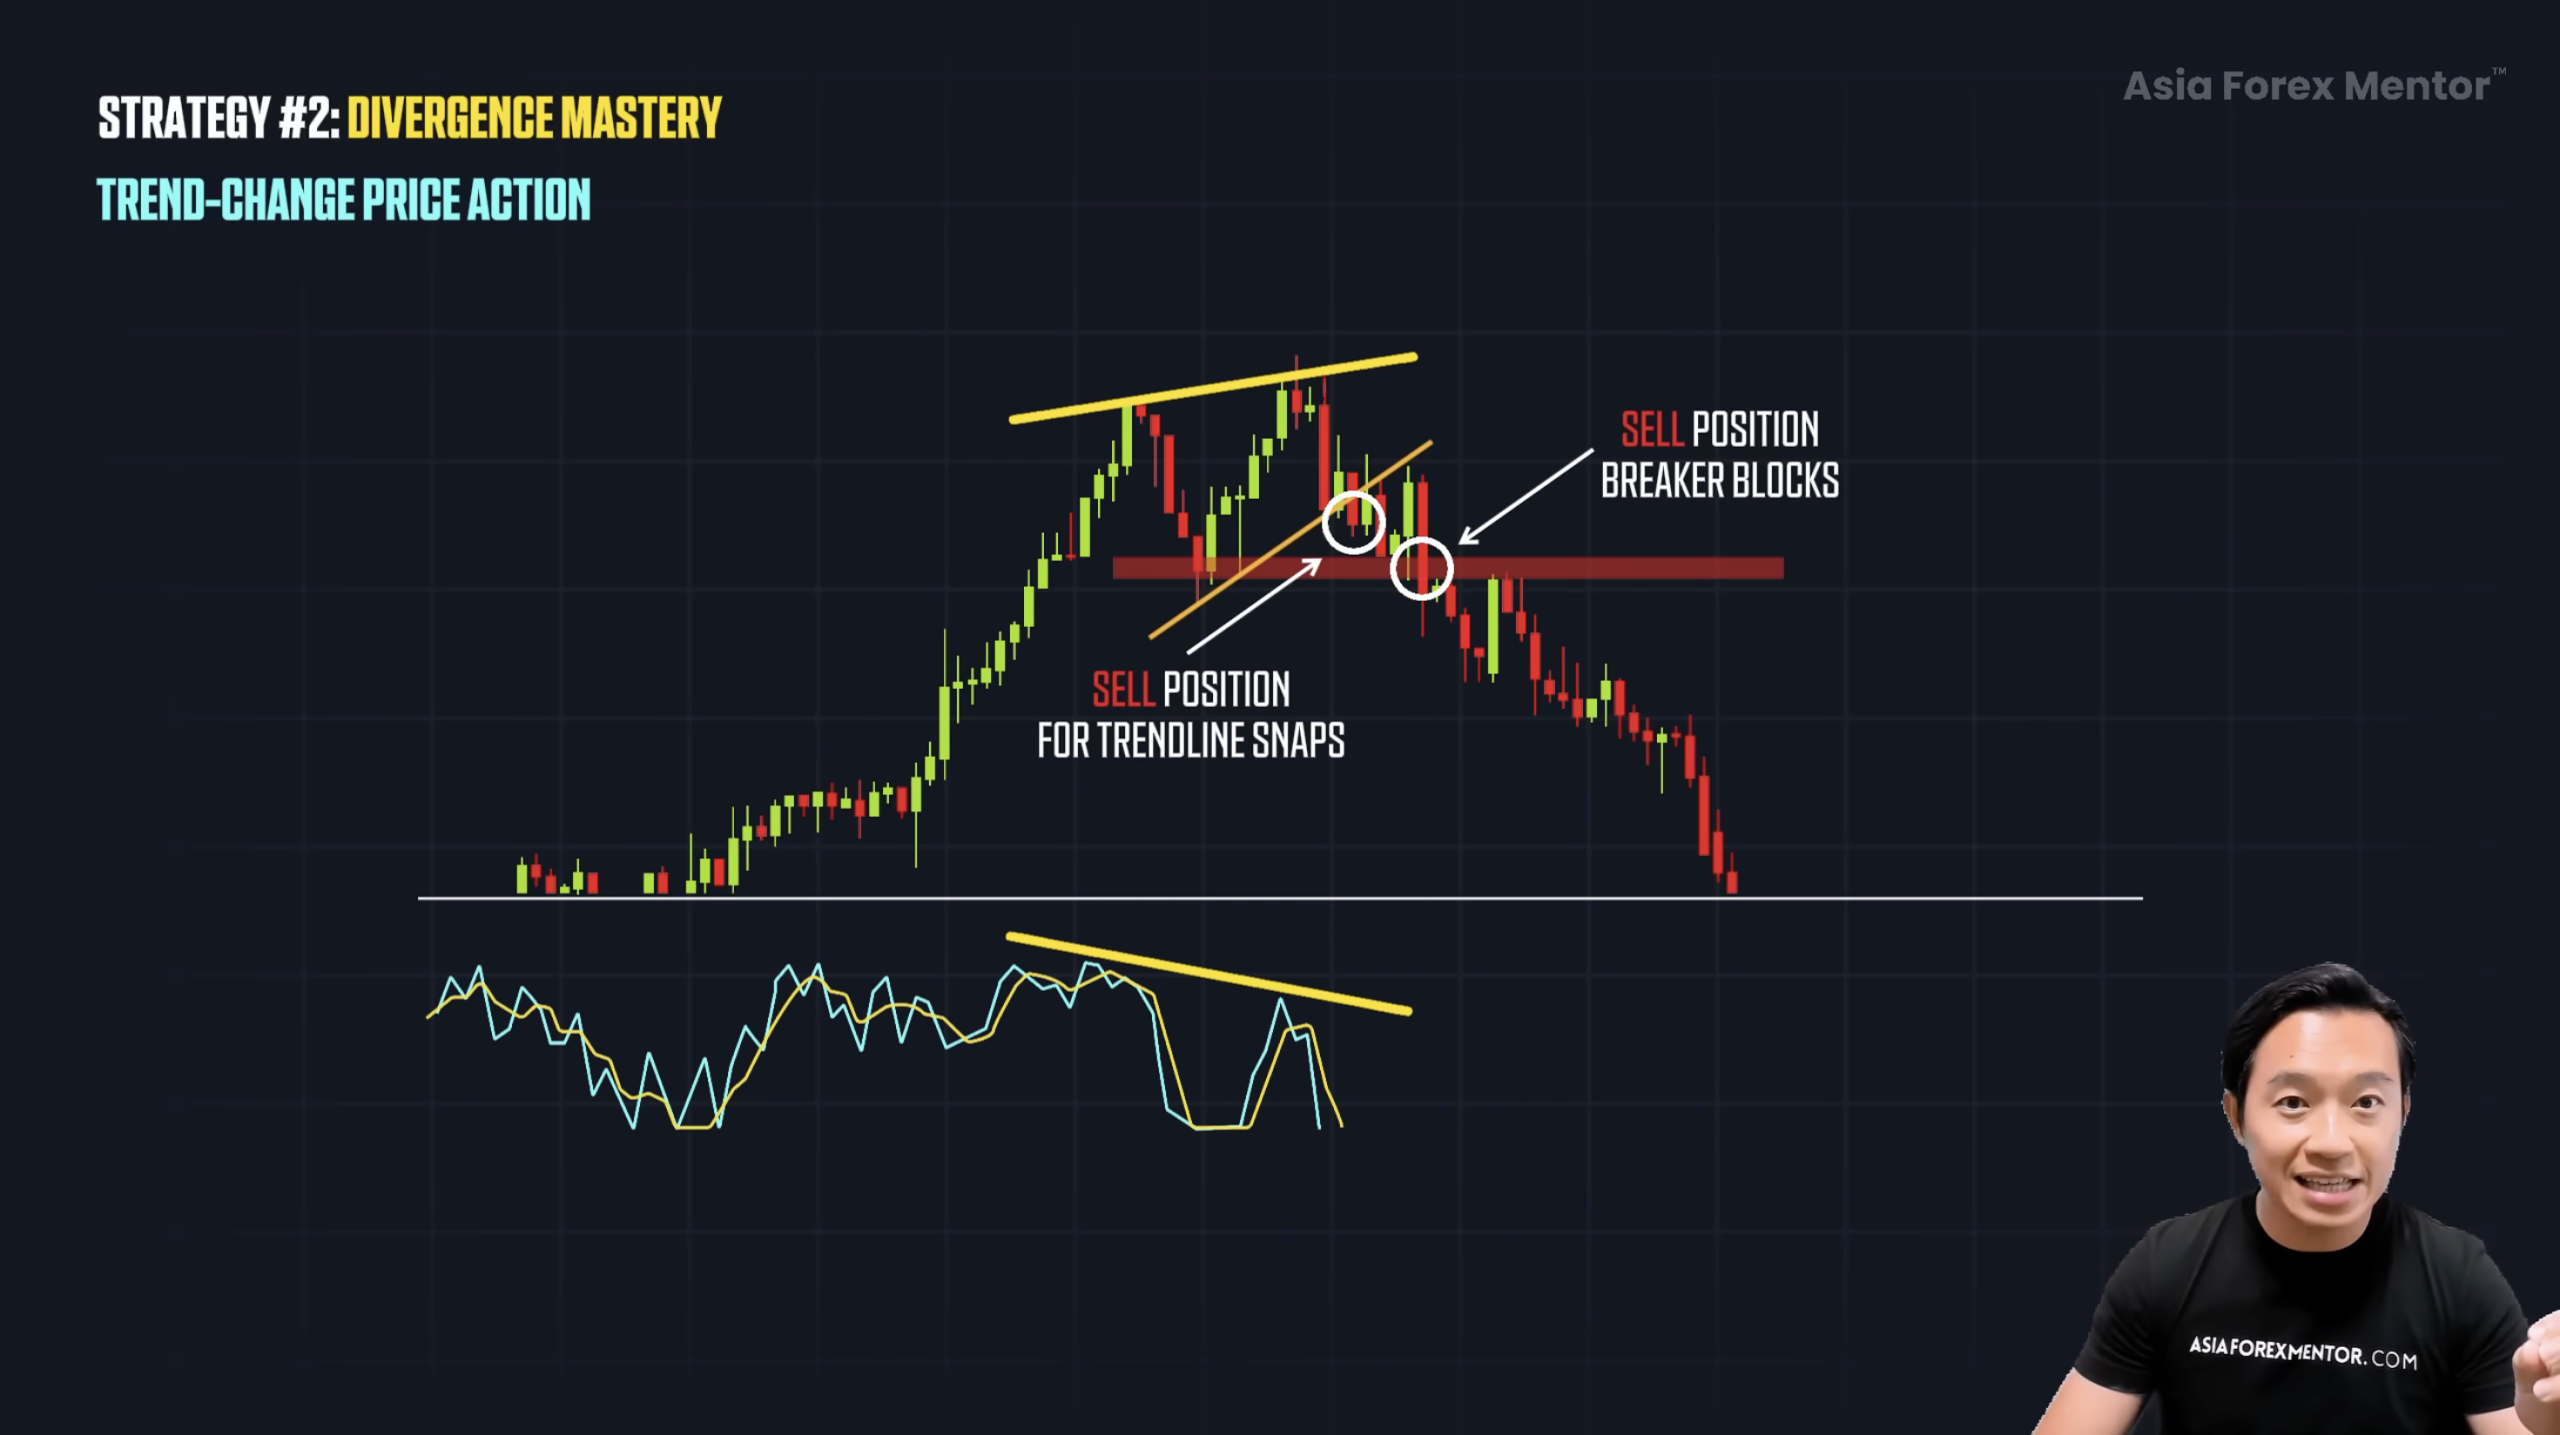
But here’s where most traders mess up: they jump in the moment they spot divergence. That’s not confirmation, it’s just a hint.
You need proof.
Proof comes when price actually breaks structure. Support turns into resistance. A trendline snaps. When that happens, the divergence becomes real because it comes with added confirmation.
Tight Divergence and a Simple Fix
Not all divergences are equal. Tight divergence has smaller swings and forms right after sharp reversals. It still works, but it’s harder to see.
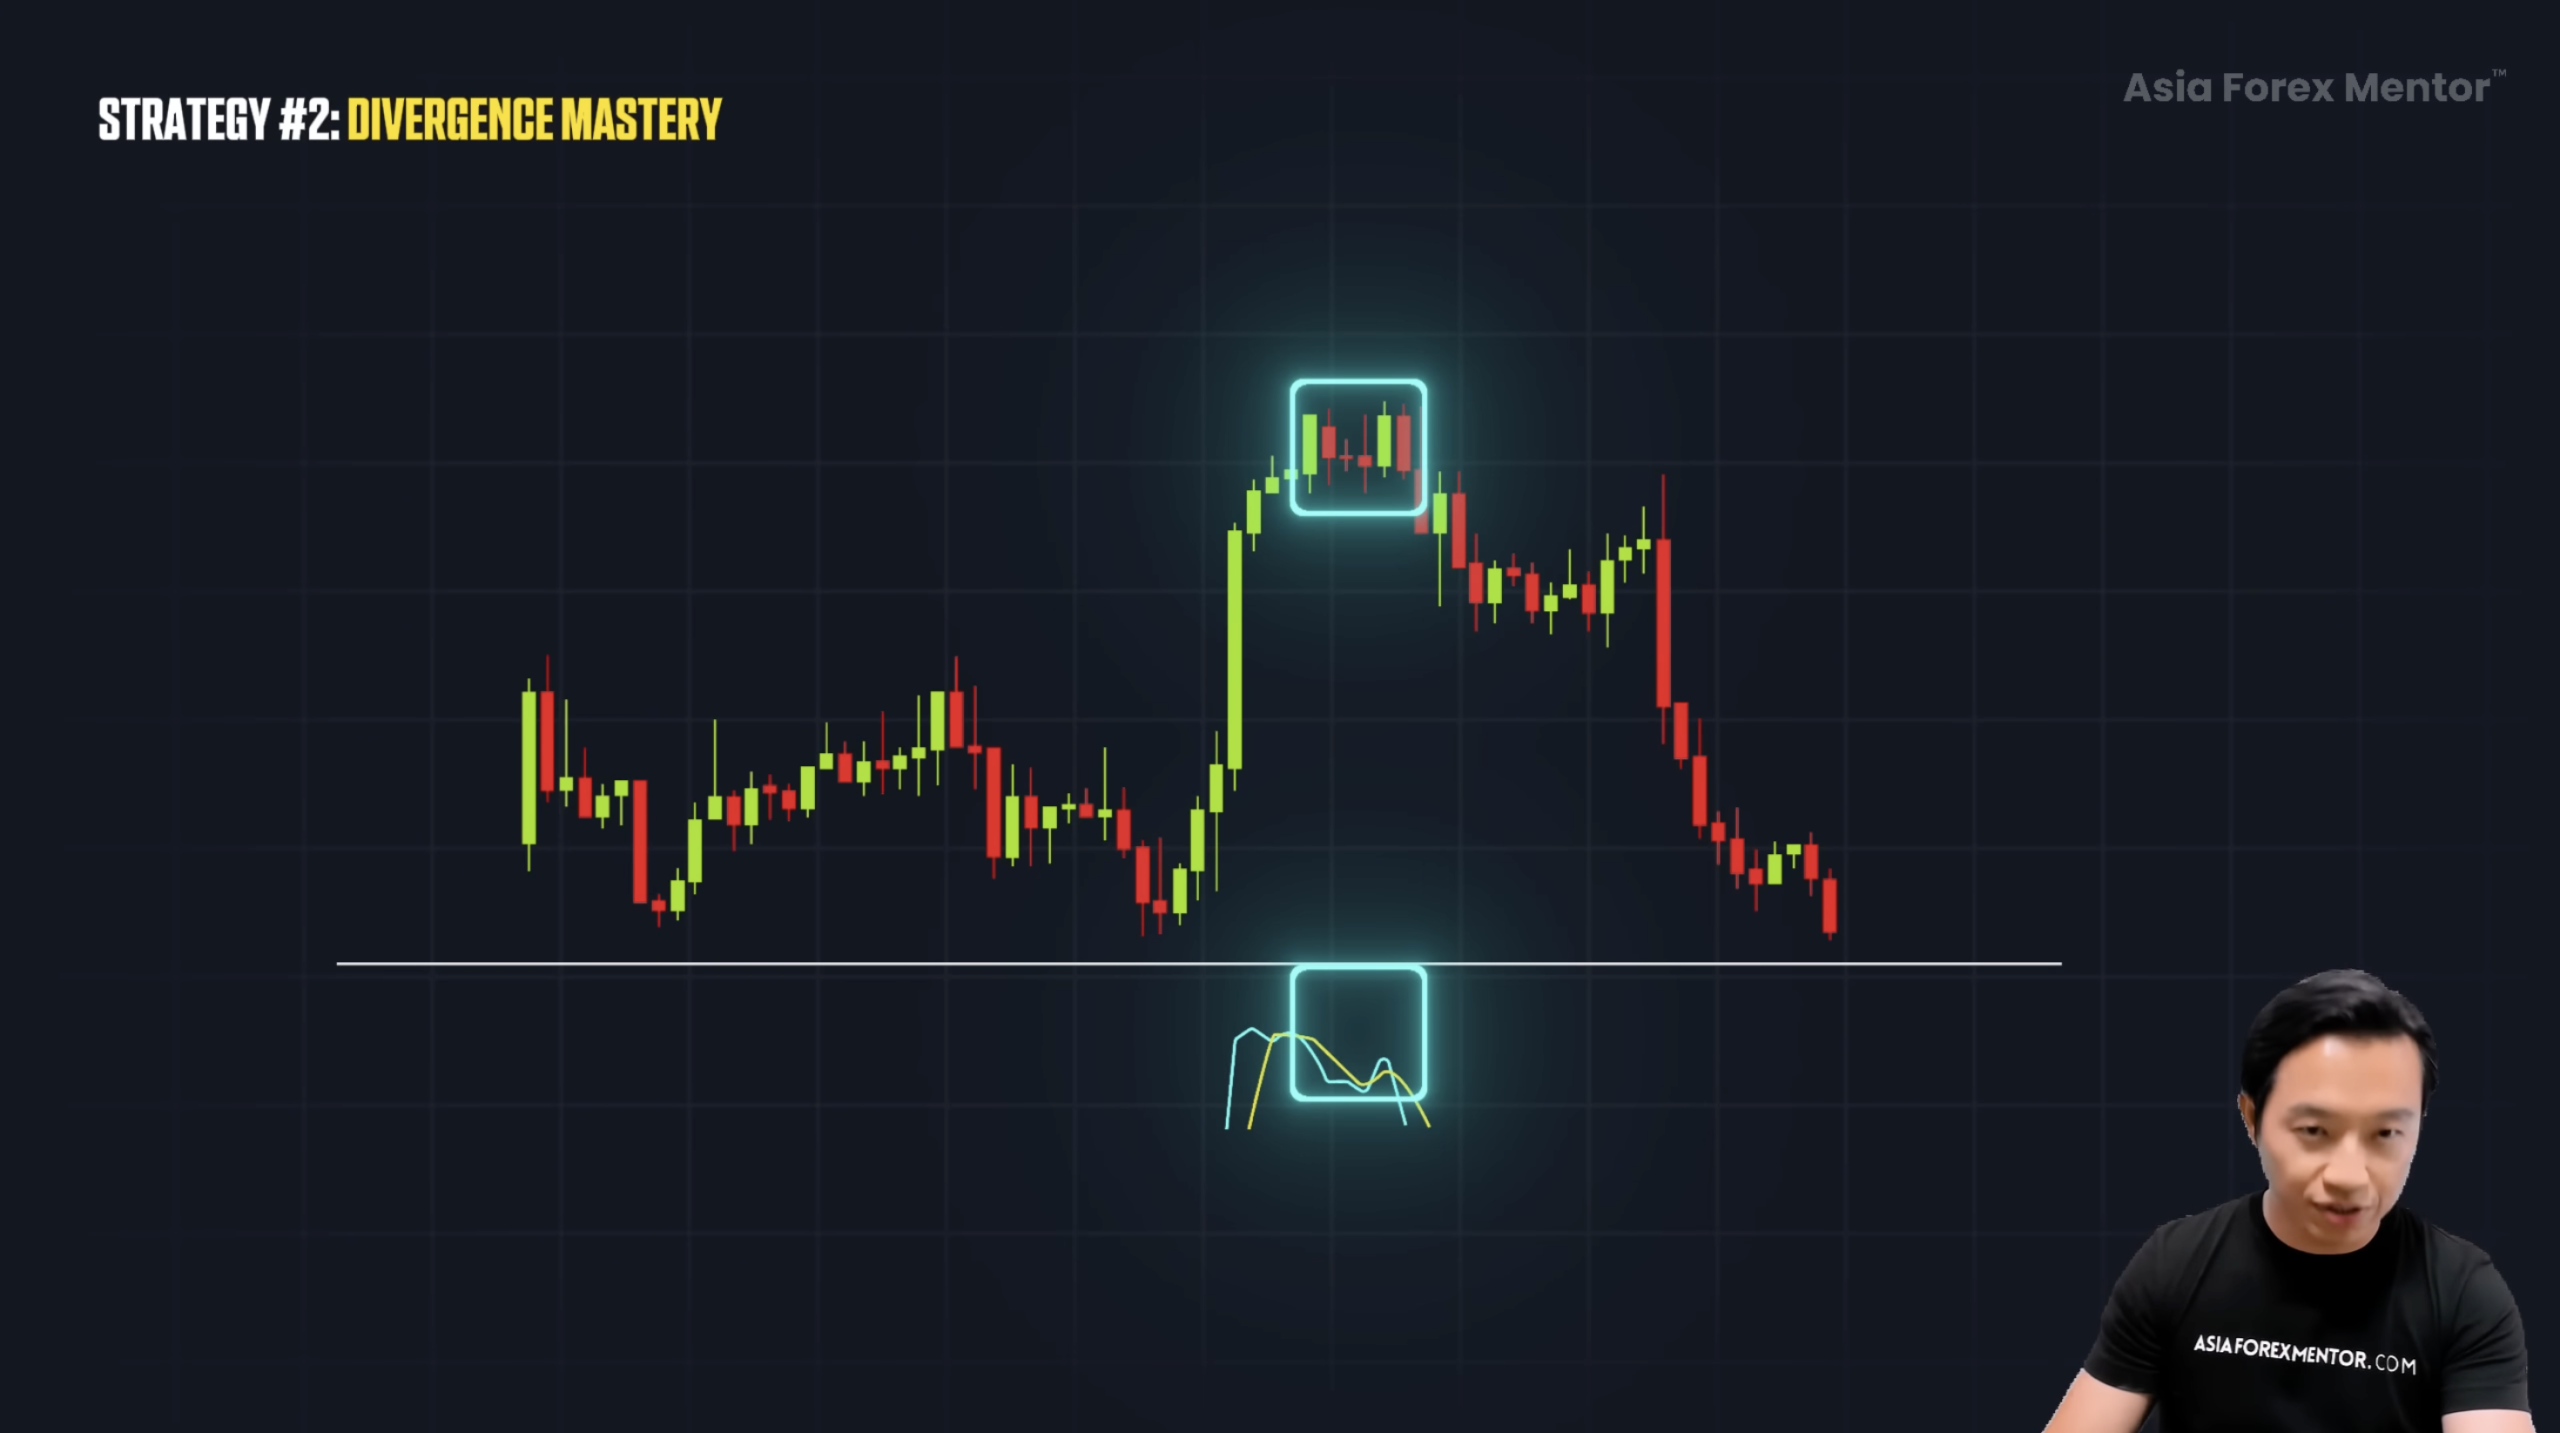
Here’s a quick tip: switch from candlesticks to a line chart. Tight divergences become much clearer.
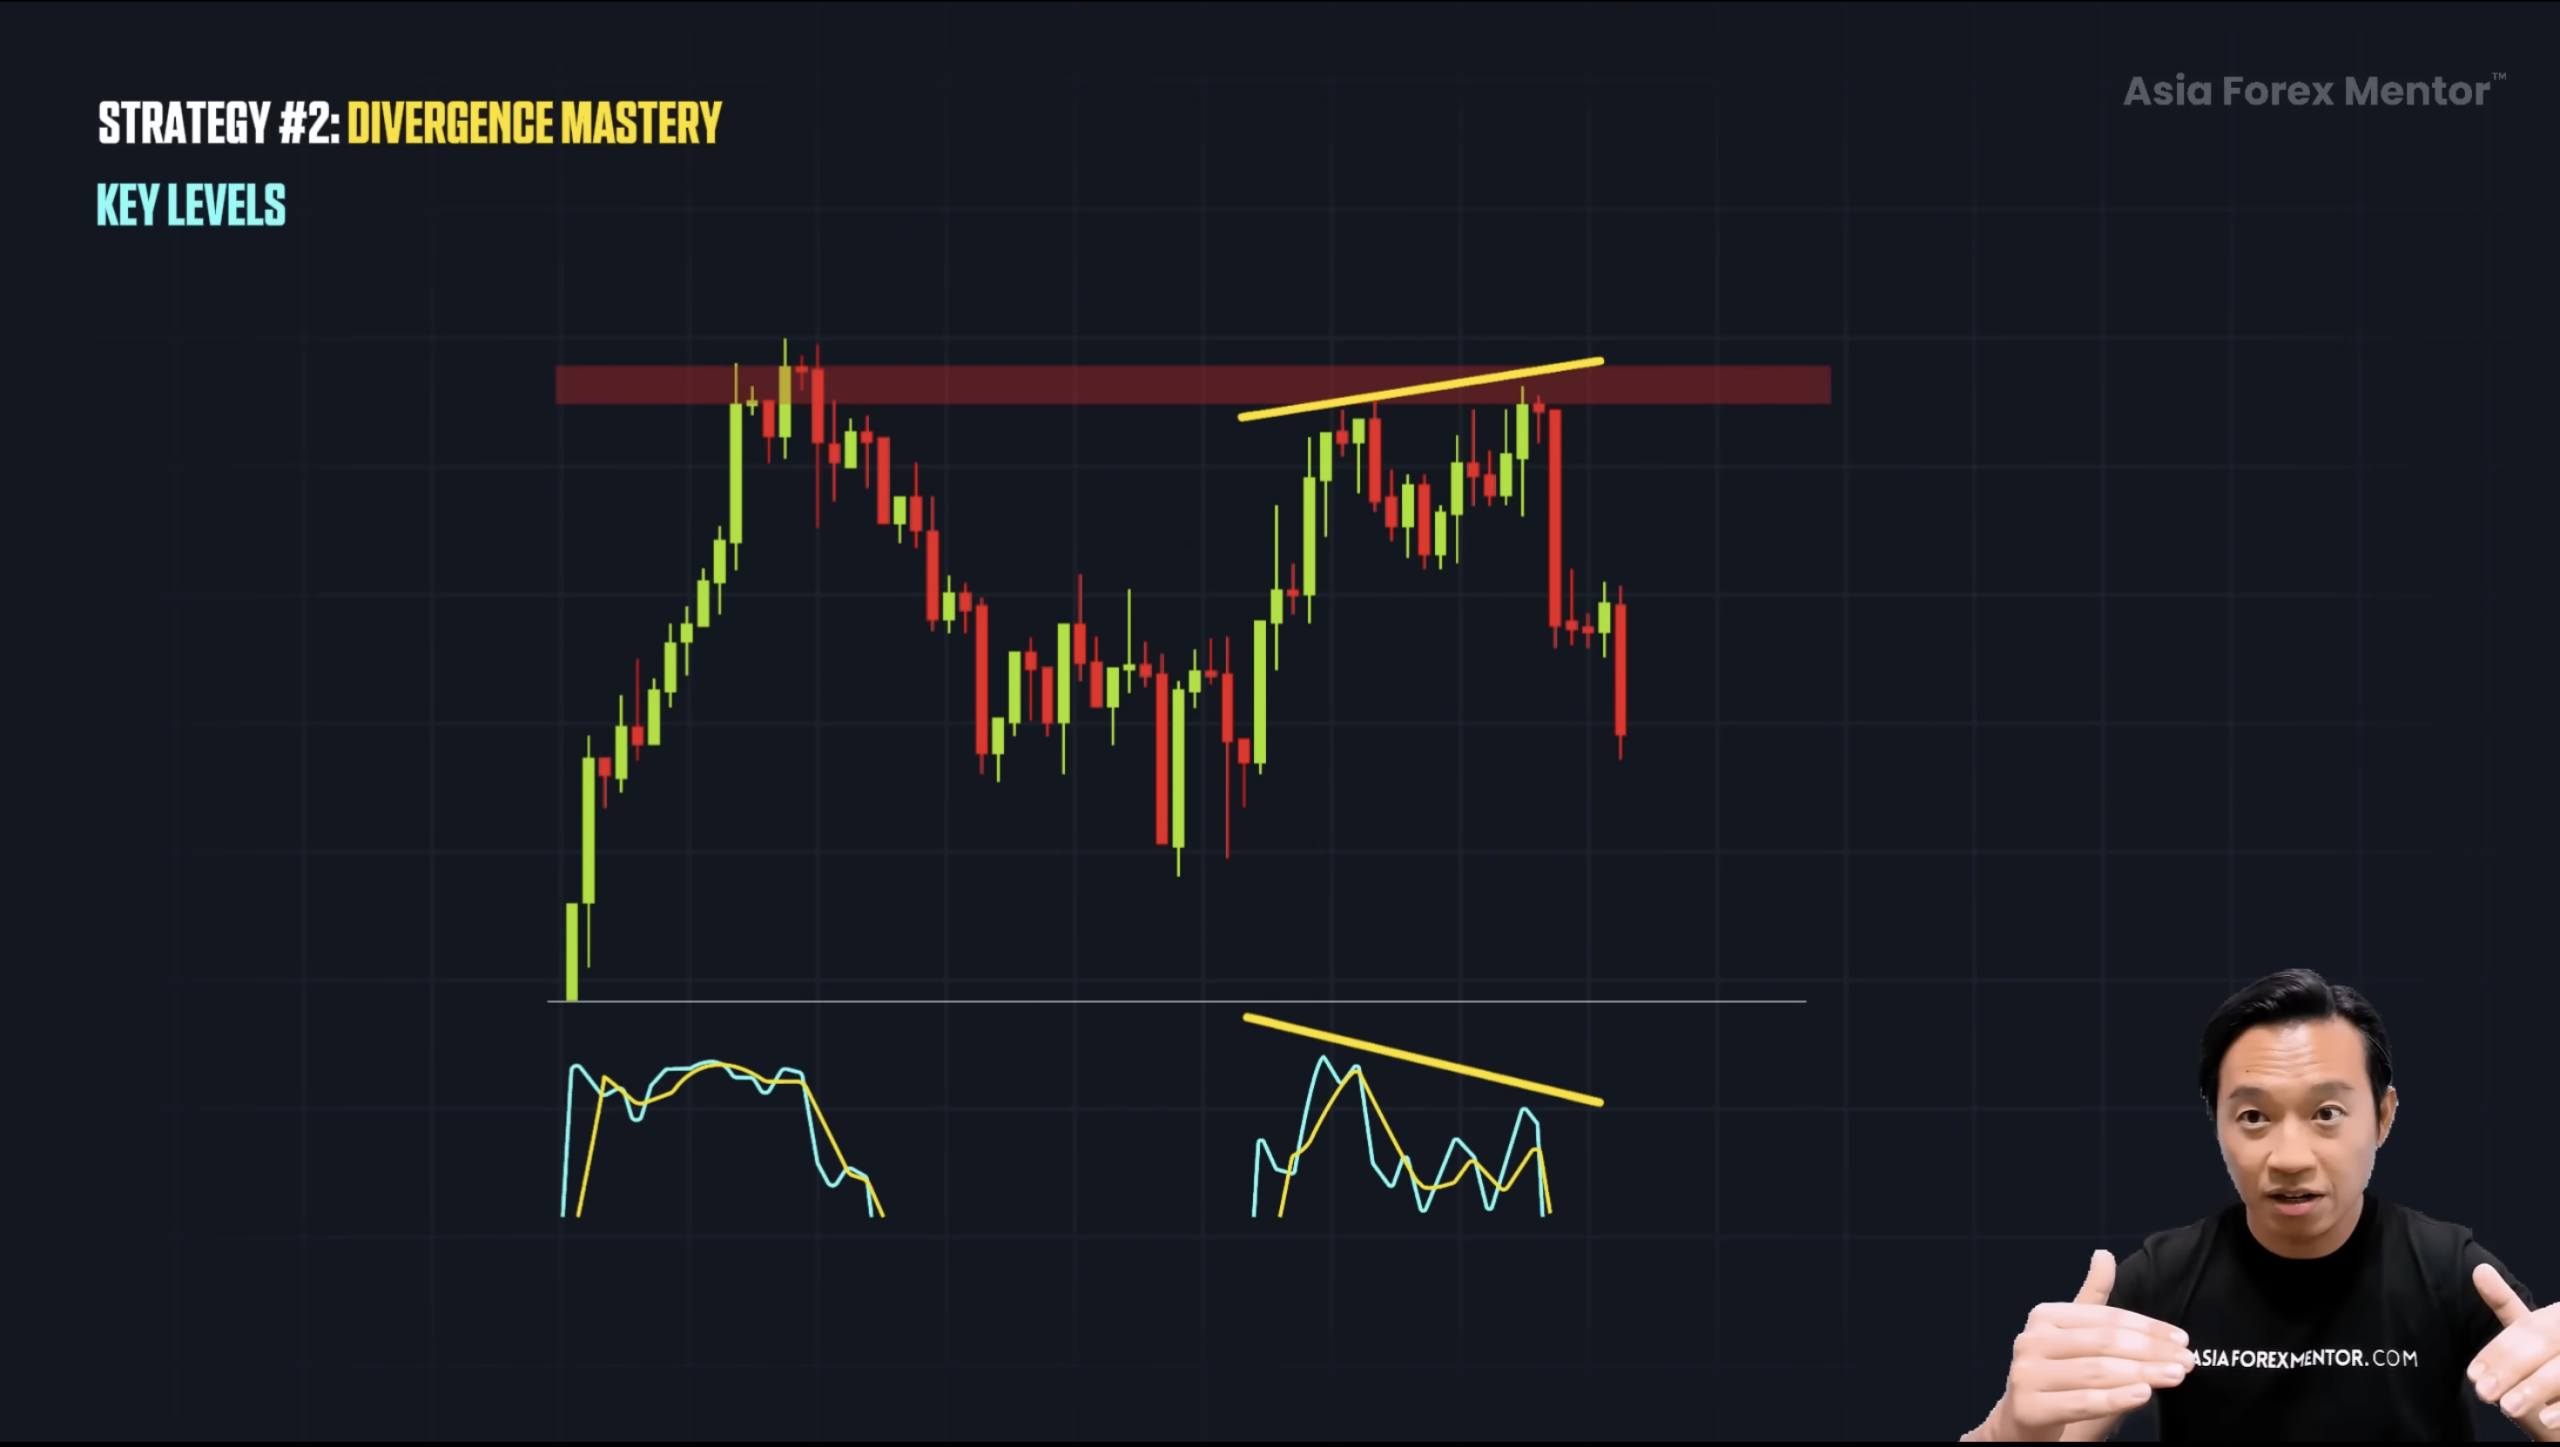
Using Key Levels for Maximum Accuracy
If you really want to increase your win rate, combine divergence with key levels, strong support or resistance zones.
If the stochastic shows regular divergence at a resistance zone, that’s not random. That’s a strong reversal setup. Structure and momentum are speaking the same language.
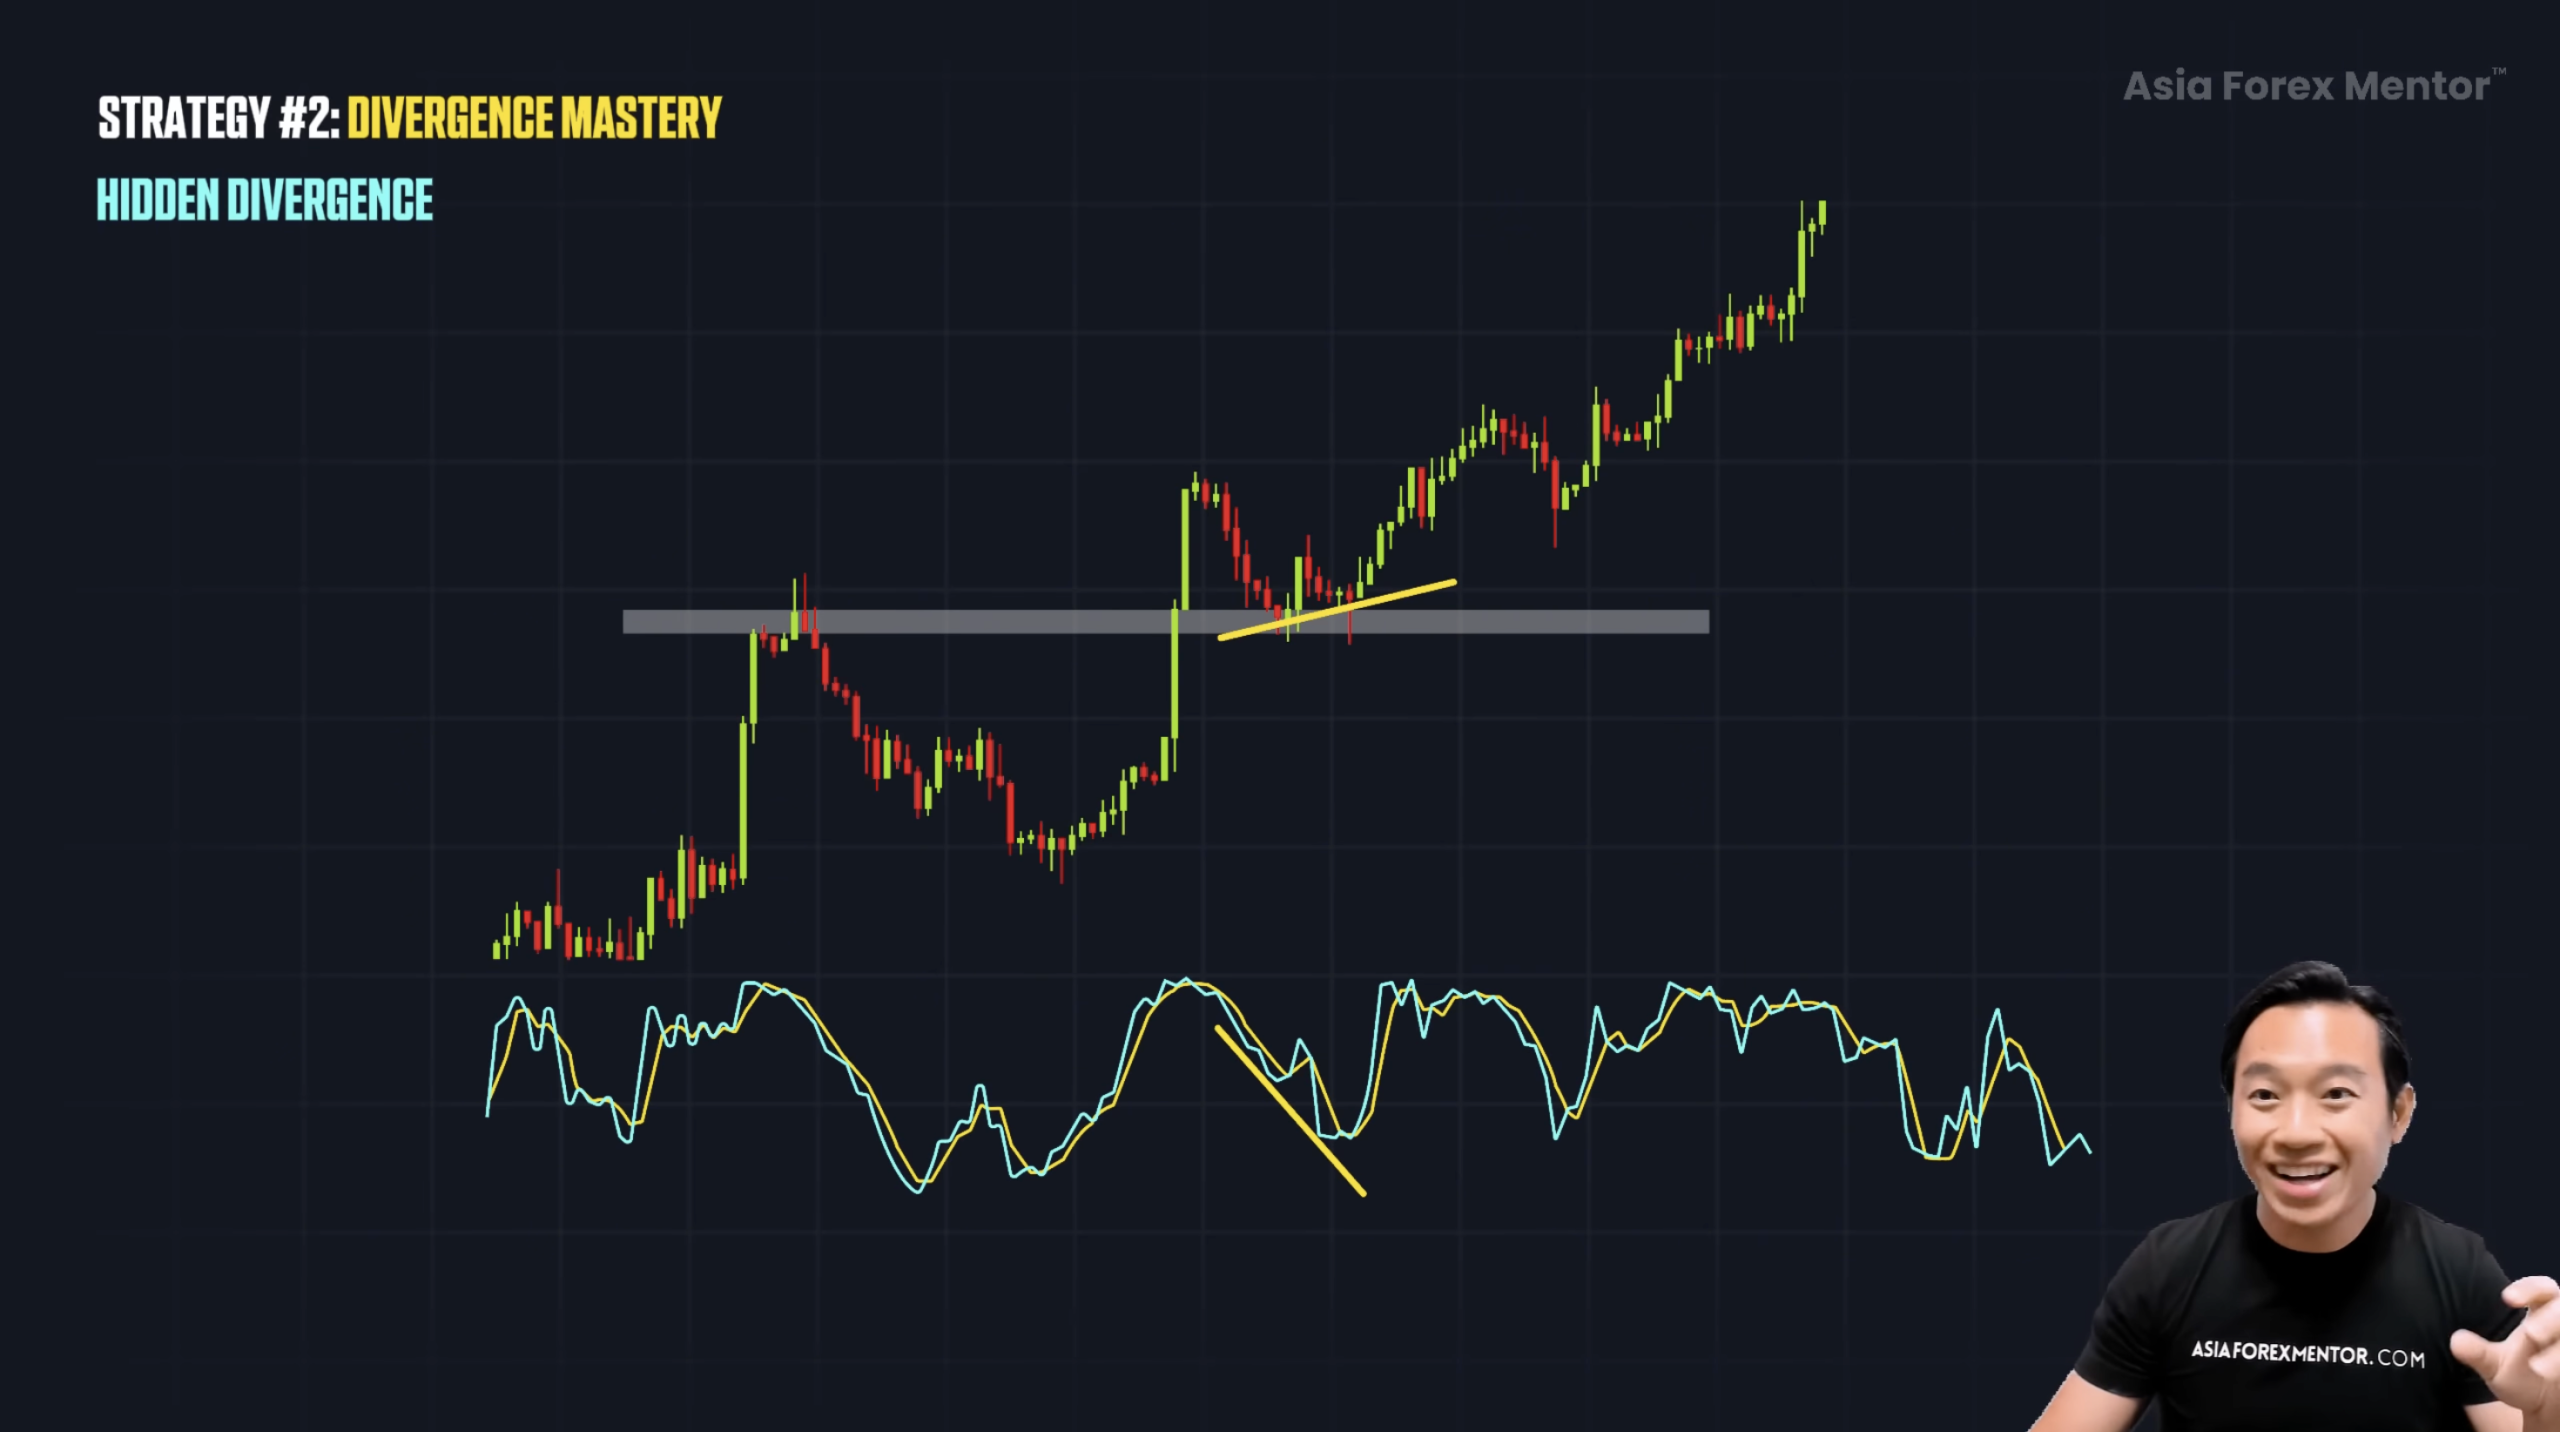
Hidden Divergence
Hidden divergence is different. It shows continuation, not reversal. This one helps you trade with the trend and not against it.
In an uptrend: Price makes higher lows, but the stochastic makes lower lows, hidden bullish divergence. Buyers are reloading.
In a downtrend: Price makes lower highs, but the stochastic makes higher highs, hidden bearish divergence. Sellers are preparing to continue the drop.
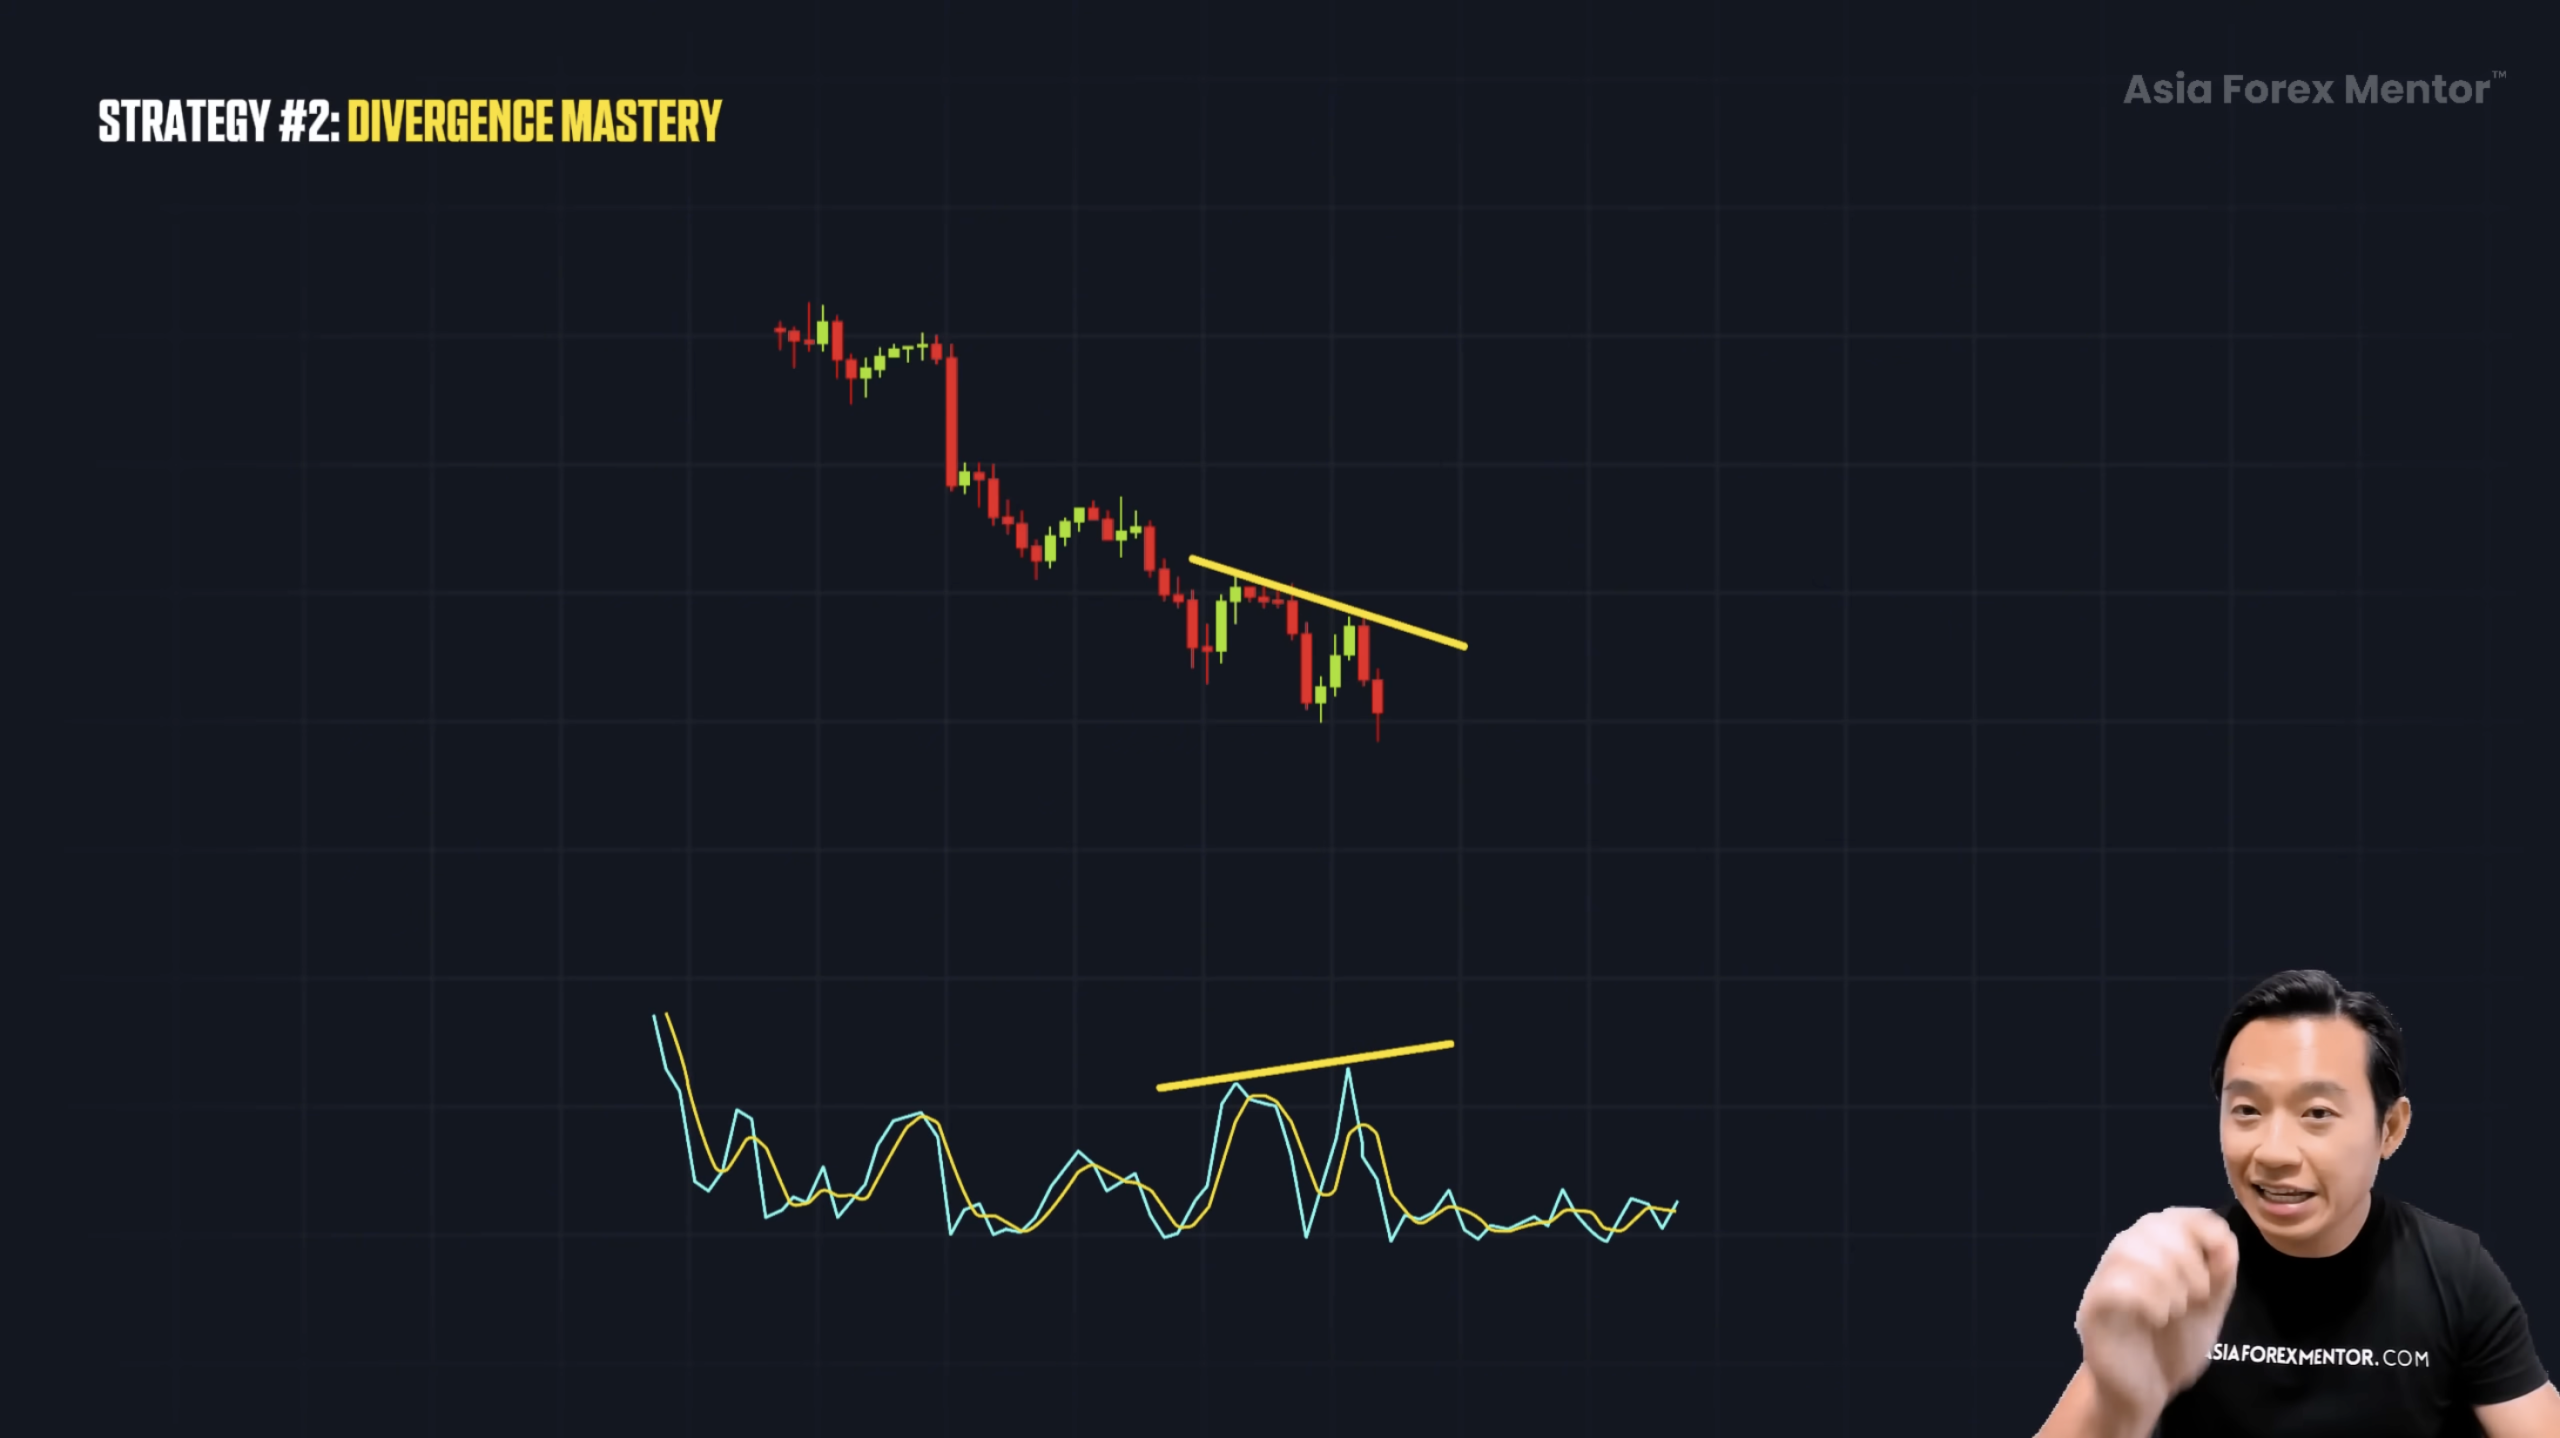
As always, wait for confirmation. Hidden divergence often forms a turning point at support (in uptrends) or resistance (in downtrends). When price breaks structure, the continuation is confirmed.
How To Apply It
-
Spot regular divergence at trend exhaustion points.
-
Look for hidden divergence during pullbacks.
-
Use line charts when swings are messy.
-
Confirm everything with structure breaks.
-
Add support/resistance for stronger accuracy.
The best setups are never just one signal. Divergence is powerful, but only when confirmed and paired with structure.
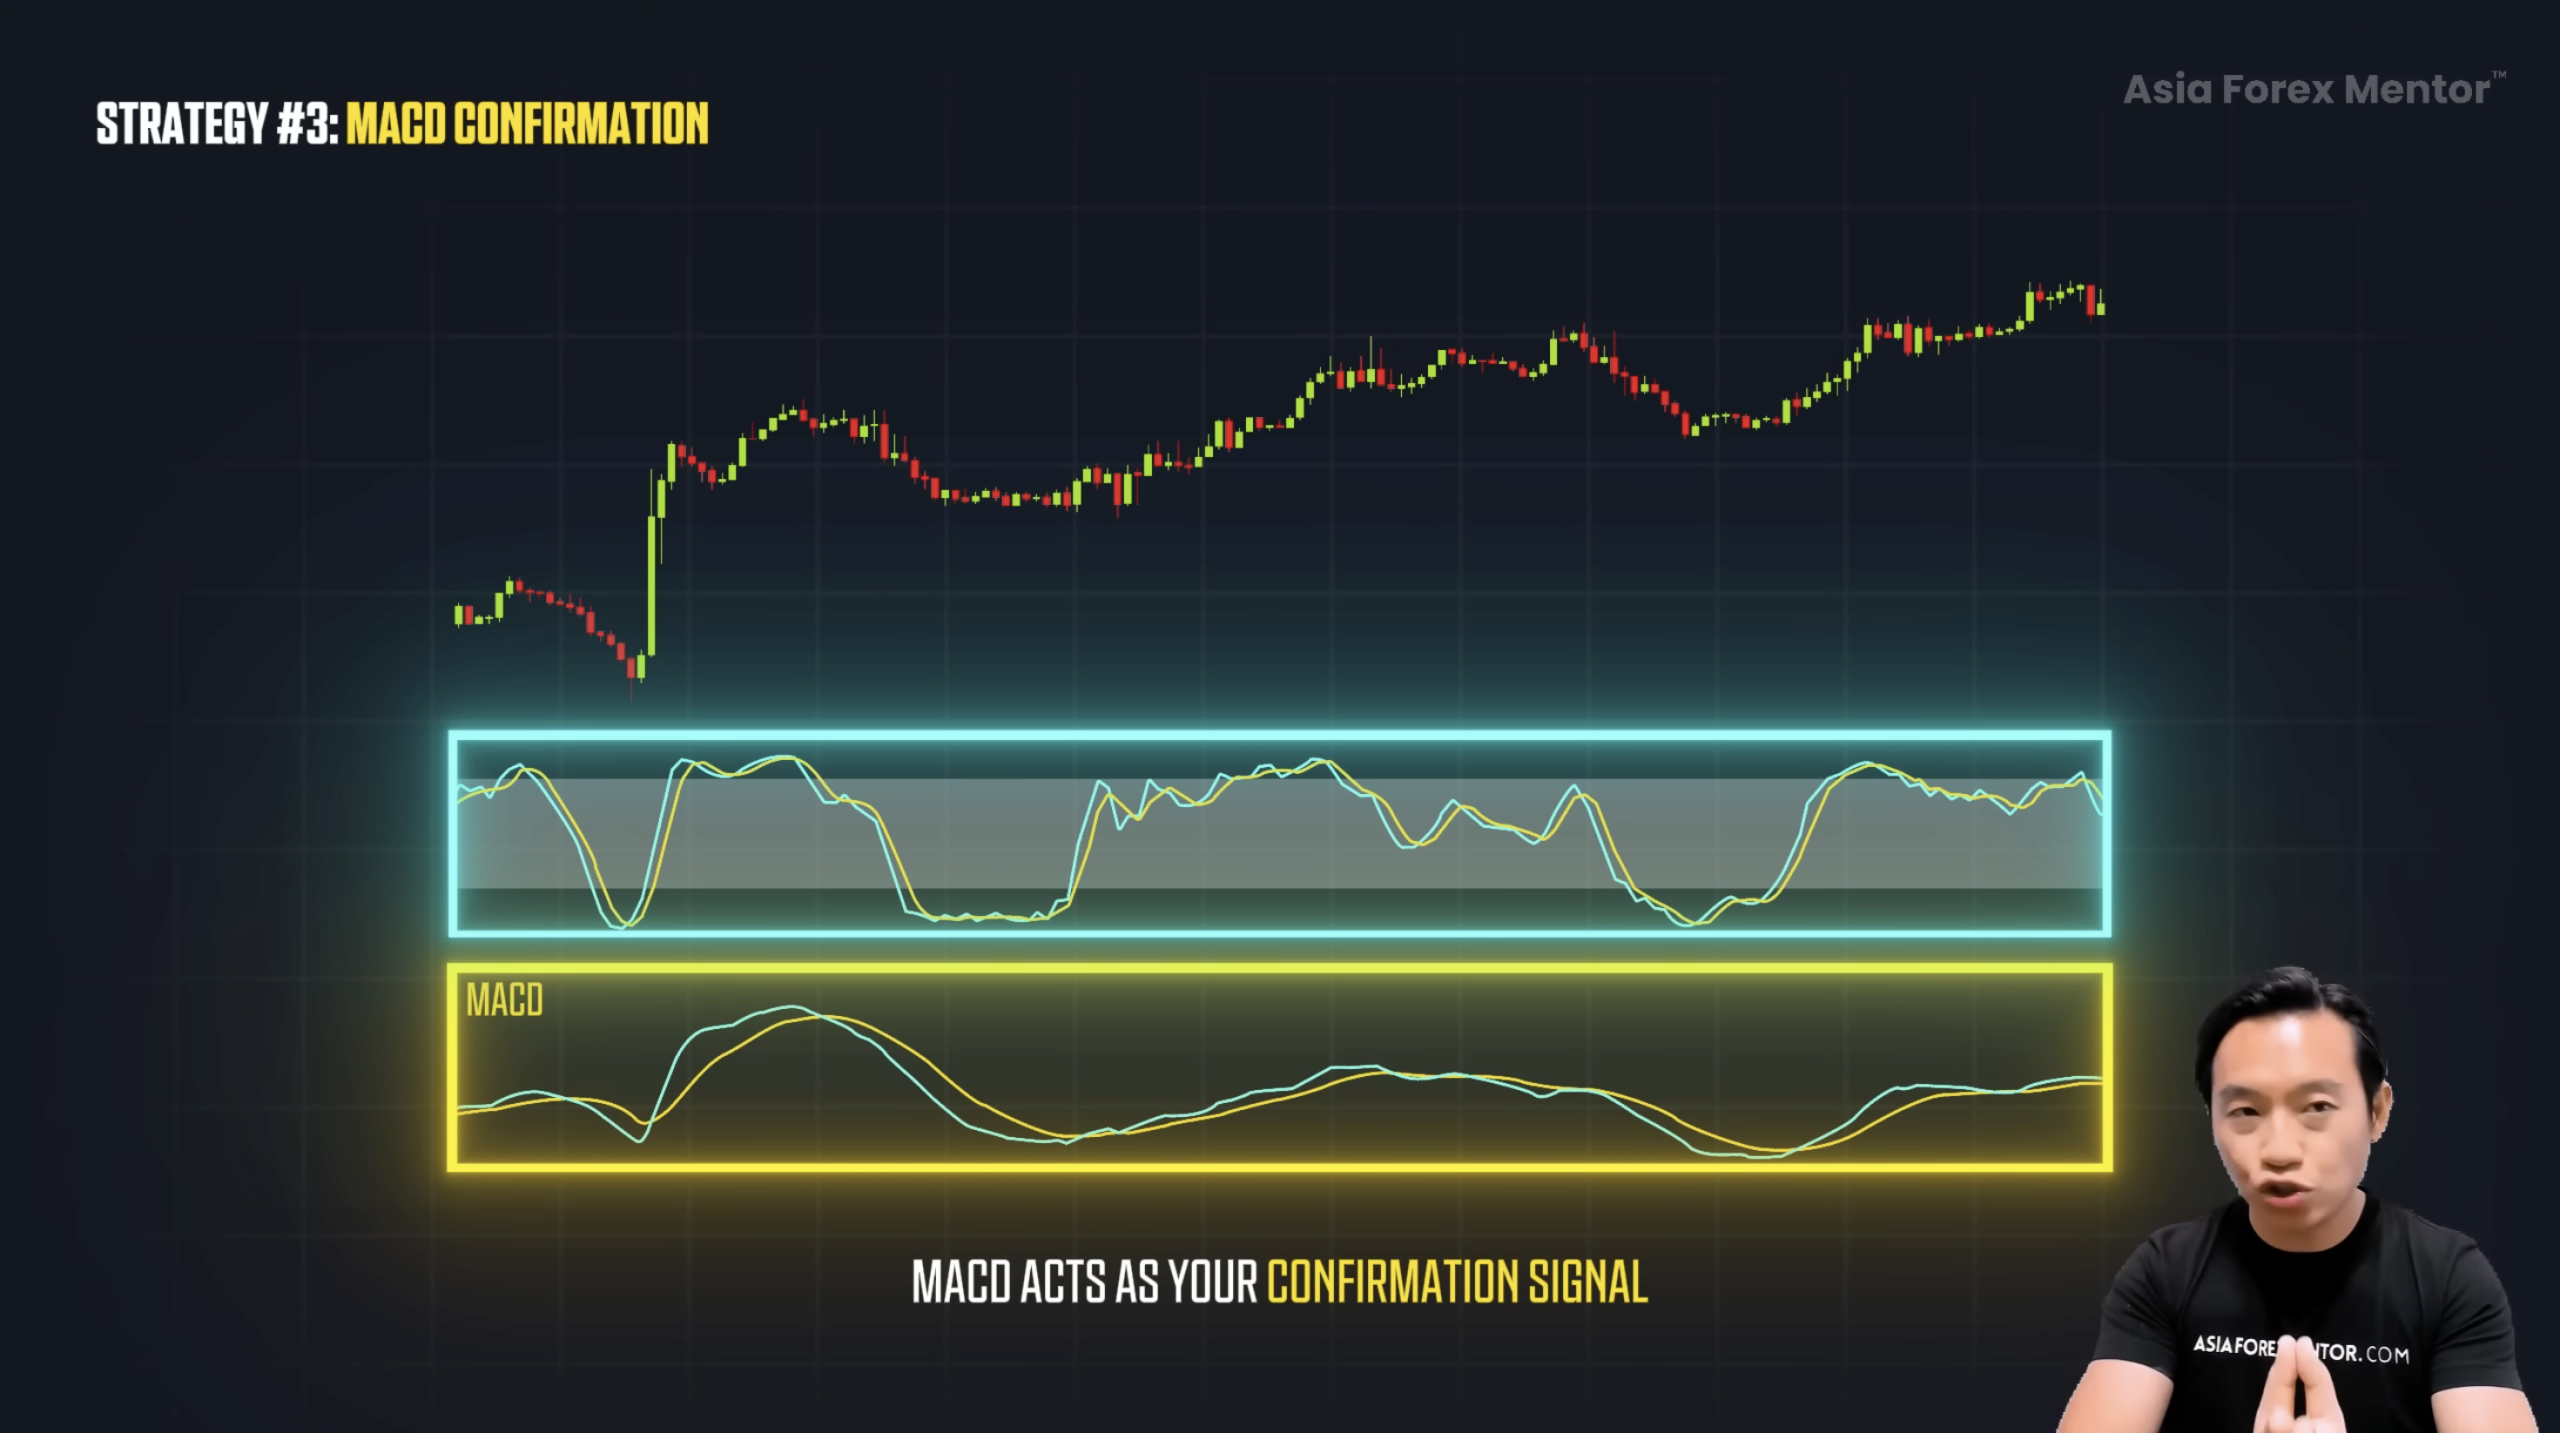
Strategy 3 – MACD Confirmation With the Stochastic Oscillator
Now let’s add confirmation. When you combine the stochastic oscillator with the MACD, you’re not guessing anymore. You’re verifying the setup.
The stochastic identifies momentum shifts. And the MACD confirms whether that shift is backed by real strength.
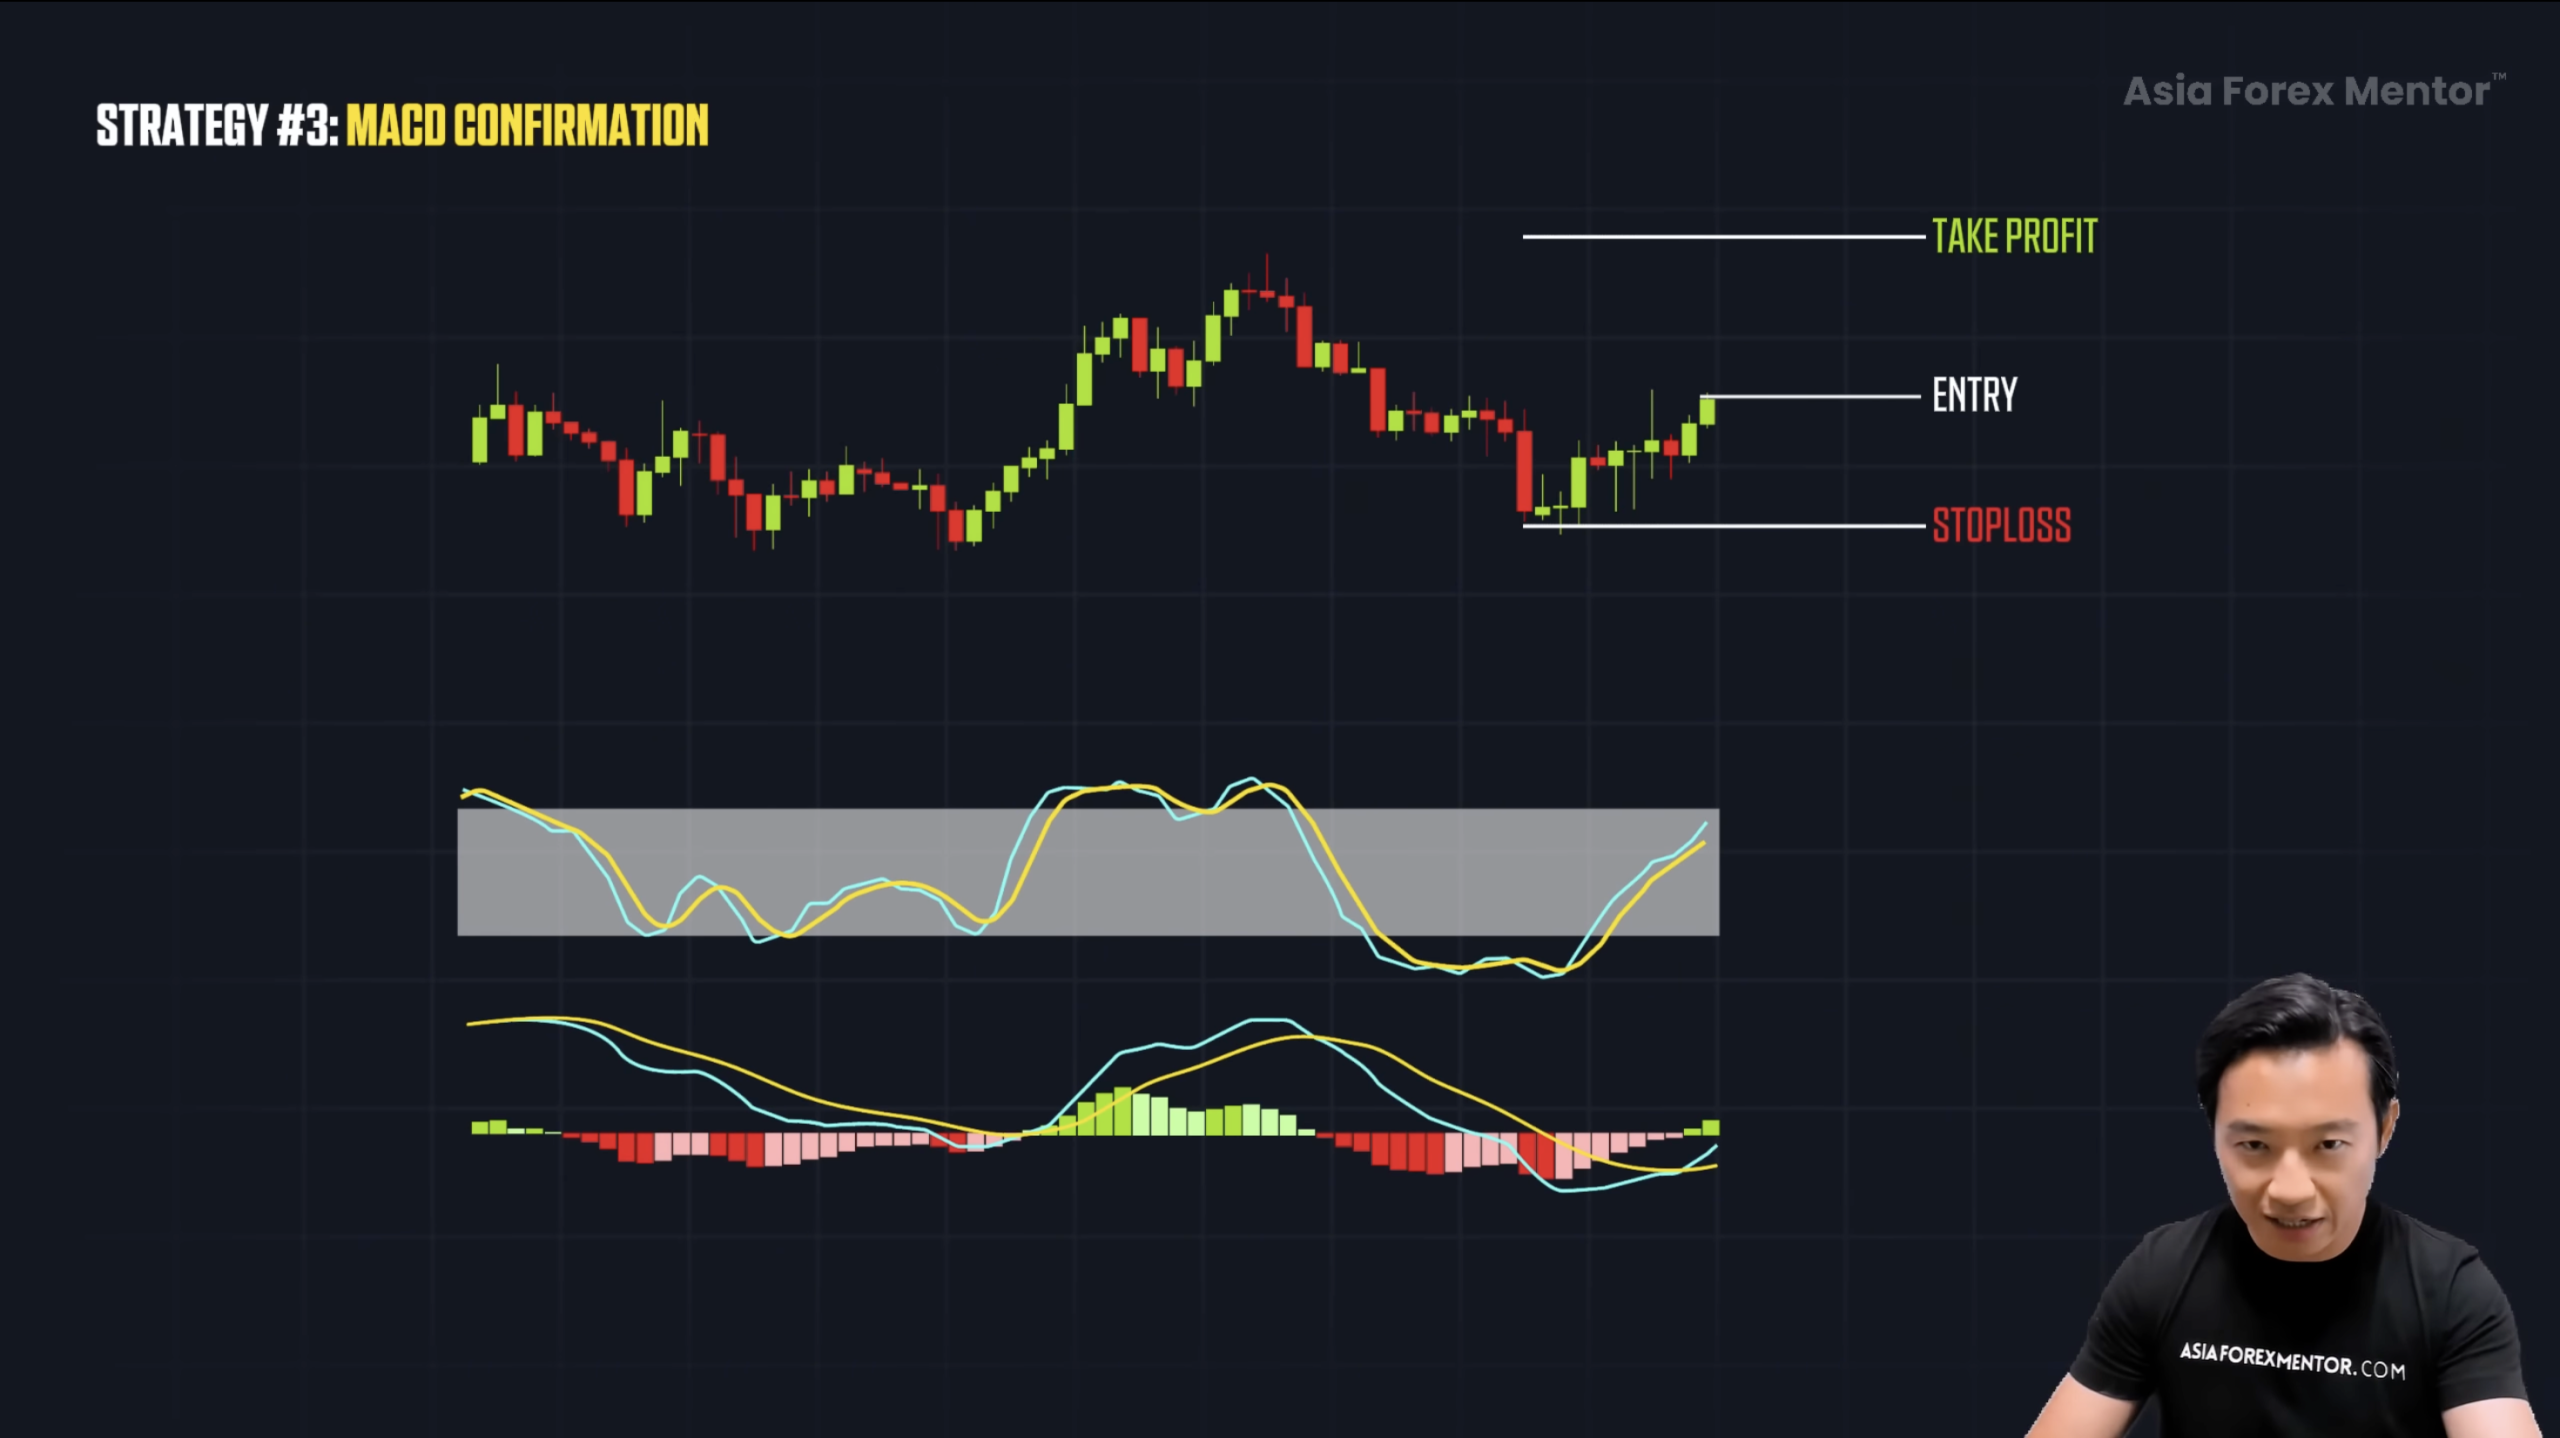
How It Works
When the stochastic dips into the oversold zone, it shows the pullback is cooling off. But the MACD is what tells you whether that shift is real.
When the MACD line crosses above the signal line, that’s your green light. That proves the momentum is shifting in your favor.
Everything now points in the same direction, momentum and confirmation. That’s your entry.
After you buy, put your stop loss below the recent swing low. For take profit, aim at the next rejection level.
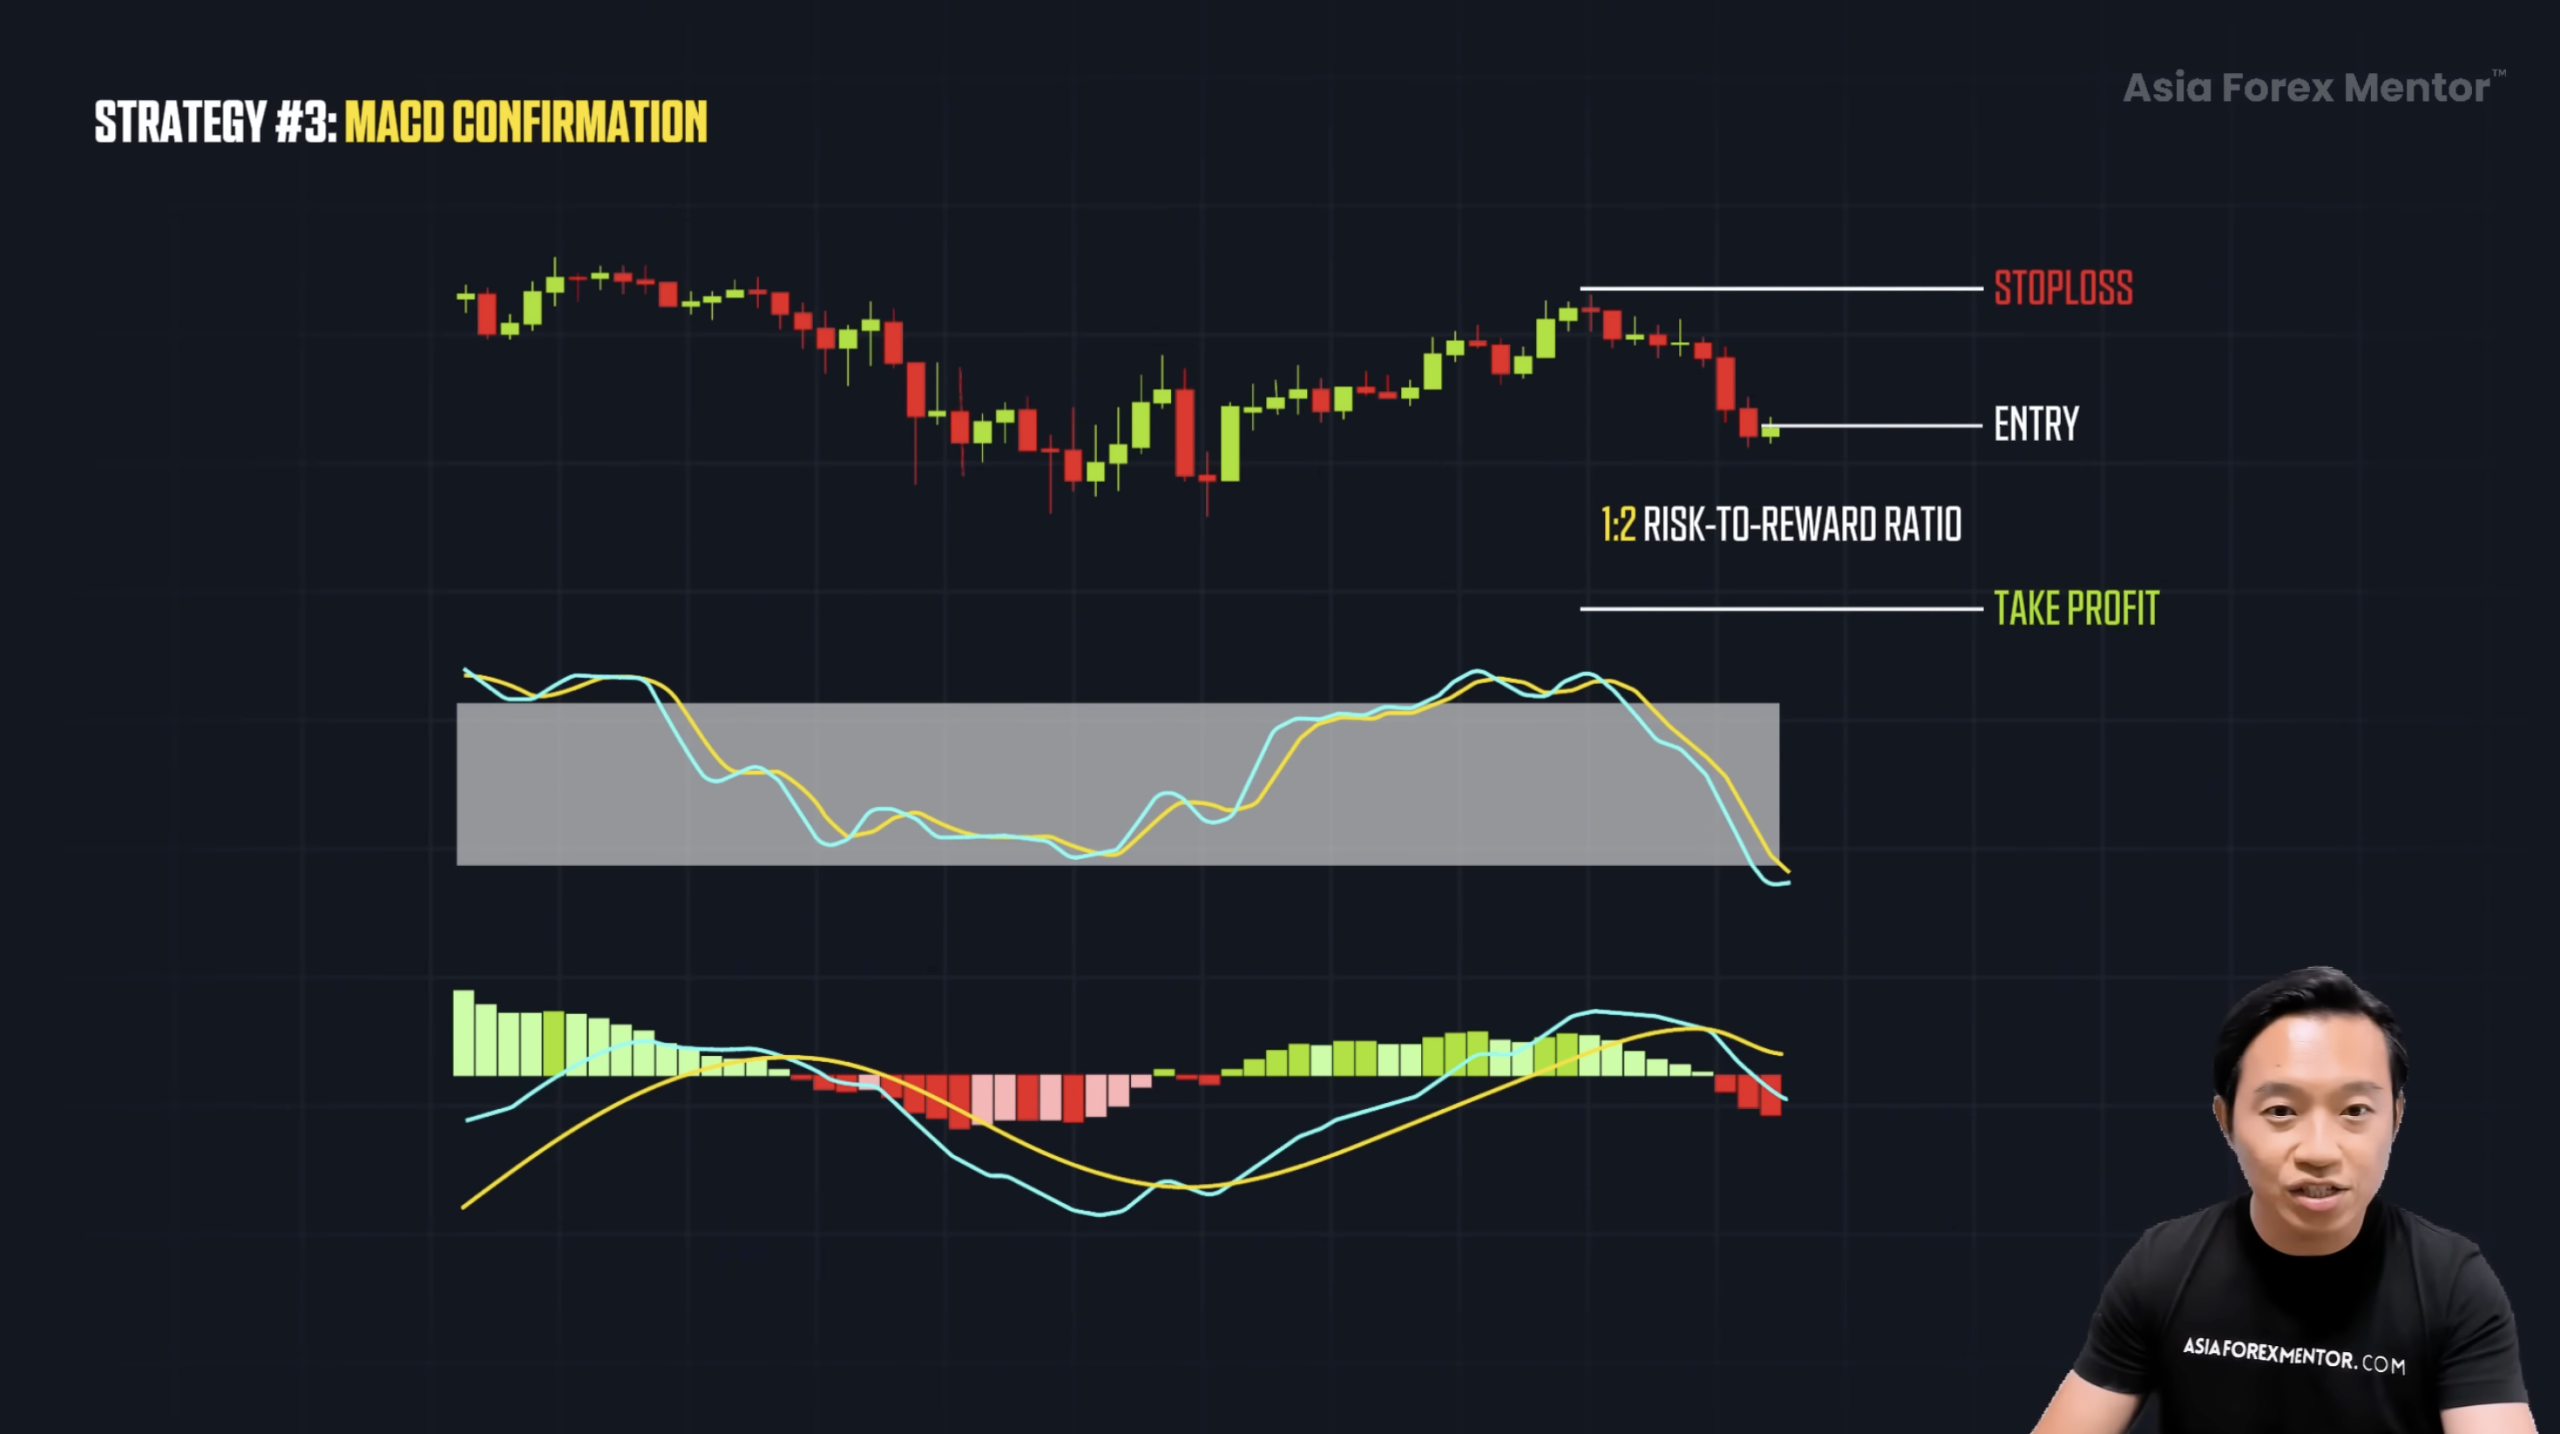
For sells, it’s the same logic in reverse.
Stochastic rises into overbought, MACD crosses below its signal then that means sellers are taking control again. So you place your stop goes above the swing high, and take profit aims for the next rejection or at least a 1:2 R:R.
How To Apply It
-
Wait for the stochastic to hit oversold or overbought.
-
Watch MACD for the confirming crossover.
-
Enter only when both align.
-
Place stops at logical swing points.
-
Target nearby rejection zones.
The MACD acts as your lie detector. When it agrees with the stochastic, the setup becomes legitimate.
Putting All Three Strategies Together
Now that you know all three strategies, you can use them individually or stack them together for a high-probability setup.
Here’s how they combine:
-
Identify the trend with the 200 EMA.
-
Make sure the stochastic aligns with the trend direction.
-
Look for divergence, showing momentum weakness.
-
Confirm the move with the MACD crossover.
-
Add structure, trendlines, and candlestick patterns if you want even more precision.
When all three pieces align, you’re on track for a strong move.
If you want something that will change the way you trade forever, I’ve put together a free training that walks you through the exact three-step system I use to find high-probability trades with sniper-level entries, real risk control, and zero guesswork. This is the same system I use myself and the same one that has helped thousands of traders go from frustration to consistent wins.
Stochastic Oscillator Strategy (Quick Summary)
The stochastic oscillator reads momentum, not reversal by itself.
• Combine the stochastic with the 200 EMA to avoid fighting the trend.
• Use regular divergence for early reversal signals, with confirmation.
• Use hidden divergence to catch trend continuation during pullbacks.
• Add MACD confirmation to verify whether momentum shifts are real.
• Stack all three strategies for the highest probability setups.
• Always trade with momentum, not against it.
FAQ's
What’s the easiest way to use the stochastic as a beginner?
Start with one simple rule: Trade only in the direction of the trend. If price is above the 200 EMA, look for buys when the stochastic dips into oversold. If price is below the 200 EMA, look for sells when the stochastic rises into overbought. This alone removes most bad trades.
What does the stochastic oscillator actually measure?
The stochastic doesn’t measure trend or price direction, it measures momentum. It tells you how strong or weak the current move is compared to recent price action. When you understand it this way, you stop treating overbought and oversold as automatic reversal signals and start using them as momentum clues.
Do I enter a trade as soon as the stochastic hits overbought or oversold?
No. Overbought and oversold are not entry signals by themselves. The better approach is to wait for confirmation, such as the stochastic crossing back inside the zone, a break of structure, or the MACD moving in the same direction. This helps you avoid guessing and only take trades when momentum truly shifts.


