
Investors harness the power of chart patterns, to get an insight into the current market and predict future movements. When in need of a reliable bullish reversal pattern, most turn to the triple bottom that usually happens during the conclusion of a downtrend.
The candlestick pattern indicates an imminent shift in the direction of a trend, following three unsuccessful tries by the sellers to penetrate the support level.

Also Read: How to Trade the Tweezer Top Pattern
Contents
- What the Triple Bottom Chart Pattern Reveals
- How to Trade with the Triple Bottom Pattern
- Rules for Trading with Triple Bottom
- The Difference Between a Triple Bottom and a Triple Top
- Limitations of a Triple Bottom
- Conclusion
- FAQs
What the Triple Bottom Chart Pattern Reveals
The name of the pattern provides a few hints about its purpose, such as that it is one of the reversal patterns. It gets formed by three successive lows, which are typically at an identical level. But for the triple bottom to happen and be productive, the same price action must get traded in an obvious downtrend.
In this situation, the sellers will attempt to drive the price lower to see the potential of the horizontal support, but they may encounter buyers that will put up significant resistance. Resulting in the price action, going higher, while the sellers regroup and prepare for the second attempt.
Not surprisingly, as you are already aware, the second try of the sellers will produce the identical result. Making the sellers more determined to attempt a new offensive, especially because the price action remains in their control, and they have been unsuccessful for the second time.
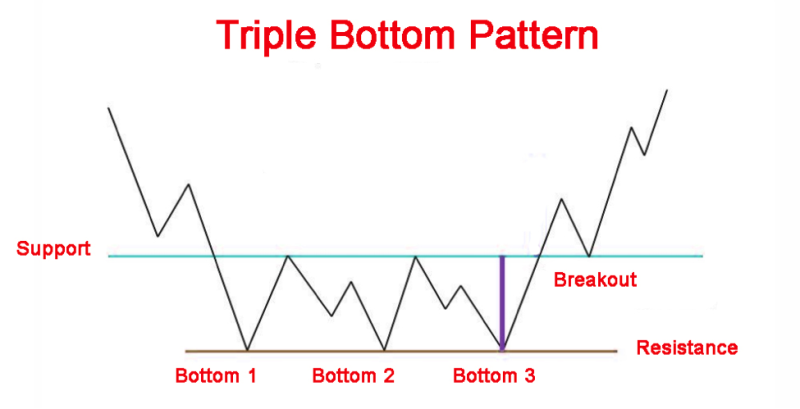
Typically the price will come back to the previous levels, similar to the outcome of the preceding rebound. Taking into account that the downtrend is powerful the sellers drive the price action lower, attempting to crush the buyer's determination. Although the effect is identical to the previous attempts.
In the end, sellers capitulate in this case, and the buyers take control of the price action. This time enlarging the rebound to a bigger level, so much so that it will eliminate any losses sustained previously.
On triple bottom chart patterns, the visual layout is composed of a blue line indicating the horizontal support, this is the situation where the bears failed to enlarge the downtrend. The higher position of the neckline is usually shown as a red line that connects the highs of the 2 rebounds.
The neckline is crucial in the triple bottom pattern, when it breaks to the upside it triggers the pattern, and enables investors to identify take profit and stop loss,
The three key elements of the triple bottom chart pattern are:
- The downtrend: the price of an asset has to trade lower;
- The neckline: the break-in this element indicates the start of the formation
- Horizontal support: trend line connecting three generally identical lows;
How to Trade with the Triple Bottom Pattern
When you learn the dynamics of the pattern, verifying it and trading the triple bottom is fairly simple. Let’s illustrate this with a hypothetical situation about a company we will call ABC. In the winter of 2020, ABC was correcting lower to integrate earlier gains.
If you have a look at the daily chart, it’s not hard to locate three low points emerging at the identical price level.
The initial low point is at $628, the second is at $597, and the third is at $616. All prices are split by about two percent from their previous prices.
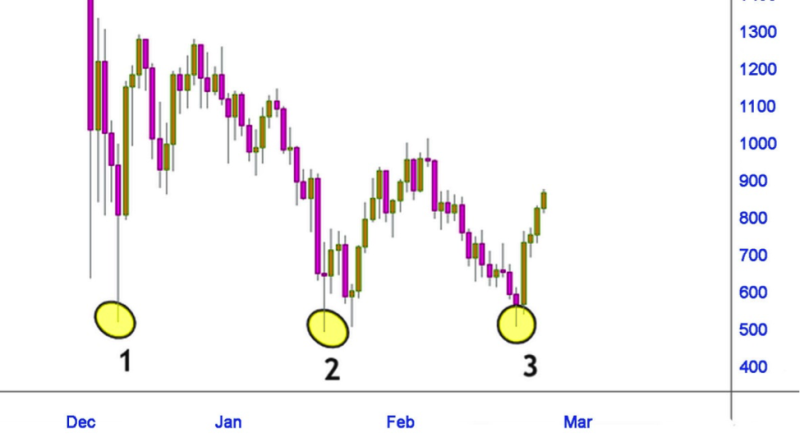
The next stage is to place the entry for the triple bottom pattern. But this can be done, after verification. The triple bottom gets verified when the price goes over the pattern's high point. This point in the pattern gets located by using vertical lines to indicate the first and third bottoms.
After that investors need to locate the highest price point between the two vertical lines and indicate it with a horizontal line. Because the triple bottom is a bullish reversal pattern, investors should place a long position at the breaking point. Meaning traders have to go long at $912.
The point of the stop loss is to reduce potential losses from the trade and gets positioned under the entry. The lowest price point of the ABC triple bottom pattern is $ 597. In a verified breakout higher, the market will move to the same distance to the high point as it goes to the low point of the triple bottom pattern.
Rules for Trading with Triple Bottom
There are a few rules that investors can follow when using the triple bottom chart patterns.
To start, investors have to identify the market stage and see if it is up or down. When the triple bottom emerges during a conclusion of a downtrend, the previous trend will be the downtrend.
Investors need to take a long position if the price breaks from the neckline or the resistance level.
Traders have to locate when the 3 rounding bottoms get created and take into account the bottom's size.
Stop Loss
In the case of the Triple Bottom pattern, the stop gets positioned at the pattern's third-bottom.
Price Target
The price target has to be the same as the distance between the neckline and the bottoms.
The Difference between a Triple Bottom and a Triple Top
Where there is a bullish reversal chart pattern, chances are that soon you will encounter a bearish reversal chart pattern.
The opposite of the triple bottom is the triple top , which is a bearish reversal pattern. In this case, the price action has three attempts to break the resistance, only to achieve three nearly identical highs, and face the inevitable downward trajectory through resistance.
The two are in a nutshell mirror patterns that track the identical phenomenon in the market, a sustained competition among bulls and bears for dominance. This duel lasts until one side triumphs, or in a situation were nobody wins, then the triple bottom and top will develop into a longer-term range.
Also Read: Trading using Double Top pattern and Double bottom pattern
Limitations of a Triple Bottom
Whenever you are using trading charting patterns there will be some degree of uncertainty, because you are using probability. The big issue that is characteristic of most chart patterns is the fact that the triple bottom, can get identified after the trading opportunity has gone by.
It's not unusual for a double bottom to fail and evolve into a triple bottom. While the head and shoulders pattern and the triple bottom are the same.
For most traders, the biggest limitation of a triple bottom in any trading strategy is that it doesn't provide an appropriate balance between risk and reward, and the reason is the positions of the target and stop loss.
Hoping to increase profit opportunities, investors may decide to place stop loss inside the pattern and follow it until the breakout happens. The problem with this approach is the possibility to get stopped in the range for a small loss.
Conclusion
Technical traders benefit from the bottom pattern, which enables them to locate reversal in a trend line. But also estimate the progress the trend will accomplish once formed. Investors need to perceive it as a neutral pattern before the breakout gets verified.
When the price breaks the upper resistance level with a drastic spike in volume, the momentum will probably move the price action up higher.
The pattern is rare, and the scarcity makes it an effective reversal pattern. The reason traders don't encounter it frequently is that 3 nearly identical lows don't occur often.
The triple bottom pattern doesn't have many weaknesses. The biggest problem is that the pattern is not very frequent otherwise it can be a productive reversal pattern.
FAQs
What Is a Triple Bottom Pattern?
The triple bottom pattern indicates a bullish position when buyers assume control of the price action from the sellers. The triple bottom is typically gets represented as 3 generally identical lows that try to break the support but fail in breaching resistance.
Is it a Triple Bottom Bearish?
No, the triple bottom is a bullish chart reversal pattern that creates a trend change to the upside.
What Happens after a Triple Bottom?
Following the 3 low points of a triple bottom, investors can expect a bullish reversal to break out to new price highs. To verify the breakout traders need to locate the triple bottom pattern's high point.
Is Triple Top Bullish or Bearish?
The triple top is a bearish pattern because the pattern stops the uptrend and generates a change in the trend to the downside. Its starts with prices going higher reaching a resistance level, and going back to a support area.