
Trend reversals are a crucial indicator for traders, especially when a long-term trend is a topic. Moreover, the expanding wave of a downward trend is the basic building block of descending broadening wedges, which is a reversal bullish chart pattern showing when a price breaks.
Traders intensively implement chart patterns to predict the market. What makes them special is the symmetry in the patterns.

Also Read: Rising Wedge Pattern: A Complete Guide
Contents
- Broadening Formation Explained
- Identifying the Descending Broadening Wedge Pattern
- What Descending Broadening Wedge Informs Traders?
- Trading with the Descending Broadening Wedge
- How Is Ascending Broadening Wedge Difference?
- Conclusion
- FAQs
Broadening Formation Explained
A broadening formation is a consolidation pattern that can get implemented to signal the chances for a trend reversal. If identified in an uptrend, it indicates a reversal of the market action and not a trend continuation.
The broadening formation occurs if the price oscillates because of a progression of larger highs and smaller lows that moderately increases over time.
It is frequently considered to be present in topping formations, but it's difficult to be a product of the unrealistic expectations of bullish investors.
Broadening is not the same as other consolidation patterns, possesses large wide ranges, and is susceptible to significantly larger levels of volatility over time.
Typically, increasing volume shows a bullish position, but it’s short-lived, and following declines are susceptible to reduced previous support levels, causing a collapse.
Identifying the Descending Broadening Wedge Pattern
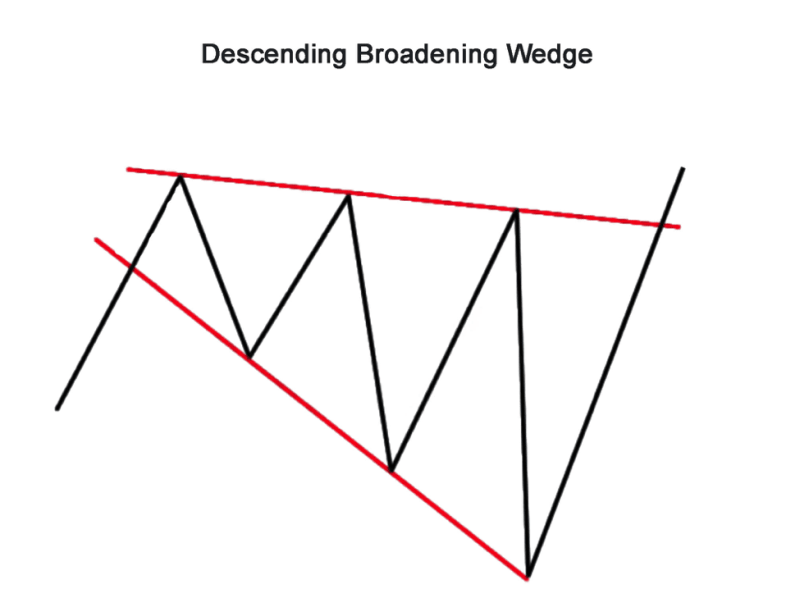
Descending broadening wedge occurs as a wedge pattern, which is a formation with a thick and thin end. When a descending broadening wedge gets observed, the initial point is going to be a narrow end, but the ending point is a thick end that displays the price wave expansion.
To identify the chart pattern on the chart, investors need to perform these steps:
- Locate the wave's beginning point, where the price is going to make smaller lows and smaller highs.
- Every next wave needs to be bigger than the preceding wave.
- Breakout upward and opposite the direction of the preceding trend. The partial decline precedes an upward breakout on the support line.
- Make two trend lines that intersect the waves swing high and low points.
- The initial point of the wedge pattern has to be thin, while the ending point is thick.
- There should be at minimum three waves in a wedge pattern that is descending.
The criteria for locating the pattern on the price chart are very simple, and traders can learn them with ease.
What Descending Broadening Wedge Informs Traders?
The best strategy for the market is price action trading. However, investors can master price action only with screen time.
Price action shows the attitude of a price at specific levels or in the case of conditions like chart patterns.
Descending broadening wedge patterns can get learned by the price action technique, and the reason is the fact the currency chart is going to be overflowing with false signals.
Investors can make an earning by selecting solid trades from the other crowd. The ability to spot the good option is only possible for investors that know to read a chart pattern.
It is assumed that institutional traders typically capture the stop losses of retail investors.
They make purchases if the retail trader sells the asset, and they do the opposite, by selling when the trader purchases an asset.
Because of this if the price reaches smaller lows, and every next wave is larger than the preceding wave then it's expected for the price to make a significant decision.
Before that decision gets made, the retail traders get eliminated. In that type of situation, the last wave of the pattern is going to be bigger compared to the preceding ones.
The market removes retail traders with significant big price moves counter their direction. And the price is in oversold conditions because of successive smaller lows. In this case, a bullish reversal pattern will occur.
Also Read: What Is Hidden Bullish Divergence
Trading with the Descending Broadening Wedge
Trading gets composed of several elements, such as entry, stop loss, take profit level, and the most important risk management techniques.
Most of these factors play a role when a trader uses a descending broadening wedge trading strategy, and we can examine this basic method to trade with the chart pattern.
- But investors can implement different technical analyses tools to improve the chances of success.
- Create a couple of diverging trend lines that intersect at the wave's highs and lows. There have to be at minimum three waves in the wedge pattern.
- Expect a breakout of the upper trendline with a large candlestick.
- Modify it to take the profit level to the beginning point of descending broadening wedge pattern.
- Make a stop-loss under the last lower low performed by the price wave.
- Following the breakout, two possible situations can occur. Investors can start a buy trade following the breakout or expect the price to backtrack following the breakout to receive a high-risk reward setup.
How Is Ascending Broadening Wedge Difference?
In order to get a better understanding of the pattern it’s recommend to look at the execution steps.
- It is needed to wait for the price to trade under the trend line.
- A sell order can be made on the retest of the trendline.
- The sell entry is the point where the price encounters resistance at the wedges lower border.
- The stop-loss can get placed over the patterns high.
- The distance between the entry and the take profit is identical as the wedges height.
Conclusion
In trading, chart patterns are the foundation of technical analysis. They predict the price very precisely.
Yet it is difficult to trade chart patterns like descending broadening wedge patterns by themselves. In combination with other technical tools, investors can create a profitable trading strategy.
Before implementing the chart pattern in trading back test them to use them correctly.
When using a broadening wedge, a breakout usually reverses the wedge’s previous trend.
Because of this if trading with the pattern, expect the reversal, and make the retest, then begin the trade if the support turns into resistance.
Its possible to use the area close to the breakout point to make a stop-loss to safeguard in case the breakout is incorrect.
FAQs
Is a descending broadening wedge bullish?
The descending broadening wedge is bullish and gets estimated to be a reversal pattern. And it makes no difference if the pattern is an indicator of a reversal, the resumption of the downtrend can occur.
How do you measure a descending broadening wedge?
After downward breakouts, calculate the difference between the largest peak and the lowest valley in the chart pattern to find the height. Multiply the height with the over and subtract it from the lowest valley to find the price target.
Is the broadening pattern bullish or bearish?
Typically, broadening wedges are bearish and most long-term investors get characterized by increasing volatility without an obvious move in a particular direction.
Why is a descending wedge bullish?
The descending wedge pattern is bullish and emerges following a bearish trend. It signals that bulls are no longer in control, and bears have assumed dominance over the price. The result is that a price begins to perform at lower lows but an adjusted pace.